. 2025 Jun 27;26(13):6203.
doi: 10.3390/ijms26136203.

Estradiol Prevents Amyloid Beta-Induced Mitochondrial Dysfunction and Neurotoxicity in Alzheimer's Disease via AMPK-Dependent Suppression of NF-κB Signaling

Affiliations

Estradiol Prevents Amyloid Beta-Induced Mitochondrial Dysfunction and Neurotoxicity in Alzheimer's Disease via AMPK-Dependent Suppression of NF-κB Signaling

Pranav Mishra et al. Int J Mol Sci. .

Abstract

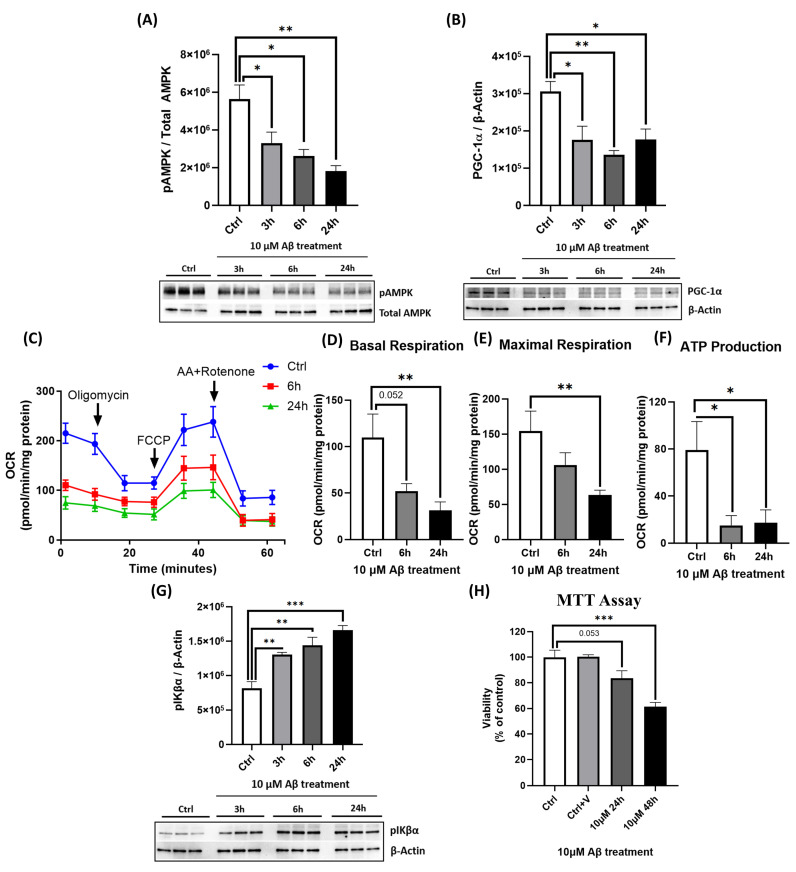
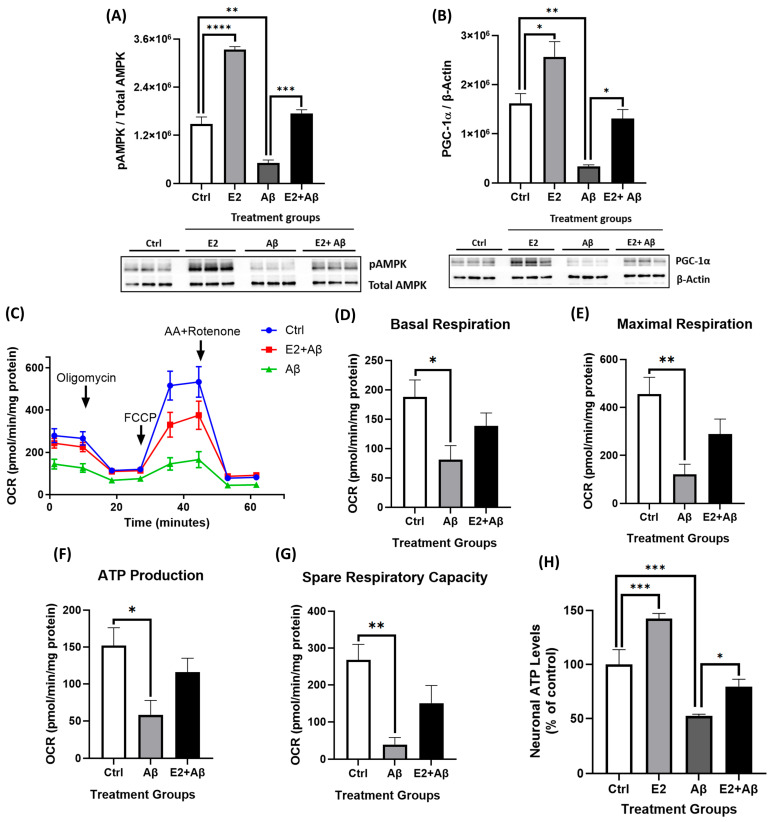
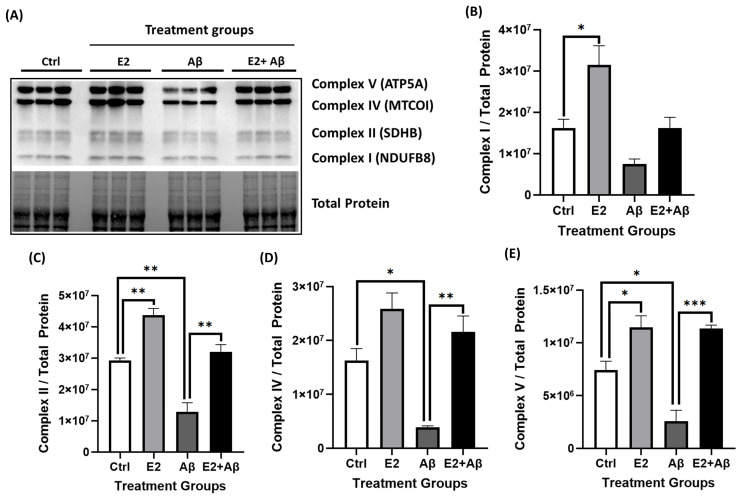
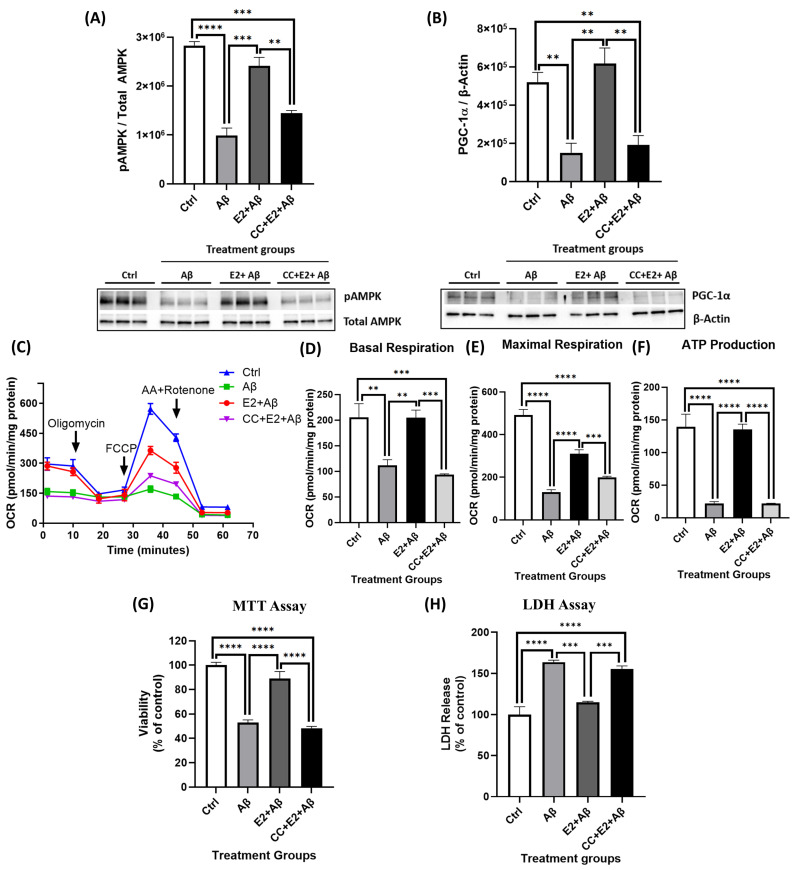
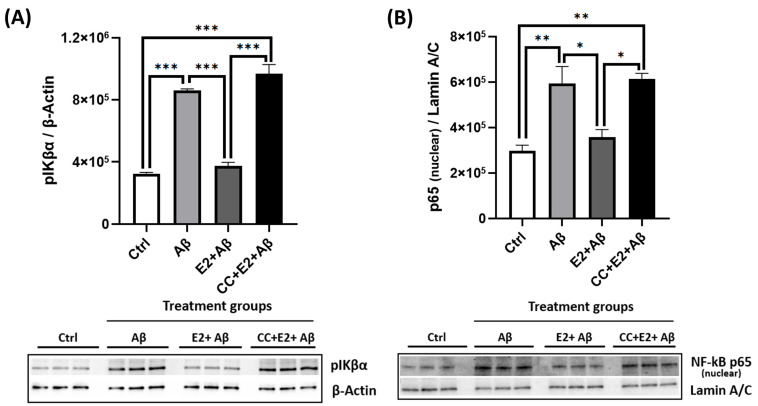
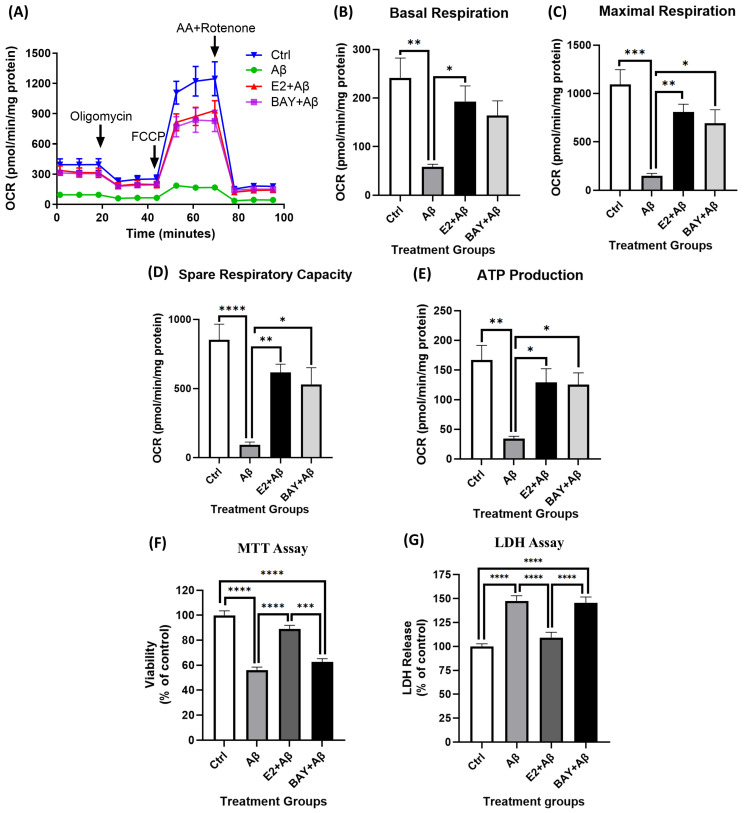
Alzheimer's disease (AD), the most common form of dementia, is a progressive neurodegenerative disorder characterized by memory loss and cognitive decline. In addition to its two major pathological hallmarks, extracellular amyloid beta (Aβ) plaques and intracellular neurofibrillary tangles (NFTs), recent evidence highlights the critical roles of mitochondrial dysfunction and neuroinflammation in disease progression. Aβ impairs mitochondrial function, which, in part, can subsequently trigger inflammatory cascades, creating a vicious cycle of neuronal damage. Estrogen receptors (ERs) are widely expressed throughout the brain, and the sex hormone 17β-estradiol (E2) exerts neuroprotection through both anti-inflammatory and mitochondrial mechanisms. While E2 exhibits neuroprotective properties, its mechanisms against Aβ toxicity remain incompletely understood. In this study, we investigated the neuroprotective effects of E2 against Aβ-induced mitochondrial dysfunction and neuroinflammation in primary cortical neurons, with a particular focus on the role of AMP-activated protein kinase (AMPK). We found that E2 treatment significantly increased phosphorylated AMPK and upregulated the expression of mitochondrial biogenesis regulator peroxisome proliferator-activated receptor gamma coactivator-1 α (PGC-1α), leading to improved mitochondrial respiration. In contrast, Aβ suppressed AMPK and PGC-1α signaling, impaired mitochondrial function, activated the pro-inflammatory nuclear factor kappa-light-chain enhancer of activated B cells (NF-κB), and reduced neuronal viability. E2 pretreatment also rescued Aβ-induced mitochondrial dysfunction, suppressed NF-κB activation, and, importantly, prevented the decline in neuronal viability. However, the pharmacological inhibition of AMPK using Compound C (CC) abolished these protective effects, resulting in mitochondrial collapse, elevated inflammation, and cell death, highlighting AMPK's critical role in mediating E2's actions. Interestingly, while NF-κB inhibition using BAY 11-7082 partially restored mitochondrial respiration, it failed to prevent Aβ-induced cytotoxicity, suggesting that E2's full neuroprotective effects rely on broader AMPK-dependent mechanisms beyond NF-κB suppression alone. Together, these findings establish AMPK as a key mediator of E2's protective effects against Aβ-driven mitochondrial dysfunction and neuroinflammation, providing new insights into estrogen-based therapeutic strategies for AD.

Keywords: AMPK; Alzheimer’s disease; Amyloid-β; NF-κB; estradiol; mitochondria; neuroinflammation; neuroprotection.


Conflict of interest statement

P.M., E.K.E., and B.C.A. declare that they have no competing interests. P.F. is a cofounder and shareholder in a small biotech company, WinSanTor Inc., that is developing antimuscarinic drugs for the treatment of peripheral neuropathy.

Figures

Figure 1
Figure 1
E2 activates AMPK, increases PGC-1α levels, and enhances mitochondrial function in primary cortical neurons. Primary cortical neurons were treated with or without E2 at various doses (0.1–10 nM) and for different durations (15 min to 24 h) as indicated. E2 was dissolved in DMSO (vehicle, final concentration <0.1%). Cell lysates were analyzed by Western blotting for (AC) pAMPK (normalized to total AMPK) and (D,E) PGC-1α (normalized to β-actin). (FH) Mitochondrial oxygen consumption rate (OCR), maximal respiration, and spare respiratory capacity were measured via a Seahorse XF24 Analyzer after 3 h, 6 h, and 24 h E2 treatment, and OCR (O2 in pmol/min) was normalized to protein concentration per well. Data are expressed as mean ± SEM, with n = 3 replicate cultures for Western blot analyses (AE) and n = 5 replicate cultures for Seahorse assays (FH). Statistical significance was determined by one-way ANOVA with Dunnett’s post hoc test; * p < 0.05, ** p < 0.01, *** p < 0.001, and **** p < 0.0001.
Figure 2
Figure 2
E2 suppresses NF-κB signaling in primary cortical neurons. Primary cortical neurons were treated with 10 nM E2 for various durations (15 min to 24 h). Cell lysates were analyzed by Western blotting for (A) acute (15–60 min) and (B) prolonged (6–24 h) changes in phosphorylated IκBα (pIκBα) levels, normalized to β-actin. Data are expressed as mean ± SEM, with n = 3 replicate cultures. Statistical significance was determined by one-way ANOVA with Dunnett’s post hoc test; * p < 0.05 and ** p < 0.01.
Figure 3
Figure 3
Aβ suppresses AMPK activation, decreases PGC-1α levels, impairs mitochondrial function, activates NF-κB, and reduces cell viability in primary cortical neurons. Primary cortical neurons were treated with 10 μM Aβ for 3, 6, or 24 h as indicated. Cell lysates were analyzed by Western blotting for (A) pAMPK (normalized to total AMPK), (B) PGC-1α (normalized to β-actin), and (G) pIκBα (normalized to β-actin). (CF) OCR, including basal respiration, maximal respiration, and ATP production, was measured using the Seahorse XF24 Analyzer after 6 and 24 h of Aβ treatment (OCR was normalized to protein concentration per well). (H) Cell viability was assessed by an MTT assay after 24 or 48 h of Aβ treatment, with data shown as a percentage of the control group. Data are expressed as mean ± SEM, with n = 3 replicate cultures for Western blot analyses (A,B,G), n = 6–7 replicate cultures for Seahorse assays (CF), and n = 4 replicate cultures for MTT assay (H). Statistical significance was determined by one-way ANOVA with Dunnett’s post hoc test; * p < 0.05, ** p < 0.01, and *** p < 0.001.
Figure 4
Figure 4
E2 pretreatment rescues Aβ-induced mitochondrial dysfunction, restores AMPK and PGC-1α levels, and enhances mitochondrial bioenergetics. Primary cortical neurons were pretreated with 10 nM E2 for 48 h before exposure to 10 μM Aβ for 24 h. (A) pAMPK levels (normalized to total AMPK) and (B) PGC-1α levels (normalized to β-actin) were analyzed by Western blotting. (CG) OCR, including basal respiration, maximal respiration, ATP production, and spare respiratory capacity, was measured using the Seahorse XF24 Analyzer and normalized to protein concentration per well. (H) Cellular ATP levels (normalized to total protein) were measured using a luminescent ATP determination kit. Data are expressed as mean ± SEM, with n = 3 replicate cultures for Western blot analyses (A,B) and ATP assays (H) and n = 6–7 replicate cultures for Seahorse assays (CG). Statistical significance was determined by one-way ANOVA with Tukey’s post hoc test; * p < 0.05, ** p < 0.01, *** p < 0.001, and **** p < 0.0001.
Figure 5
Figure 5
E2 pretreatment restores the Aβ-induced loss of mitochondrial electron transport chain (ETC) complexes. Primary cortical neurons were pretreated with 10 nM E2 for 48 h before exposure to 10 μM Aβ for 24 h. Mitochondrial ETC complex levels were assessed by Western blotting: (AE) Complex I (NDUFB8), Complex II (SDHB), Complex IV (MTCO1), and Complex V (ATP5A) (normalized to total protein). Data are expressed as mean ± SEM, with n = 3 replicate cultures. Statistical significance was determined by one-way ANOVA with Tukey’s post hoc test; * p < 0.05, ** p < 0.01, and *** p < 0.001.
Figure 6
Figure 6
E2 pretreatment suppresses Aβ-induced NF-κB subunit expression, inflammasome activity, and pro-inflammatory cytokine production in primary cortical neurons. Primary cortical neurons were pretreated with 10 nM E2 for 48 h before exposure to 10 μM Aβ for 24 h. (A) pIκBα levels (normalized to β-actin) and (B) nuclear NF-κB p65 levels (normalized to Lamin A/C) were determined by Western blotting. (C) NF-κB activation was assessed by measuring the DNA binding activity of the NF-κB p65 subunit with respect to a specific dsDNA sequence containing the NF-κB response element, with data normalized to the total protein concentration in nuclear extracts. (D) Caspase-1 activity, a measure of inflammasome activation, was determined by a luminescence assay; the selective caspase-1 inhibitor Ac-YVAD-CHO was used to confirm specificity. (E) Pro-inflammatory (IL-1β, IL-6, TNFα, and IL-18) and anti-inflammatory (IL-10) cytokine levels in cell culture supernatants were measured by ELISA and reported as fold change relative to the control group. Data are expressed as mean ± SEM, with n = 3 replicate cultures for Western blot and NF-κB DNA binding assays (AC) and n = 4 replicate cultures for caspase-1 activity and ELISA (D,E). Statistical significance was determined by one-way ANOVA with Tukey’s post hoc test; * p < 0.05, ** p < 0.01, *** p < 0.001, and **** p < 0.0001.
Figure 7
Figure 7
E2 pretreatment rescues Aβ-induced cytotoxicity and improves neuronal viability. Primary cortical neurons were pretreated with 10 nM E2 for 48 h before exposure to 10 μM Aβ for 48 h. (A) Cell viability was assessed using the MTT assay, and (B) cytotoxicity was measured using the LDH assay. Data are presented as a percentage of the control group and expressed as mean ± SEM, with n = 3–4 replicate cultures. Statistical significance was determined by one-way ANOVA followed by Tukey’s post hoc test; ** p < 0.01, *** p < 0.001, and **** p < 0.0001.
Figure 8
Figure 8
Blocking AMPK abolishes E2’s protective effects against Aβ-induced mitochondrial dysfunction and neurotoxicity. Primary cortical neurons were treated with 10 μM Aβ alone for 24 h, pretreated with 10 nM E2 for 48 h followed by Aβ, or pretreated with 5 μM Compound C (CC) for 1 h followed by E2 and Aβ. (A) pAMPK levels (normalized to total AMPK) and (B) PGC-1α levels (normalized to β-actin) were analyzed by Western blotting. (CF) OCR, including basal respiration, maximal respiration, and ATP production, was measured via Seahorse XF24 Analyzer and normalized to protein concentration per well. (G) Cell viability was assessed by MTT assay, and (H) cytotoxicity was measured using the LDH assay, with data expressed as a percentage of the control group. Data are presented as mean ± SEM, with n = 3 replicate cultures for Western blot analyses (A,B), n = 5 replicate cultures for Seahorse assays (CF), and n = 4 replicate cultures for MTT (G) and LDH (H) assays. Statistical significance was determined by one-way ANOVA with Tukey’s post hoc test; ** p < 0.01, *** p < 0.001, and **** p < 0.0001.
Figure 9
Figure 9
AMPK inhibition abolishes E2’s suppression of Aβ-induced NF-κB subunit expression and translocation. Primary cortical neurons were treated with 10 μM Aβ alone for 24 h, pretreated with 10 nM E2 for 48 h followed by Aβ, or pretreated with 5 μM Compound C (CC) for 1 h before E2 and Aβ. (A) pIκBα levels (normalized to β-actin) and (B) nuclear NF-κB p65 levels (normalized to Lamin A/C) were analyzed by Western blotting. Data are presented as mean ± SEM, with n = 3 replicate cultures. Statistical significance was determined by one-way ANOVA with Tukey’s post hoc test; * p < 0.05, ** p < 0.01, and *** p < 0.001.
Figure 10
Figure 10
NF-κB inhibition rescues mitochondrial dysfunction but not Aβ-induced cytotoxicity. Primary cortical neurons were treated with 10 μM Aβ alone, pretreated with 10 nM E2 for 48 h followed by Aβ, or pretreated with 3 μM BAY 11-7082 (NF-κB inhibitor) for 1 h before Aβ exposure. (AE) Mitochondrial OCR parameters, including basal respiration, maximal respiration, ATP production, and spare respiratory capacity, were measured using the Seahorse XF24 Analyzer after 24 h of Aβ exposure. Data were normalized to protein concentration per well and are presented as mean ± SEM, n = 5 replicate cultures. (F) Cell viability was assessed by MTT assays, and (G) cytotoxicity was measured using the LDH assay after 48 h of Aβ exposure, with data shown as a percentage of the control group and presented as mean ± SEM, n = 4 replicate cultures. Statistical significance was determined by one-way ANOVA followed by Tukey’s post hoc test; * p < 0.05, ** p < 0.01, *** p < 0.001, and **** p < 0.0001.

Similar articles

References

    1. Jahn H. Memory loss in Alzheimer’s disease. Dialogues Clin. Neurosci. 2013;15:445–454. doi: 10.31887/DCNS.2013.15.4/hjahn. - DOI - PMC - PubMed
    1. Santiago J.A., Potashkin J.A. The Impact of Disease Comorbidities in Alzheimer’s Disease. Front. Aging Neurosci. 2021;13:631770. doi: 10.3389/fnagi.2021.631770. - DOI - PMC - PubMed
    1. Howe E. Improving the quality of life in patients with Alzheimer’s disease. Psychiatry. 2008;5:51–56. - PMC - PubMed
    1. Emma N., Steinmetz J.D., Vollset S.E., Fukutaki K. Estimation of the global prevalence of dementia in 2019 and forecasted prevalence in 2050: An analysis for the Global Burden of Disease Study 2019. Lancet Public. Health. 2022;7:e105–e125. - PMC - PubMed
    1. Gallardo G., Holtzman D.M. Amyloid-β and Tau at the Crossroads of Alzheimer’s Disease. Adv. Exp. Med. Biol. 2019;1184:187–203. - PubMed

MeSH terms

Substances

LinkOut - more resources