

Integrated Metabolomic and Gut Microbiome Profiles Reveal Postmortem Biomarkers of Fatal Anaphylaxis
- PMID: 40650070
- PMCID: PMC12249648
- DOI: 10.3390/ijms26136292
Integrated Metabolomic and Gut Microbiome Profiles Reveal Postmortem Biomarkers of Fatal Anaphylaxis
Abstract
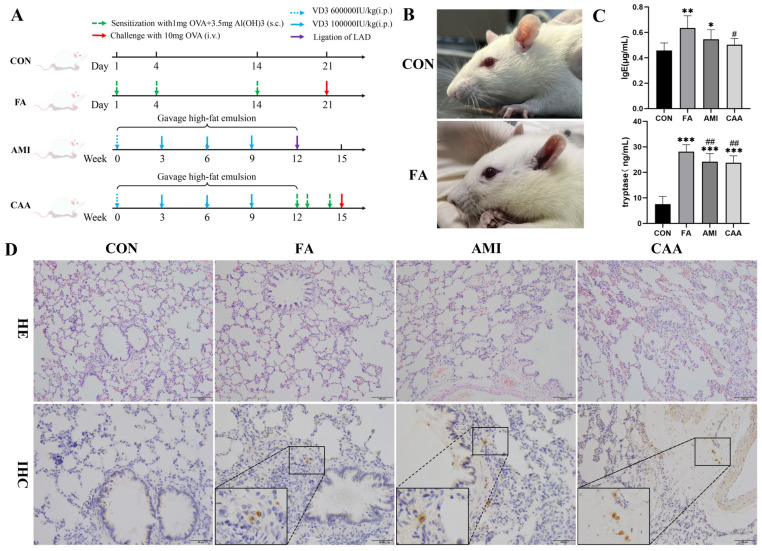
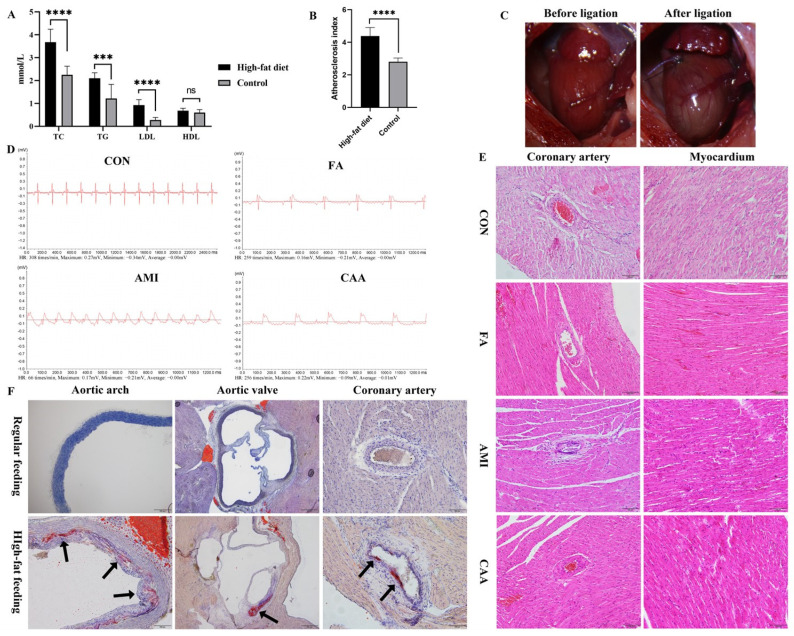
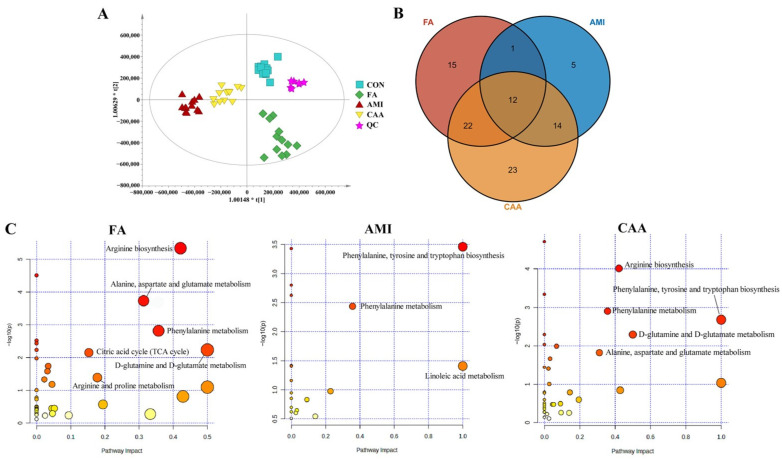
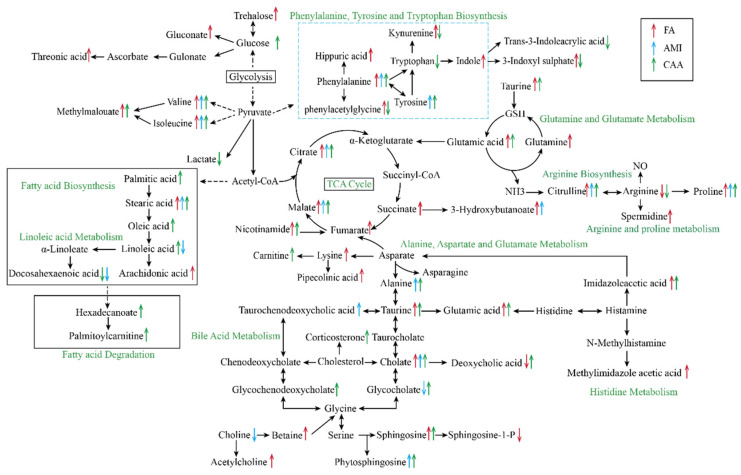
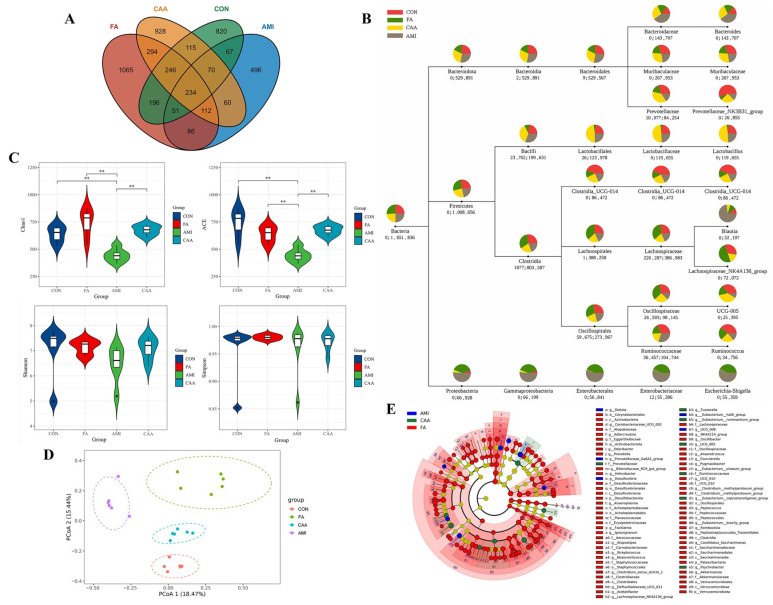
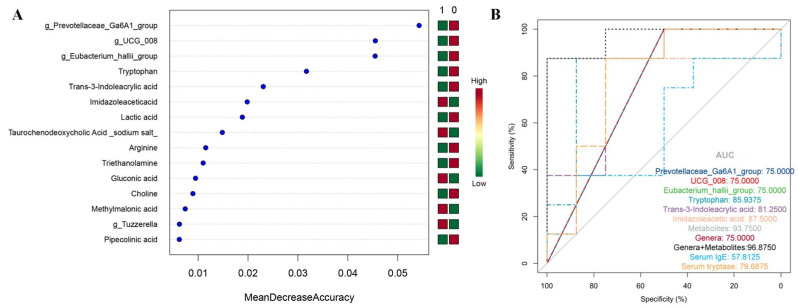
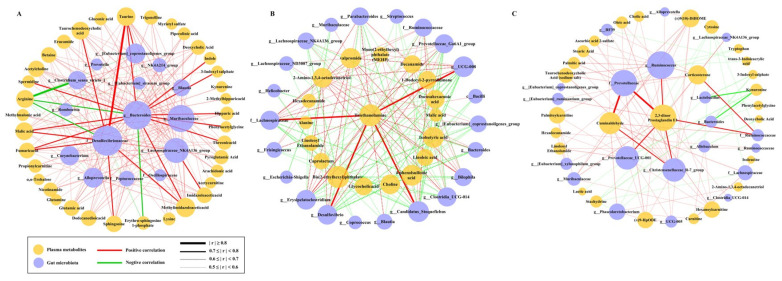
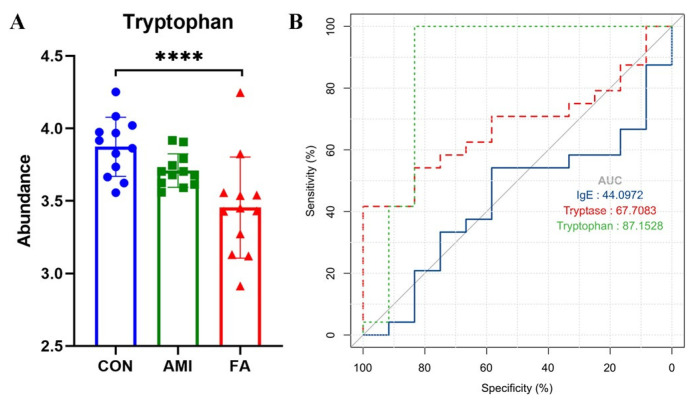
The incidence of fatal anaphylaxis is increasing, but there is still no recognized "golden standard" for forensic diagnosis. Due to its non-specific symptoms, especially cardiovascular symptoms without cutaneous changes, it can easily be misdiagnosed as acute myocardial infarction. Here, we established rat models (n = 12) of fatal anaphylaxis (FA), acute myocardial infarction (AMI), and coronary atherosclerosis with anaphylaxis (CAA). The untargeted metabolomics of plasma and 16S rRNA sequencing of fecal matter was performed, and a random forest was used to identify potential biomarkers. Three metabolites (tryptophan, trans-3-indole acrylic acid, and imidazole acetic acid) and three microbial genera (g_Prevotellaceae_Ga6A1_group, g_UCG_008, and g_Eubacterium_hallii_group) were identified as potential biomarkers for distinguishing anaphylaxis and non-anaphylaxis. The classification model of plasma metabolites showed a much better discriminatory performance than that of microbial genus, serum IgE, and tryptase. The performance of the microbial genera was superior to the serum IgE but inferior to the serum tryptase. Forensic samples of fatal anaphylaxis and non-anaphylaxis deaths (n = 12) were collected for untargeted metabolomics detection. The results showed that among the three identified metabolic biomarkers, tryptophan has better stability in cadaveric blood samples. Its diagnostic performance (AUC = 87.1528) was superior to serum IgE and tryptase, making it more suitable as a postmortem biomarker of fatal anaphylaxis.
Keywords: acute myocardial infarction; biomarker; fatal anaphylaxis; forensic pathology; gut microbiome; metabolomics.
Conflict of interest statement
The authors declare no conflict of interest.
Figures
Similar articles
-
Diagnostic role of serum tryptase in anaphylactic deaths in forensic medicine: a systematic review and meta-analysis.Forensic Sci Med Pathol. 2018 Jun;14(2):209-215. doi: 10.1007/s12024-018-9980-z. Epub 2018 Apr 21. Forensic Sci Med Pathol. 2018. PMID: 29679215
-
Modified Renshen Wumei Decoction Improves Qi-Yin Deficiency Diarrhea by Regulating the Gut Microbiotas and Metabolites in Rats.J Microbiol Biotechnol. 2025 Jun 23;35:e2412037. doi: 10.4014/jmb.2412.12037. J Microbiol Biotechnol. 2025. PMID: 40582763 Free PMC article.
-
Integrating Gut Microbiome and Metabolomics with Magnetic Resonance Enterography to Advance Bowel Damage Prediction in Crohn's Disease.J Inflamm Res. 2025 Jun 11;18:7631-7649. doi: 10.2147/JIR.S524671. eCollection 2025. J Inflamm Res. 2025. PMID: 40535353 Free PMC article.
-
Alternations of Gut Microbiome and Serum Metabolome With Prolongation of the Course of Type 1 Diabetes Mellitus.Diabetes Metab Res Rev. 2025 Sep;41(6):e70076. doi: 10.1002/dmrr.70076. Diabetes Metab Res Rev. 2025. PMID: 40770823
-
Endovascular treatment for ruptured abdominal aortic aneurysm.Cochrane Database Syst Rev. 2017 May 26;5(5):CD005261. doi: 10.1002/14651858.CD005261.pub4. Cochrane Database Syst Rev. 2017. PMID: 28548204 Free PMC article.
References
-
- Dribin T.E., Muraro A., Camargo C.A., Jr., Turner P.J., Wang J., Roberts G., Anagnostou A., Halken S., Liebermann J., Worm M., et al. Anaphylaxis Definition, Overview, and Clinical Support Tool: 2024 Consensus Report—a GA2LEN project. J. Allergy Clin. Immunol. 2025 doi: 10.1016/j.jaci.2025.01.021. - DOI - PubMed
-
- Cardona V., Ansotegui I.J., Ebisawa M., El-Gamal Y., Fernandez Rivas M., Fineman S., Geller M., Gonzalez-Estrada A., Greenberger P.A., Sanchez Borges M., et al. World allergy organization anaphylaxis guidance 2020. World Allergy Organ. J. 2020;13:100472. doi: 10.1016/j.waojou.2020.100472. - DOI - PMC - PubMed
MeSH terms
Substances
Grants and funding
LinkOut - more resources
Full Text Sources
Medical
