

Genome-Wide Association Study and RNA-Seq Analysis Uncover Candidate Genes Controlling Growth Traits in Red Tilapia (Oreochromis spp.) Under Hyperosmotic Stress
- PMID: 40650265
- PMCID: PMC12249547
- DOI: 10.3390/ijms26136492
Genome-Wide Association Study and RNA-Seq Analysis Uncover Candidate Genes Controlling Growth Traits in Red Tilapia (Oreochromis spp.) Under Hyperosmotic Stress
Abstract
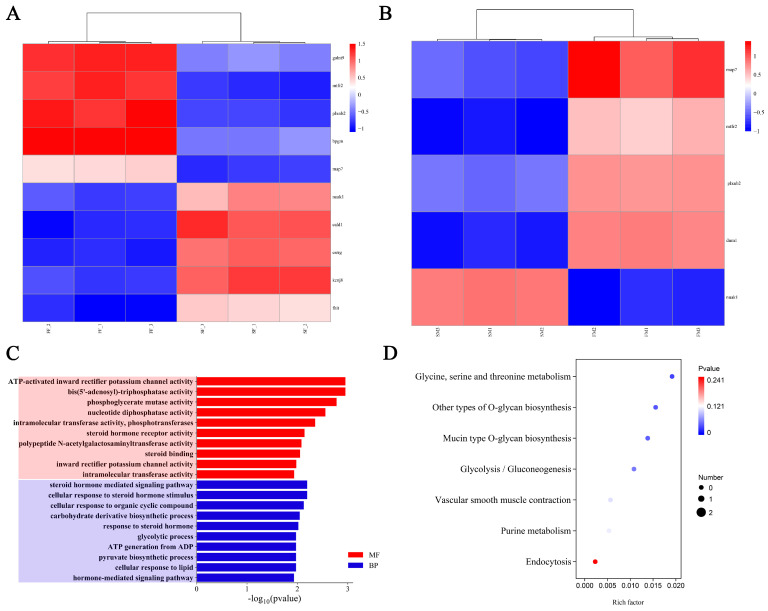
Growth traits are the most important economic traits in red tilapia (Oreochromis spp.) production, and are the main targets for its genetic improvement. Increasing salinity levels in the environment are affecting the growth, development, and molecular processes of aquatic animals. Red tilapia tolerates saline water to some degree. However, few credible genetic markers or potential genes are available for choosing fast-growth traits in salt-tolerant red tilapia. This work used genome-wide association study (GWAS) and RNA-sequencing (RNA-seq) to discover genes related to four growth traits in red tilapia cultured in saline water. Through genotyping, it was determined that 22 chromosomes have 12,776,921 high-quality single-nucleotide polymorphisms (SNPs). One significant SNP and eight suggestive SNPs were obtained, explaining 0.0019% to 0.3873% of phenotypic variance. A significant SNP peak associated with red tilapia growth traits was located on chr7 (chr7-47464467), and plxnb2 was identified as the candidate gene in this region. A total of 501 differentially expressed genes (DEGs) were found in the muscle of fast-growing individuals compared to those of slow-growing ones, according to a transcriptome analysis. Combining the findings of the GWAS and RNA-seq analysis, 11 candidate genes were identified, namely galnt9, esrrg, map7, mtfr2, kcnj8, fhit, dnm1, cald1, plxnb2, nuak1, and bpgm. These genes were involved in 'other types of O-glycan biosynthesis', 'glycine, serine and threonine metabolism', 'glycolysis/gluconeogenesis', 'mucin-type O-glycan biosynthesis' and 'purine metabolism signaling' pathways. We have developed molecular markers to genetically breed red tilapia that grow quickly in salty water. Our study lays the foundation for the future marker-assisted selection of growth traits in salt-tolerant red tilapia.
Keywords: GWAS; RNA-seq; candidate gene; growth traits; red tilapia.
Conflict of interest statement
The authors declare no conflicts of interest.
Figures


References
-
- Lu R.Z., He H.G. Effects of different salinity on juvenile growth of Oreochromis niloticus, Sarotherodon melanotheron and Israeli red tilapia. North. Chin. Fish. 2024;43:149–152.
-
- Chen H.Q., Bi B., Hu Q. Effects of different salinity acclimation on tilapia muscle quality, serum biochemical profiles and Na+-K+-ATPase activity. J. Yunnan Agric. Univ. Nat. Sci. 2022;37:971–978.
-
- Head W.D., Zerbi A., Watanabe W.O. Preliminary observations on the marketability of saltwater-cultured florida red tilapia in Puerto Rico. J. World Aquac. Soc. 1994;25:432–441. doi: 10.1111/j.1749-7345.1994.tb00227.x. - DOI
-
- Eknath A.E., Tayamen M.M., Palada-de Vera M.S., Danting J.C., Reyes R.A., Dionisio E.E., Capili J.B., Bolivar H.L., Abella T.A., Circa A.V. Genetics in Aquaculture. Elsevier; Amsterdam, The Netherlands: 1993. Genetic improvement of farmed tilapias: The growth performance of eight strains of Oreochromis niloticus tested in different farm environments; pp. 171–188.
MeSH terms
Grants and funding
LinkOut - more resources
Full Text Sources
Miscellaneous
