. 2025 Jul 5;26(13):6495.
doi: 10.3390/ijms26136495.

PEMFs Restore Mitochondrial and CREB/BDNF Signaling in Oxidatively Stressed PC12 Cells Targeting Neurodegeneration

Affiliations

PEMFs Restore Mitochondrial and CREB/BDNF Signaling in Oxidatively Stressed PC12 Cells Targeting Neurodegeneration

Stefania Merighi et al. Int J Mol Sci. .

Abstract

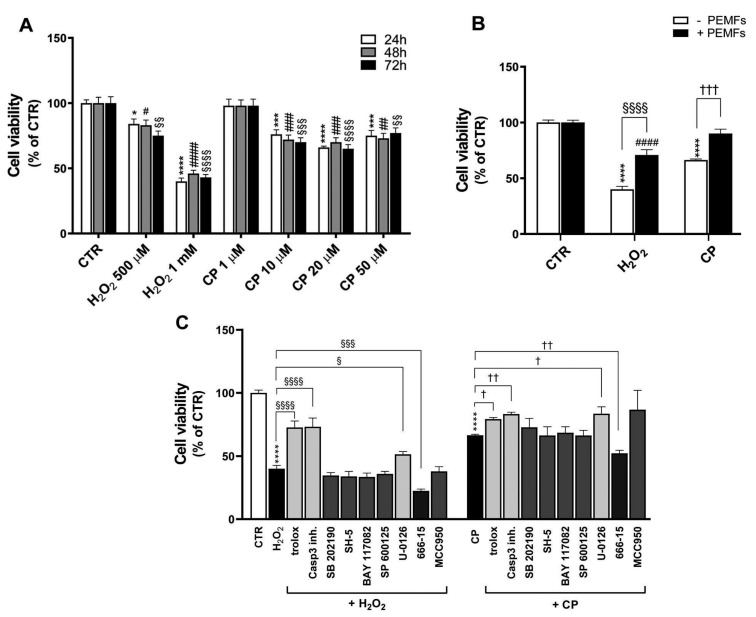
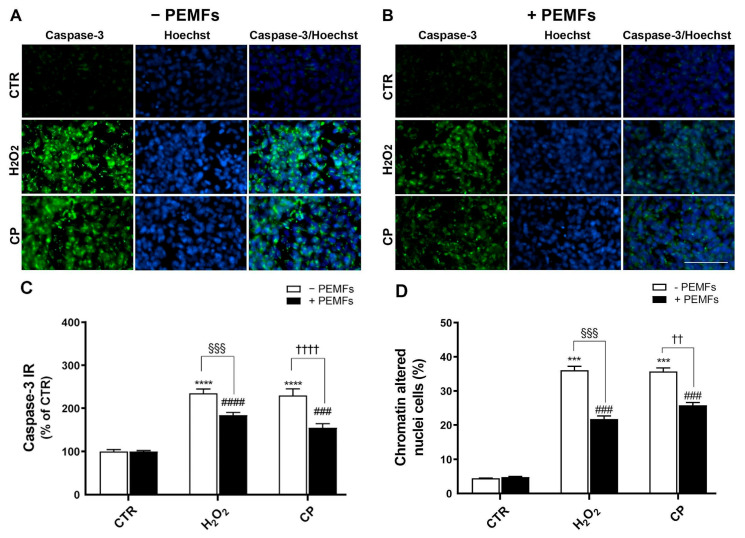
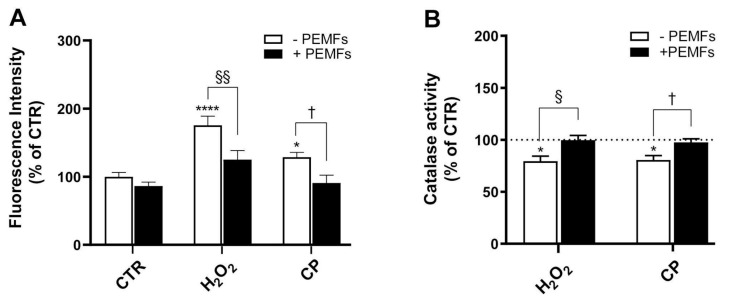
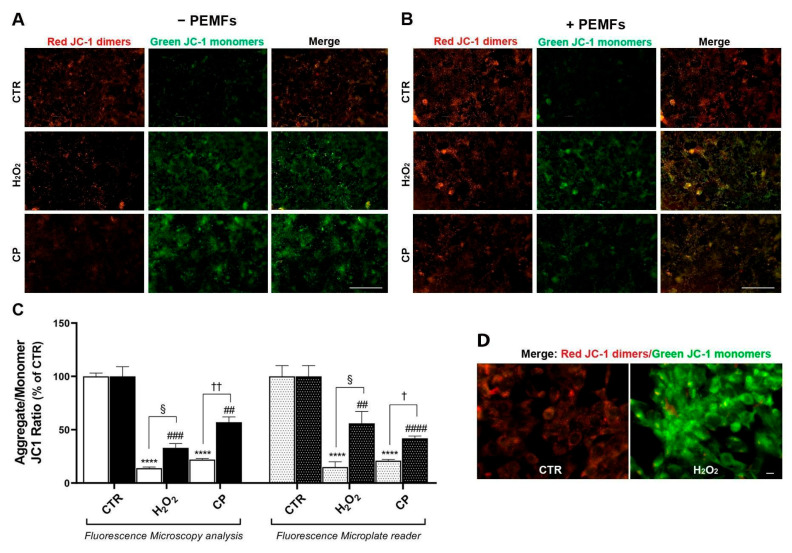
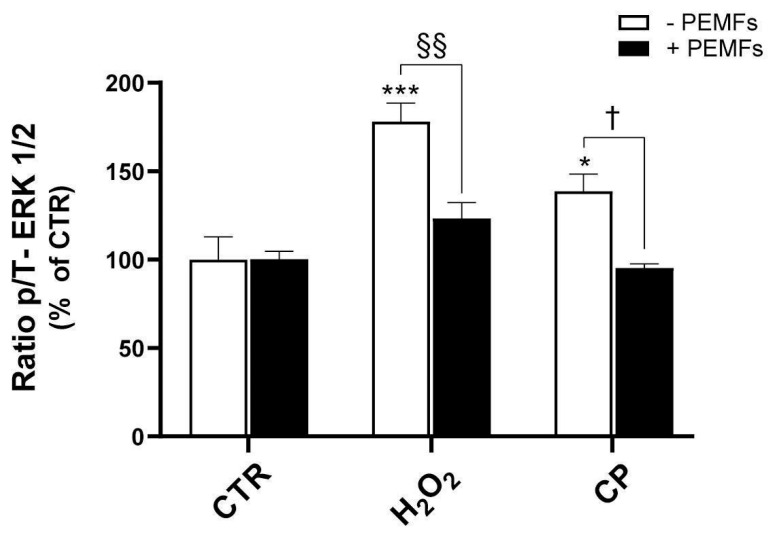
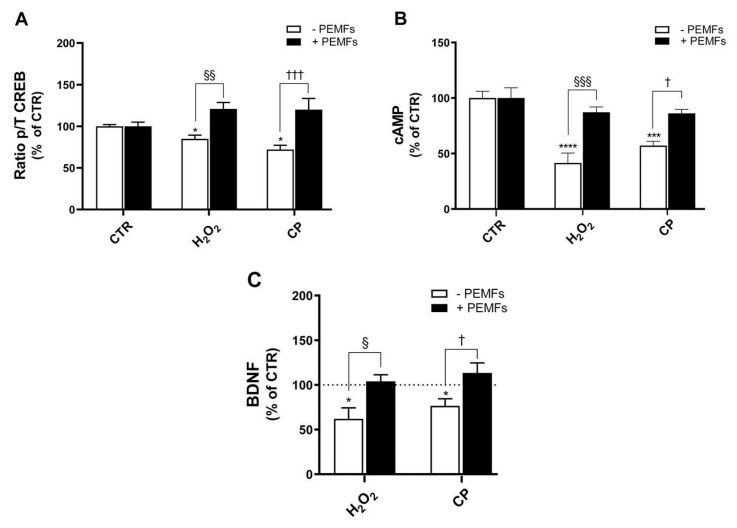
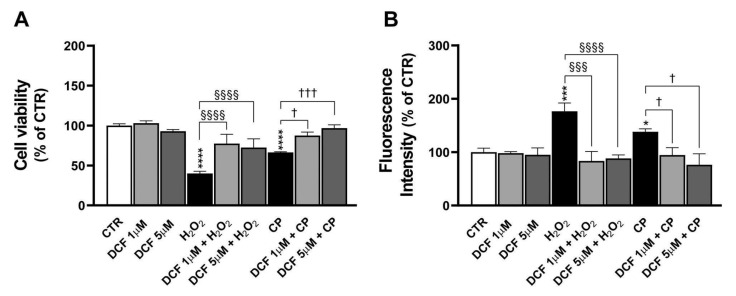
Alzheimer's disease (AD), the most prevalent form of neurodegenerative dementia, is characterized by progressive cognitive decline and neuronal loss. Despite advances in pharmacological treatments, current therapies remain limited in efficacy and often induce adverse effects. Increasing evidence highlights oxidative stress, mitochondrial dysfunction, and disrupted neurotrophic signaling as key contributors to AD pathogenesis. Pulsed electromagnetic fields (PEMFs) are emerging as a non-invasive, multifactorial approach with promising biological effects. In this study, we investigated the neuroprotective potential of PEMFs in NGF-differentiated PC12 cells exposed to hydrogen peroxide (H2O2) or amyloid-β peptide (Aβ), both of which model pathological features of AD. PEMF treatment significantly counteracted H2O2- and Aβ-induced cytotoxicity by restoring cell viability, reducing reactive oxygen species production, and improving catalase activity. Furthermore, PEMFs preserved the mitochondrial membrane potential and decreased caspase-3 activation and chromatin condensation. Mechanistically, PEMFs inhibited ERK phosphorylation and enhanced cAMP levels, CREB phosphorylation, and BDNF expression, pathways known to support neuronal survival and plasticity. In conclusion, these findings suggest that PEMFs modulate multiple stress response systems, promoting neuroprotection under oxidative and amyloidogenic conditions.

Keywords: Alzheimer’s disease; BDNF; CREB; ERK; MMP; PC12 cells; PEMFs; cAMP; neuroprotection; oxidative stress.


Conflict of interest statement

This study was supported by Igea S.p.A., which provided financial and technical support related to the PEMF device used. However, Igea S.p.A. had no role in the study design, data collection, analysis, interpretation of the results, or decision to submit the paper for publication. S.S. and R.C. helped in the manuscript’s preparation, specifically in the description of the PEMF stimulation device. S.S. and R.C. were involved in the final proofreading of the manuscript. The other authors declare no conflicts of interest.

Figures

Figure 1
Figure 1
H2O2- and CP-induced cytotoxicity in PC12 cells. (A) Cells were treated with different concentrations of H2O2 and CP for 24, 48, and 72 h. Results are presented as mean ± SEM values of at least three independent experiments performed in duplicate (* p < 0.05, *** p < 0.001, **** p < 0.0001 vs. control (CTR) for 24 h; # p < 0.05, ## p < 0.01, ### p < 0.001, #### p < 0.0001 vs. CTR for 48 h; §§ p < 0.01, §§§ p < 0.001, §§§§ p < 0.0001 vs. CTR for 72 h). (B) Cell viability was studied in 1 mM H2O2- and 20 μM CP-injured cells for 24 h with and without PEMFs. Results are presented as mean ± SEM values of at least seven independent experiments performed in duplicate (**** p < 0.0001 vs. CTR without PEMFs; #### p < 0.0001 vs. CTR with PEMFs; §§§§ p < 0.0001, ††† p < 0.001). (C) Effects of cell pretreatment for 30 min with 500 μM Trolox, 1 μM caspase-3 inhibitor, SB 202190, SH-5, BAY 117082, SP 600125, U-0126, MCC950, and 10 μM 666-15 on the viability of PC12 cells injured with 1 mM H2O2 or 20 μM CP. Results are presented as mean ± SEM values of at least three independent experiments performed in duplicate (**** p < 0.0001 vs. CTR; §§§§ p < 0.0001, §§§ p < 0.001, § p < 0.05; †† p < 0.01,  p < 0.05). Statistical analysis was performed by one-way analysis of variance (ANOVA) and Sidak’s multiple comparison test. PEMFs, pulsed electromagnetic fields.
Figure 2
Figure 2
PEMFs’ effects on cleaved caspase-3 in PC12 cells. Representative images of cleaved caspase-3-positive PC12 cells (green) in control (CTR) group and with 1 mM H2O2 or 20 μM CP treatment for 90 min, without (A) and with (B) PEMFs. Hoechst 33342 nuclear staining (blue) and a merged image of cleaved caspase-3/Hoechst 33342 nuclear staining are included. Scale bar 100 μm. (C) Analysis of cleaved caspase-3 immunoreactivity (IR) normalized to the number of cells. Results are presented as mean ± SEM values of at least three independent experiments performed in duplicate (**** p < 0.0001 vs. CTR without PEMFs; #### p < 0.0001 and ### p < 0.001 vs. CTR with PEMFs, respectively; §§§ p < 0.001; †††† p < 0.0001). (D) Analysis of Hoechst 33342 chromatin-altered nuclei in cells. Data are presented as mean ± SEM values (*** p < 0.001 vs. CTR without PEMFs; ### p < 0.001 vs. CTR with PEMFs; §§§ p < 0.001; †† p < 0.01). Statistical analysis was performed by one-way ANOVA and Sidak’s multiple comparison test.
Figure 3
Figure 3
PEMFs’ effects on oxidative stress and catalase enzyme activity in H2O2- and CP-injured PC12 cells. (A) ROS levels in PC12 cells treated with 1 mM H2O2 or 20 μM CP for 24 h through H2DCFDA test. Results are presented as mean ± SEM values of at least five independent experiments performed in duplicate (**** p < 0.0001 and * p < 0.05 vs. control (CTR) without PEMFs, respectively; §§ p < 0.01;  p < 0.05). (B) Catalase activity measured after cell treatment with 200 μM H2O2 or 20 μM CP for 4 h. Results are presented as mean ± SEM values of at least four independent experiments performed in duplicate (* p < 0.05 vs. CTR without PEMFs; § p < 0.05;  p < 0.05). Statistical analysis was performed by one-way ANOVA and Sidak’s multiple comparison test. ROS, reactive oxygen species; H2DCFDA, 2′,7′-dichlorodihydrofluorescein diacetate.
Figure 4
Figure 4
PEMFs’ effects on MMP depolarization in PC12 cells. Representative images of JC-1 staining in 1 mM H2O2- or 20 μM CP-treated cells for 90 min, without (A) and with PEMFs (B). Scale bar 100 μm. (C) The graph includes the results of fluorescence microscope images and fluorescence microplate reader analyses, expressed as the red/green ratio percentage of the control group (CTR). These results are presented as mean ± SEM values of at least three independent experiments performed in duplicate (**** p < 0.0001 vs. CTR without PEMFs; ### p < 0.001, ## p < 0.01, ##### p < 0.0001 vs. CTR with PEMFs; § p < 0.05;  p < 0.05, †† p < 0.01). Statistical analysis was performed by one-way ANOVA and Sidak’s multiple comparison test. (D) Representative high-magnification images of JC-1-stained cells under CTR and after treatment with 1 mM H2O2. Scale bar 10 μm. MMP, mitochondrial membrane potential.
Figure 5
Figure 5
PEMFs’ effects on ERK1/2 in PC12 cells. Quantification of total (T) and phosphorylated (p) forms of ERK1/2 after 1 mM H2O2 or 20 μM CP treatment of cells for 20 min. Results are presented as mean ± SEM values of at least three independent experiments performed in duplicate (*** p < 0.001 and * p < 0.05 vs. control (CTR) without PEMFs; §§ p < 0.01;  p < 0.05). Statistical analysis was performed by one-way ANOVA and Sidak’s multiple comparison test.
Figure 6
Figure 6
PEMFs’ effects on CREB, cAMP, and BDNF in PC12 cells. (A) Total (T) and phosphorylated (p) forms of CREB after 1 mM H2O2 or 20 μM CP treatment of cells for 20 min. Results are presented as mean ± SEM values of at least four independent experiments performed in duplicate (* p < 0.05 vs. control (CTR) without PEMFs; §§ p < 0.01; ††† p < 0.001). (B) cAMP production after 1 mM H2O2 and 20 μM CP cell treatment. Results are presented as mean ± SEM values of at least three independent experiments performed in duplicate (**** p < 0.0001 and *** p < 0.001 vs. CTR without PEMFs, respectively; §§§ p < 0.001;  p < 0.05). (C) Extracellular BDNF levels after 200 μM H2O2 or 20 μM CP treatment for 24 h. Results are presented as mean ± SEM values of at least three independent experiments performed in duplicate (* p < 0.05 vs. CTR without PEMFs; § p < 0.05;  p < 0.05). Statistical analysis was performed by one-way ANOVA and Sidak’s multiple comparison test. cAMP, cyclic adenosine monophosphate; CREB, cAMP response element-binding protein; BDNF, brain-derived neurotrophic factor.
Figure 7
Figure 7
Diclofenac (DCF) effects in injured PC12 cells. Cell viability and ROS production were studied in cells pretreated for 30 min with 1 μM or 5 μM DCF and then treated with 1 mM H2O2 or 20 μM CP for 24 h, through MTS (A) and H2DCFDA (B) assays. (A) Results are presented as mean ± SEM values of at least four independent experiments performed in duplicate (**** p < 0.0001 vs. control, CTR; §§§§ p < 0.0001;  p < 0.05 and ††† p < 0.001). (B) The graph shows mean ± SEM values from three independent experiments performed in duplicate (*** p < 0.001 and * p < 0.05 vs. CTR; §§§ p < 0.001 and §§§§ p < 0.0001;  p < 0.05). Statistical analysis was performed by one-way ANOVA and Sidak’s multiple comparison test. MTS, 3-(4,5-dimethylthiazol-2-yl)-5-(3-carboxymethoxyphenyl)-2-(4-sulfophenyl)-2H-tetrazolium.

Similar articles

References

    1. Suresh S., Singh S.A., Rushendran R., Vellapandian C., Prajapati B. Alzheimer’s Disease: The Role of Extrinsic Factors in Its Development, an Investigation of the Environmental Enigma. Front. Neurol. 2023;14:1303111. doi: 10.3389/fneur.2023.1303111. - DOI - PMC - PubMed
    1. Jurcău M.C., Andronie-Cioara F.L., Jurcău A., Marcu F., Ţiț D.M., Pașcalău N., Nistor-Cseppentö D.C. The Link between Oxidative Stress, Mitochondrial Dysfunction and Neuroinflammation in the Pathophysiology of Alzheimer’s Disease: Therapeutic Implications and Future Perspectives. Antioxidants. 2022;11:2167. doi: 10.3390/antiox11112167. - DOI - PMC - PubMed
    1. Ekundayo B.E., Obafemi T.O., Adewale O.B., Obafemi B.A., Oyinloye B.E., Ekundayo S.K. Oxidative Stress, Endoplasmic Reticulum Stress and Apoptosis in the Pathology of Alzheimer’s Disease. Cell Biochem. Biophys. 2024;82:457–477. doi: 10.1007/s12013-024-01248-2. - DOI - PubMed
    1. Wang W., Zhao F., Ma X., Perry G., Zhu X. Mitochondria Dysfunction in the Pathogenesis of Alzheimer’s Disease: Recent Advances. Mol. Neurodegener. 2020;15:30. doi: 10.1186/s13024-020-00376-6. - DOI - PMC - PubMed
    1. Misrani A., Tabassum S., Yang L. Mitochondrial Dysfunction and Oxidative Stress in Alzheimer’s Disease. Front. Aging Neurosci. 2021;13:617588. doi: 10.3389/fnagi.2021.617588. - DOI - PMC - PubMed

MeSH terms

Substances