. 2025 Jul 6;26(13):6498.
doi: 10.3390/ijms26136498.

Tandem Mass Tags Quantitative Proteomics Reveal the Mechanism by Which Paeoniflorin Regulates the PI3K/AKT and BDNF/CREB Signaling Pathways to Inhibit Parkinson's Disease

Affiliations

Tandem Mass Tags Quantitative Proteomics Reveal the Mechanism by Which Paeoniflorin Regulates the PI3K/AKT and BDNF/CREB Signaling Pathways to Inhibit Parkinson's Disease

Zhen Feng et al. Int J Mol Sci. .

Abstract

Paeoniflorin (PF), a monomeric compound extracted from the dry roots of Paeonia lactiflora, has been widely used in the treatment of nervous system diseases, marking it as a critical formula in Parkinson's disease (PD). However, the action of PF against PD and its molecular mechanism are still unclear. In this study, tandem mass tags quantitative proteomics was performed to systematically clarify the underlying mechanism of action of PF against PD and to confirm it using in vivo and in vitro studies. The results showed that PF notably enhanced the viability of PC12 cells and mitigated MPP+-induced mitochondrial dysfunction, oxidative stress, and apoptosis. Tandem mass tag-based quantitative proteome analysis revealed the identification of 6405 proteins, of which 92 were downregulated and 190 were upregulated. Among them, the levels of PI3K, AKT, CREB, and BDNF in the MPP+-induced PC12 cell and MPTP mice were considerably lower than in the control group, indicating the role of the BDNF/CREB pathway in the pathogenesis of neuroprotection. The related DEP (PI3K, AKT, CREB, and BDNF) expression levels were verified by Western blot. PF effectively restored the altered expression of the four DEPs induced by MPP+ and MPTP. Summarily, PF exerted remarkable neuroprotective effects in MPP+-induced PC12 cell and MPTP-induced mice. Further, our research may provide proteomics insights that contribute to the further exploration of PF as a potential treatment for PD.

Keywords: BDNF/CREB signaling pathway; PI3K/AKT signaling pathway; Parkinson’s disease; paeoniflorin; proteomics.


Conflict of interest statement

The authors declare no conflicts of interest.

Figures

Figure 1
Figure 1
Structural representation of paeoniflorin.
Figure 2
Figure 2
Statistical information of differentially expressed proteins. (A) Total amount of differential proteins between the two groups. (B) Upregulated differential proteins between the two groups.
Figure 3
Figure 3
Bubble charts for GO analysis of network pharmacological analyses. (A) Up protein pathway enrichment (Model/Cell). (B) Down protein pathway enrichment (Model/Cell). (C) Up protein pathway enrichment (Model/Drug). (D) Up protein pathway enrichment (Model/Cell).
Figure 4
Figure 4
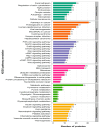
GO enrichment of differential proteins: (A) Model/Cell group; (B) Drug/Model group.
Figure 5
Figure 5
KEGG enrichment of differential proteins: (A) Model/Cell group; (B) Drug/Model group.
Figure 6
Figure 6
KEGG pathway enrichment.
Figure 7
Figure 7
KEGG BDNF/PI3K/AKT/CREB pathway diagram.
Figure 8
Figure 8
Enhancement of cell viability by PF against MPP+ damage. (A) Viability of PC12 cells after treatment with varying concentrations of PF (0–300 μM) for 24 h, evaluated through the MTT assay. (B) Examination of PF’s protective efficacy (25, 50, 100 μM) on PC12 cells against MPP+-induced damage, using the MTT assay. (C) Effect of paeoniflorin on MPP+-induced LDH release from PC12 cells. (D) Effect of paeoniflorin on Ca2+ content of PC12 cells induced by MPP+. (E) Effect of paeoniflorin on ROS content in MPP+-induced PC12 cells. (F) Flow chart of the effect of paeoniflorin on apoptosis of PC12 cells. a–f represents the apoptosis of each group, and the upper right and lower right quadrants represent early apoptotic cells and late apoptotic and necrotic cells. (G) Histogram of the effect of paeoniflorin on apoptosis in MPP+ PC12 cells. Data are presented as mean ± SD, with n = 5. Not significant (ns) indicates p > 0.05, while # p < 0.05, and ## p < 0.01 denote significance compared to the control group. * p < 0.05 signifies a significant difference from the Model group.** p < 0.01 signifies a significant difference from the Model group.
Figure 8
Figure 8
Enhancement of cell viability by PF against MPP+ damage. (A) Viability of PC12 cells after treatment with varying concentrations of PF (0–300 μM) for 24 h, evaluated through the MTT assay. (B) Examination of PF’s protective efficacy (25, 50, 100 μM) on PC12 cells against MPP+-induced damage, using the MTT assay. (C) Effect of paeoniflorin on MPP+-induced LDH release from PC12 cells. (D) Effect of paeoniflorin on Ca2+ content of PC12 cells induced by MPP+. (E) Effect of paeoniflorin on ROS content in MPP+-induced PC12 cells. (F) Flow chart of the effect of paeoniflorin on apoptosis of PC12 cells. a–f represents the apoptosis of each group, and the upper right and lower right quadrants represent early apoptotic cells and late apoptotic and necrotic cells. (G) Histogram of the effect of paeoniflorin on apoptosis in MPP+ PC12 cells. Data are presented as mean ± SD, with n = 5. Not significant (ns) indicates p > 0.05, while # p < 0.05, and ## p < 0.01 denote significance compared to the control group. * p < 0.05 signifies a significant difference from the Model group.** p < 0.01 signifies a significant difference from the Model group.
Figure 9
Figure 9
Enhancement of BDNF, phosphorylated PI3K, AKT, and CREB in PC12 cells by PF. (A) Analysis of protein expression levels for BDNF, p-AKT, t-AKT, p-PI3K, t-PI3K, p-CREB, t-CREB, and β-actin through Western blot. (B) Densitometry for BDNF expression ratios. (C) Densitometry for the ratio of phosphorylated to total CREB. (D) Densitometry for the ratio of phosphorylated to total PI3K. (E) Densitometry for the ratio of phosphorylated to total AKT. Data are reported as mean ± SD, with n = 3. Significant differences are denoted as ## p < 0.01 compared to the control and as * p < 0.05, ** p < 0.01 and *** p < 0.001 compared to the Model group.
Figure 10
Figure 10
Inhibition of the PI3K/AKT pathway by LY294002 diminishes the neuroprotective effects of PF. (A) Evaluation of protein expression for BDNF, p-AKT, t-AKT, p-PI3K, t-PI3K, p-CREB, t-CREB, and β-actin using Western blot analysis. (B) Densitometric analysis for the expression ratio of BDNF. (C) Densitometric analysis for the phosphorylated-to-total CREB ratio. (D) Densitometric analysis for the phosphorylated-to-total PI3K ratio. (E) Densitometric analysis for the phosphorylated-to-total AKT ratio. Data are expressed as mean ± SD, with n = 3. Statistical significance is indicated as ## p < 0.01 compared to the control group and as ** p < 0.01 compared to the Model group. Compared with the drug group, && p < 0.01.
Figure 11
Figure 11
Amelioration of MPTP-induced behavioral impairments by PF. (A) Assessment of spontaneous motor activity in mice subjected to MPTP, with and without PF administration. (B) Influence of PF on the performance of MPTP-treated mice on the rotarod test. (C) Influence of PF on the performance of MPTP-treated mice on the pole test. Statistical significance is denoted as ## p < 0.01 relative to the control group and as * p < 0.05 and ** p < 0.01 compared to the Model group. Measurement scale: 100 µm.
Figure 12
Figure 12
Paeoniflorin’s effect on tyrosine hydroxylase-positive neurons in the substantia nigra of MPTP-induced mouse model. (A) Results of immunohistochemical staining for tyrosine hydroxylase in the substantia nigra striata. (af) shows the number of TH-positive neuron cell bodies and fibers of mice in the control group, model group, Medoba group and paeoniflorin 7.5 mg/kg, 15 mg/kg and 30 mg/kg, respectively. (B) TH-staining statistics chart. Compared with normal control group, ## p < 0.01; compared with Model group, ** p < 0.01. (n = 10).
Figure 13
Figure 13
PF enhancement of BDNF, phosphorylated PI3K, AKT, and CREB in a rat model. (A) Western blot analysis illustrating expression levels of BDNF, p-AKT, t-AKT, p-PI3K, t-PI3K, p-CREB, t-CREB, and β-actin. (B) Densitometric evaluation detailing BDNF expression ratios. (C) Densitometric analysis for the ratio of phosphorylated to total CREB. (D) Densitometric evaluation focusing on the ratio of phosphorylated to total PI3K. (E) Densitometric assessment concerning the ratio of phosphorylated to total AKT. Results are expressed as mean ± SD, for n = 3, with ## p < 0.01 indicating a significant difference from the control and * p < 0.05 and ** p < 0.01 signifying statistical significance compared to the Model group.

Similar articles

References

    1. Tolosa E., Garrido A., Scholz S.W., Poewe W. Challenges in the diagnosis of Parkinson’s disease. Lancet Neurol. 2021;20:385–397. doi: 10.1016/S1474-4422(21)00030-2. - DOI - PMC - PubMed
    1. Kulcsarova K., Skorvanek M., Postuma R.B., Berg D. Defining Parkinson’s Disease: Past and Future. J. Park. Dis. 2024;14:S257–S271. doi: 10.3233/JPD-230411. - DOI - PMC - PubMed
    1. Trevisan L., Gaudio A., Monfrini E., Avanzino L., Di Fonzo A., Mandich P. Genetics in Parkinson’s disease, state-of-the-art and future perspectives. Br. Med. Bull. 2024;149:60–71. doi: 10.1093/bmb/ldad035. - DOI - PMC - PubMed
    1. Shin J.Y., Habermann B. Nursing Research in Parkinson’s Disease From 2006 to 2015: A Systematic Review. Clin. Nurs. Res. 2017;26:142–156. doi: 10.1177/1054773816634912. - DOI - PubMed
    1. Numakawa T., Suzuki S., Kumamaru E., Adachi N., Richards M., Kunugi H. BDNF function and intracellular signaling in neurons. Histol. Histopathol. 2010;25:237–258. doi: 10.14670/hh-25.237. - DOI - PubMed

MeSH terms

LinkOut - more resources