. 2025 Jul 6;26(13):6510.
doi: 10.3390/ijms26136510.

Activity of Human-Specific Interlaminar Astrocytes in a Chimeric Mouse Model of Fragile X Syndrome

Affiliations

Activity of Human-Specific Interlaminar Astrocytes in a Chimeric Mouse Model of Fragile X Syndrome

Alexandria Anding et al. Int J Mol Sci. .

Abstract

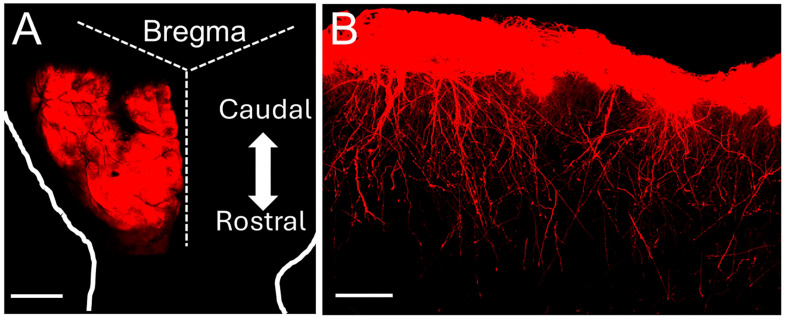
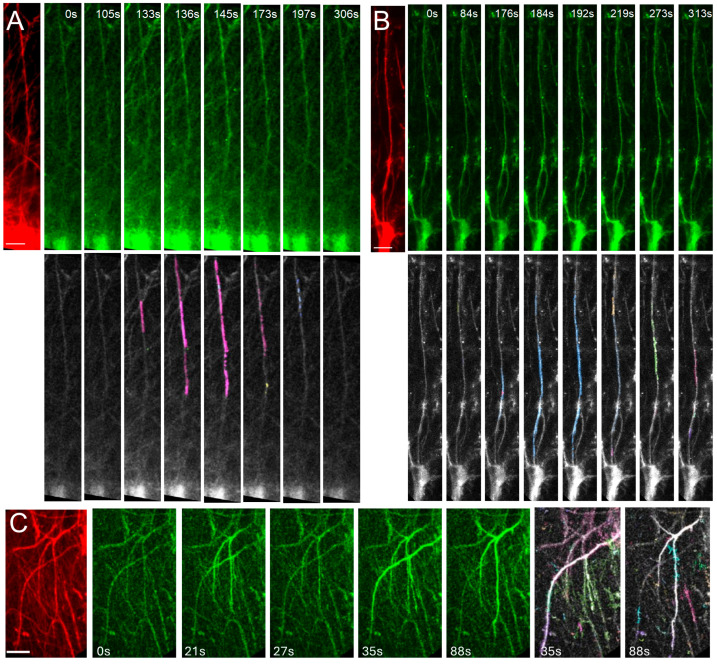
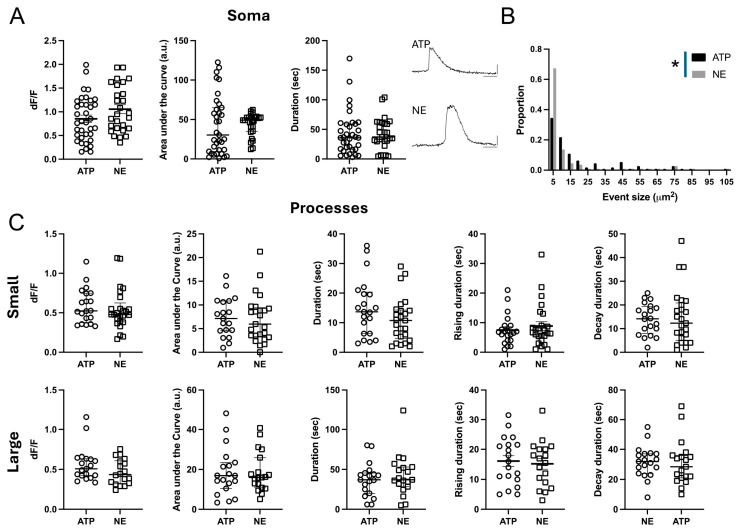
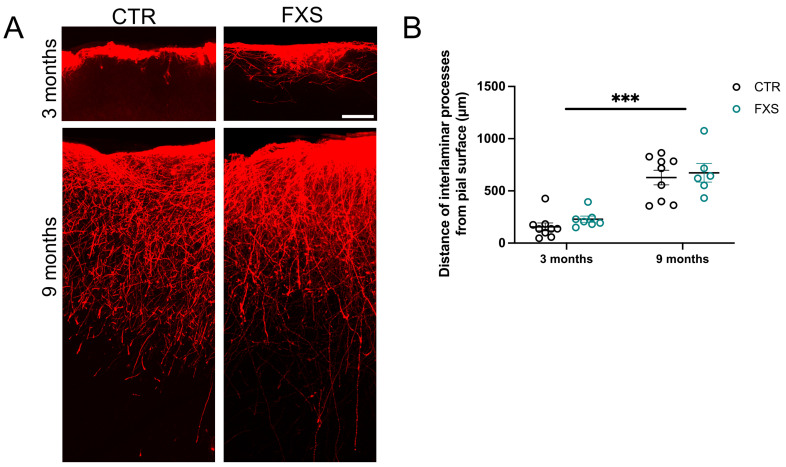
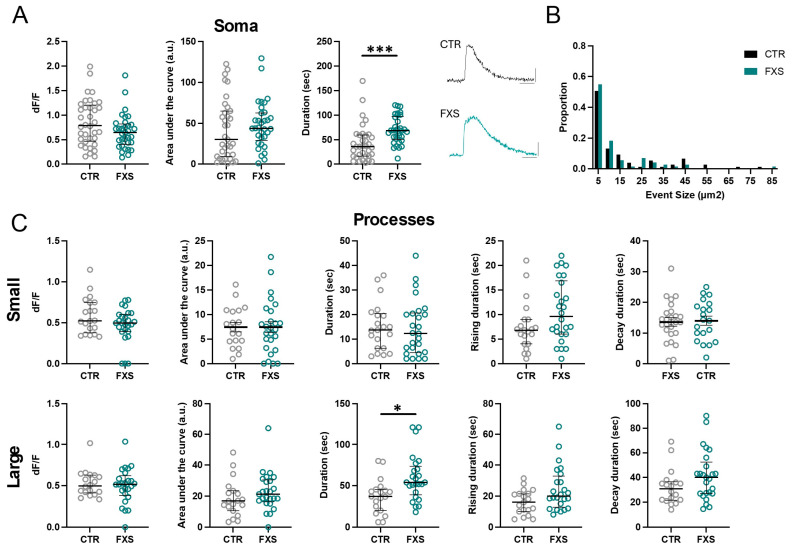
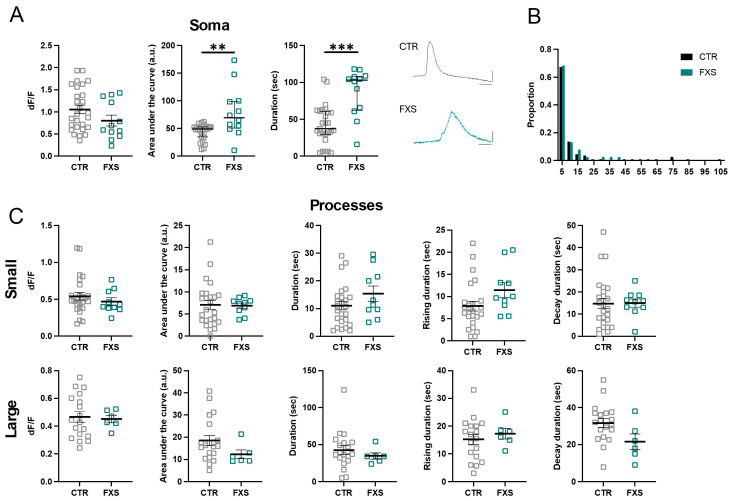
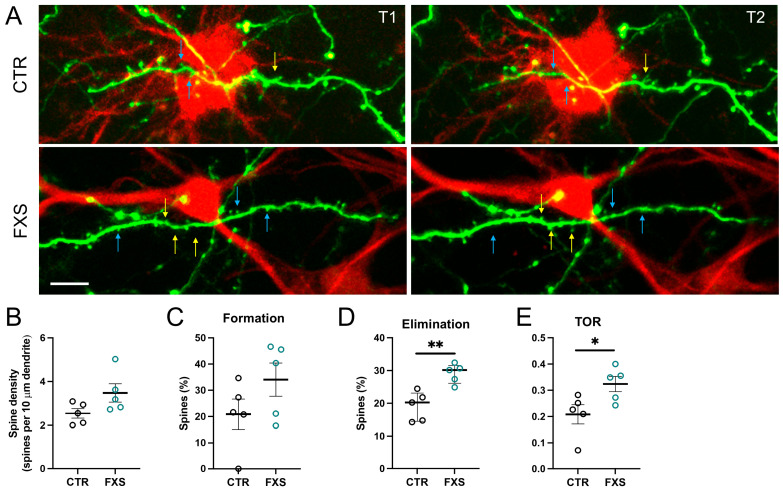
Astrocytes, a subtype of glial cells, have multiple roles in regulating neuronal development and homeostasis. In addition to the typical mammalian astrocytes, in the primate cortex, interlaminar astrocytes are located in the superficial layer and project long processes traversing multiple layers of the cerebral cortex. Previously, we described a human stem cell based chimeric mouse model where interlaminar astrocytes develop. Here, we utilized this model to study the calcium signaling properties of interlaminar astrocytes. To determine how interlaminar astrocytes could contribute to neurodevelopmental disorders, we generated a chimeric mouse model for Fragile X syndrome (FXS). We report that FXS interlaminar astrocytes exhibit hyperexcitable calcium signaling and are associated with dendritic spines with increased turnover rate.

Keywords: astrocytes; calcium; cortex; dendritic spines; iPSC; interlaminar; primate.


Conflict of interest statement

The authors declare no conflict of interest.

Figures

Figure 1
Figure 1
Chimeric mice engrafted with hi-Astrocytes develop interlaminar processes. (A) Whole mount view of a brain from a 9-month-old mouse engrafted with RFP-expressing hi-Astrocytes. The dashed lines mark the skull sutures, and the solid line outlines the brain. (B) Sagittal section from a 6-month engrafted mouse with RFP-expressing hiPSC-astrocytes. Interlaminar astrocytes are seen throughout the anterior–posterior (right–left) area. Scale Bar: 1 mm in (A) and 200 microns in (B).
Figure 2
Figure 2
Imaging Ca2+ activity in the interlaminar astrocytes. Time-lapse imaging of ILA in a cortical slice from a 6-month-old chimeric mouse engrafted with immature astrocytes derived from control (A) or FXS (B) stem cells. ILAs expressing the structural marker mScarlet is shown (red). ATP-evoked Ca2+ activity in ILAs expressing GCaMP6f (green) with the AQuA-detected events in corresponding time frames shown below. Propagation of the Ca2+ signal along the ILA process can be observed. (C) In vivo imaging of ILA through a cranial window in an awake head restrained mouse. Shown here are mScarlet expressing ILAs, time-lapse imaging of Ca2+ signals in ILA processes, and the AQuA-detected events. Scale bars: 25 µm.
Figure 3
Figure 3
Ca2+ signaling properties in interlaminar astrocytes. (A) ATP and NE-evoked Ca2+ activity in ILA somas in cortical slices. Data are shown for Ca2+ event amplitude, area under the curve, and duration. ATP: 6 mice, 13 slices, N = 36; NE: 4 mice, 8 slices, N = 27. Example traces are shown for ATP- and NE-evoked Ca2+ signals. (B) Frequency distribution for size of the Ca2+ events in ILA processes with ATP and NE application. Kolmogorov–Smirnov test, p = 0.025. (C). ATP and NE-evoked Ca2+ activity in ILA processes in cortical slices. Data are shown for Ca2+ event amplitude, area under the curve, duration, rise time to peak, and decay time for small events (top panel) and large events (bottom panel). No significant differences were observed in Ca2+ signaling properties between ATP- and NE-evoked responses in the ILA processes. ATP: 7 mice, 17 slices, N = 18–20 processes; NE: 5 mice, 13 slices, N = 17–25 processes. Multiple Mann–Whitney tests. Mean ± SEM or median ± interquartile range are shown. * p < 0.05.
Figure 4
Figure 4
Interlaminar astrocyte process length is not altered in FXS. (A) Control and FXS human astrocytes expressing RFP in the cortex of 3- and 9-month-old chimeric mice. Scale bar, 100 µm. (B) Quantification of the distance traversed by CTR and FXS ILA processes in the 3- and 9-month-old chimeric mice. N = 5–9 sections from 2 to 3 chimeric mice per group. Two-way ANOVA. Age factor (F (2, 40) = 16.55, p < 0.0001). Mean ± SEM, *** p < 0.001.
Figure 5
Figure 5
Enhanced ATP-evoked Ca2+ signaling in FXS interlaminar astrocytes. (A) ATP-evoked Ca2+ activity in somas of CTR and FXS ILAs in cortical slices. Data are shown for Ca2+ event amplitude, area under the curve and duration. FXS astrocyte soma exhibited increased Ca2+ event duration. CTR: 6 mice, 13 slices, N = 36 somas; FXS: 6 mice, 10 slices, N = 33 somas. Multiple Mann–Whitney tests, p = 0.0002. Example traces of ATP-evoked Ca2+ signals in CTR and FXS ILA soma. (B). Frequency distribution for size of the Ca2+ events in processes in CTR and FXS astrocytes. Kolmogorov–Smirnov test, p > 0.05. (C) ATP-evoked Ca2+ activity in ILA processes of CTR and FXS astrocytes in cortical slices. Data is shown for Ca2+ event amplitude, area under the curve, duration, rise time to peak and decay time for small events (top panel) and large events (bottom panel). A significant increase in the Ca2+ event duration for large events was observed in the FXS ILA processes. CTR: 7 mice, 17 slices, N = 18–20 processes; FXS: 9 mice, 16 slices, N = 24–26 processes for FXS, multiple Mann–Whitney tests p = 0.029. Mean ± SEM or median ± interquartile range are shown. * p < 0.05, *** p < 0.001.
Figure 6
Figure 6
Enhanced NE-evoked Ca2+ signaling in FXS interlaminar astrocytes. (A) NE-evoked Ca2+ activity in somas of CTR and FXS ILAs in cortical slices. Data are shown for Ca2+ event amplitude, area under the curve and duration. FXS astrocytes exhibited increased Ca2+ event duration and area under the curve. CTR: 4 mice, 8 slices, N = 27 somas; FXS: 3 mice, 4 slices, N = 12 somas. Multiple Mann–Whitney tests, p = 0.008 and p = 0.006. Example traces of NE-evoked Ca2+ signals in CTR and FXS ILA soma. (B) Frequency distribution for size of the Ca2+ events in processes in CTR and FXS ILAs. Kolmogorov–Smirnov test, p > 0.05. (C) NE-evoked Ca2+ activity in ILA processes of CTR and FXS astrocytes in cortical slices. Data is shown for Ca2+ event amplitude, area under the curve, duration, rise time to peak and decay time for small events (top panel) and large events (bottom panel). No significant changes were observed in the FXS astrocyte processes. CTR: 5 mice, 13 slices, N = 17–25 processes; FXS: 4 mice, 5 slices, N = 6–10 processes. Multiple Mann–Whitney tests. Mean ± SEM or median ± interquartile range are shown. ** p < 0.01, *** p < 0.001.
Figure 7
Figure 7
Altered dendritic spine dynamics in chimeric mice with FXS ILAs. (A) In vivo imaging of eGFP expressing mouse dendrites in the vicinity of CTR (top) and FXS (bottom) ILAs (distance < 20 μm on the x and y axis) in the cortex of 4-month-old chimeric mice. Repeated in vivo imaging was performed at two timepoints over a 4-day interval. Blue and yellow arrows point to eliminated and newly formed spines, respectively. Scale Bar 10 μm. (B) No differences were found in the dendritic spine density. Mann–Whitney test, p = 0.082. (C) No differences were found in dendritic spine formation. Mann–Whitney test, p = 0.16. (D) Increased spine elimination was observed in the dendrites in the vicinity of FXS ILAs. Unpaired t-test, p = 0.003. (E) The turnover rates (TOR) were elevated in the dendrites in the vicinity of FXS ILAs. Mann–Whitney, p = 0.037, 16–28 regions from N = 5 mice in each group. Mean ± SEM or median ± interquartile range are shown. * p < 0.05, ** p < 0.01.

Update of

Similar articles

References

    1. Verkhratsky A., Nedergaard M. Physiology of Astroglia. Physiol. Rev. 2018;98:239–389. doi: 10.1152/physrev.00042.2016. - DOI - PMC - PubMed
    1. Farizatto K.L.G., Baldwin K.T. Astrocyte-synapse interactions during brain development. Curr. Opin. Neurobiol. 2023;80:102704. doi: 10.1016/j.conb.2023.102704. - DOI - PubMed
    1. Lawal O., Ulloa Severino F.P., Eroglu C. The role of astrocyte structural plasticity in regulating neural circuit function and behavior. Glia. 2022;70:1467–1483. doi: 10.1002/glia.24191. - DOI - PMC - PubMed
    1. Lia A., Di Spiezio A., Speggiorin M., Zonta M. Two decades of astrocytes in neurovascular coupling. Front. Netw. Physiol. 2023;3:1162757. doi: 10.3389/fnetp.2023.1162757. - DOI - PMC - PubMed
    1. Veiga A., Abreu D.S., Dias J.D., Azenha P., Barsanti S., Oliveira J.F. Calcium-Dependent Signaling in Astrocytes: Downstream Mechanisms and Implications for Cognition. J. Neurochem. 2025;169:e70019. doi: 10.1111/jnc.70019. - DOI - PubMed

Substances

LinkOut - more resources