. 2025 Jul;13(13):e70458.
doi: 10.14814/phy2.70458.

Menstrual cycle influence on skeletal muscle mitochondrial respiration in humans

Affiliations

Menstrual cycle influence on skeletal muscle mitochondrial respiration in humans

W Bradley Nelson et al. Physiol Rep. 2025 Jul.

Abstract

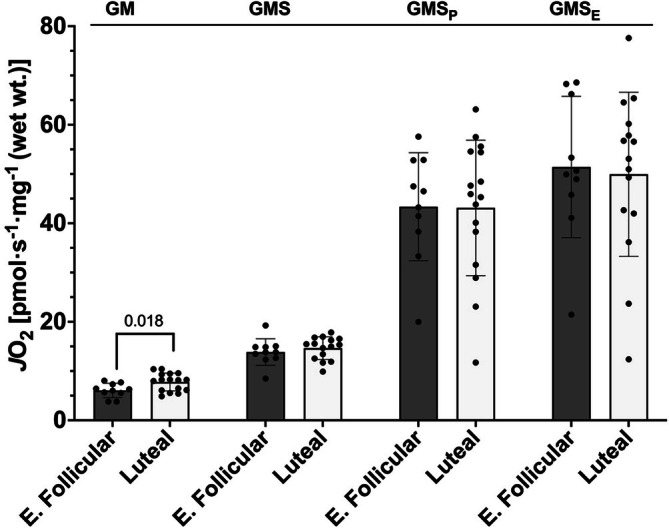
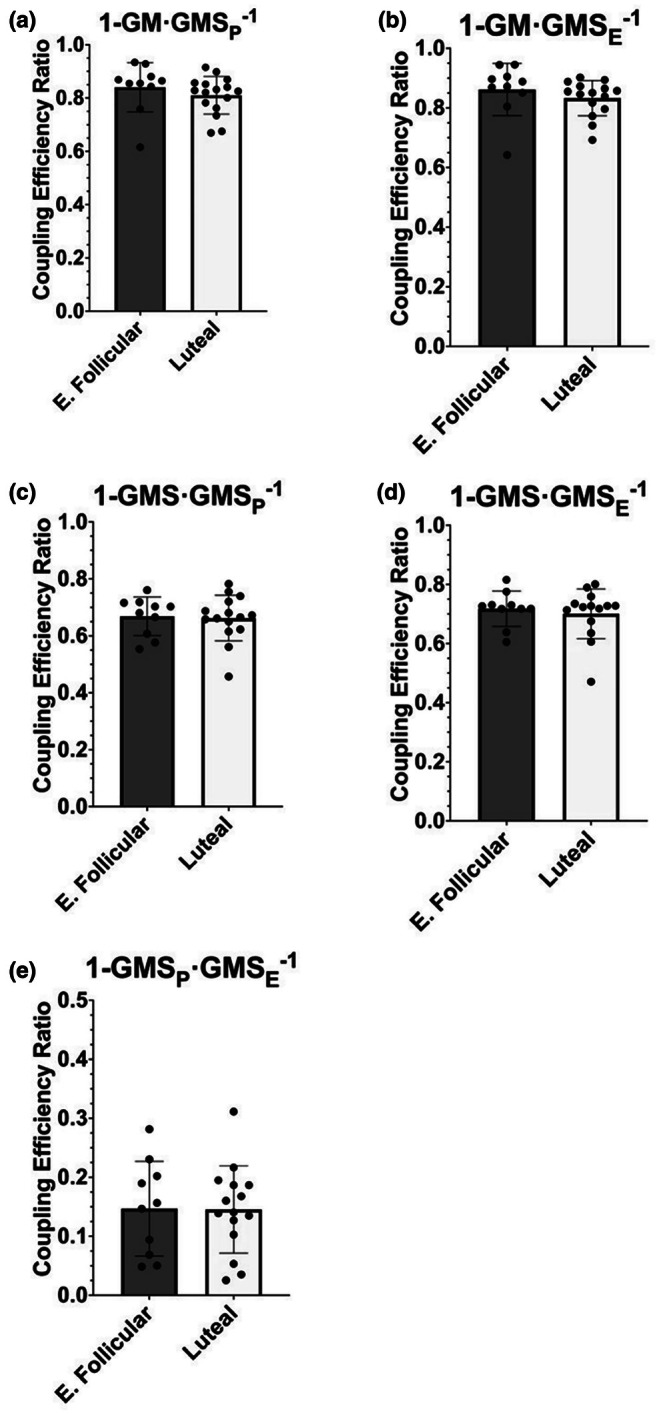
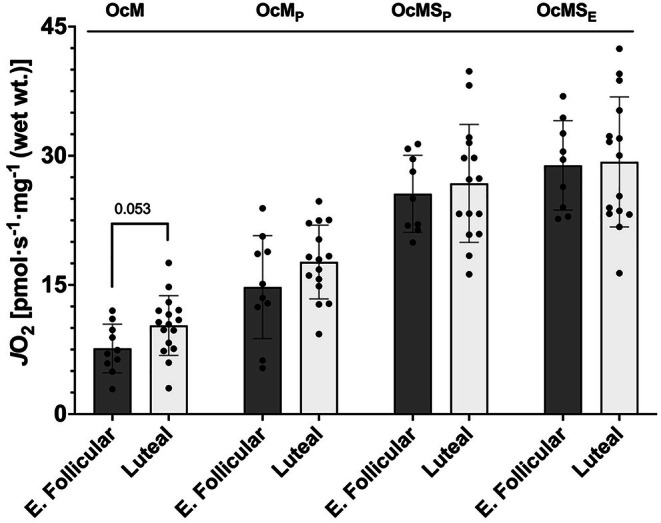
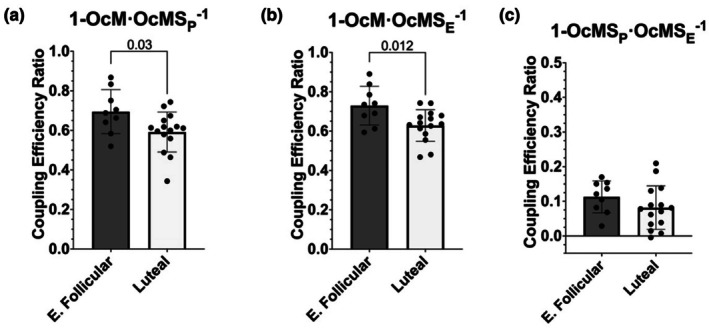
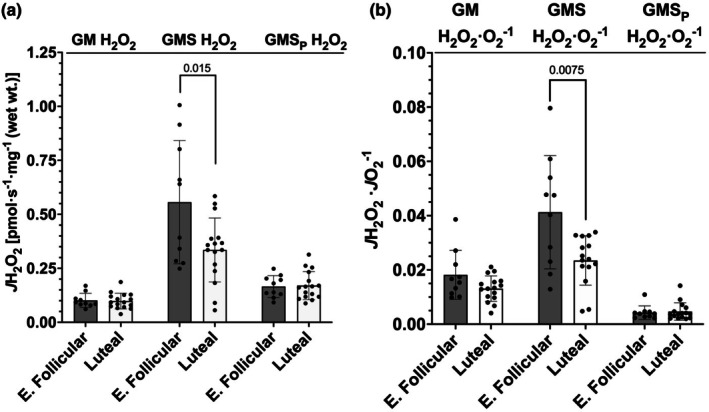
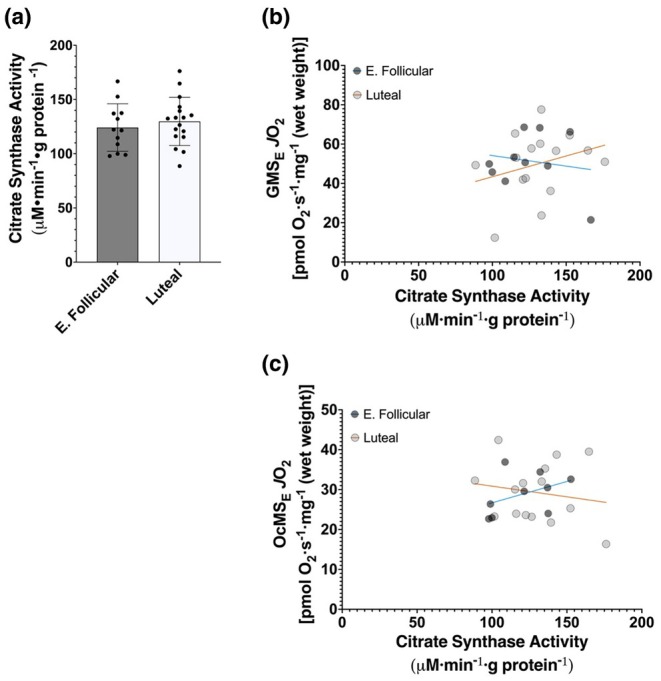
The menstrual cycle influences function in various tissues in the body. We sought to determine if menstrual cycle phase could influence mitochondrial function in skeletal muscle in females. Twenty-nine females with regular menstrual cycles were randomized to have a vastus lateralis muscle biopsy during either the early follicular or luteal phase. High-resolution respirometry was used to determine mitochondrial respiration on permeabilized muscle fibers. Glutamate/malate LEAK respiration was significantly higher during the luteal phase compared to the early follicular phase. Glutamate/malate/succinate LEAK respiration was the same during both menstrual cycle phases, as was maximal coupled and uncoupled respiration. There were no differences in fatty acid-supported respiration. The fatty acid-supported coupling efficiency ratios of 1-OcM (octanoylcarnitine/malate) LEAK over maximal coupled respiration and 1-OcM LEAK over maximal uncoupled respiration were both significantly higher in mitochondria from the early follicular phase than in the luteal phase. Mitochondrial H2O2 emission (glutamate/malate/succinate supported) was significantly increased in muscle from the early follicular phase. We detected no differences in mitochondrial content using citrate synthase activity between phases of the menstrual cycle. Collectively, our observations demonstrate a limited influence of the menstrual cycle on certain measures of submaximal respiration, coupling efficiencies, and H2O2 emission.

Keywords: menstrual cycle phase; mitochondrial respiration; skeletal muscle.


Conflict of interest statement

The authors have no conflicts of interest to disclose.

Figures

FIGURE 1
FIGURE 1
Mitochondrial respiration using NADH‐linked substrates and succinate. G, glutamate; M, malate; S, succinate; P, ADP; E, FCCP; E. Follicular, early follicular. Bars represent mean ± standard deviation, dots represent individual data points; early follicular n = 10, luteal n = 15 (GMS and GMSE), luteal n = 16 (GM and GMSP). Means were tested using unpaired t‐tests. Values above bars indicate p value when significantly different (p < 0.05).
FIGURE 2
FIGURE 2
Mitochondrial coupling efficiency ratios for respiration using NADH‐linked substrates and succinate. G, glutamate; M, malate; S, succinate; P, ADP; E, FCCP; E. Follicular, early follicular. Bars represent mean ± standard deviation; dots represent individual data points: early follicular n = 10; luteal n = 14 (1‐GMS·GMSE −1), luteal n = 15 (1‐GM·GMSE −1, 1‐GMS·GMSP −1, and 1‐GMSP·GMSE −1), and luteal n = 16 (1‐GM·GMSP −1). Means were tested using unpaired t‐tests except for 1‐GM·GMSE −1, 1‐GM·GMSP −1, and 1‐GMS·GMSE −1, which were tested with Mann–Whitney U tests.
FIGURE 3
FIGURE 3
Mitochondrial respiration using fatty acid oxidation with NADH‐linked substrates and succinate. Oc, octanoylcarnitine; M, malate; S, succinate; P, ADP; E, FCCP; E. Follicular, early follicular. Bars represent mean ± standard deviation; dots represent individual data points: early follicular n = 9 (OcMSP and OcMSE), early follicular n = 10 (OcM and OcMP), luteal n = 15(OcMP, OcMSP, and OcMSE), and luteal n = 16(OcM). Means were tested using unpaired t‐tests. Values above bars indicate p value.
FIGURE 4
FIGURE 4
Mitochondrial coupling efficiency ratios for respiration using fatty acid oxidation, NADH‐linked substrates, and succinate. Oc, octanoylcarnitine; M, malate; S, succinate; P, ADP; E, FCCP; E. Follicular, early follicular. Bars represent mean ± standard deviation; dots represent individual data points; early follicular n = 9, luteal n = 15. Means were tested using unpaired t‐tests. Values above bars indicate p value when significantly different (p < 0.05).
FIGURE 5
FIGURE 5
Mitochondrial H2O2 production. (a) absolute JH2O2. (b) JH2O2·JO2 −1. G, glutamate; M, malate; S, succinate; P, ADP; E. Follicular, early follicular. Bars represent mean ± standard deviation; dots represent individual data points; early follicular n = 10, luteal n = 16 for all comparisons except GMS JH2O2·JO2 −1 luteal n = 15. Means for absolute H2O2, GM JH2O2·JO2‐1, and GMSP JH2O2·JO2‐1 were tested using unpaired t‐tests; means for GMS JH2O2·JO2 −1 were tested with a Mann–Whitney U test. Values above bars indicate p value when significantly different (p < 0.05).
FIGURE 6
FIGURE 6
(a) Citrate synthase activity. E. Follicular, early follicular. Bars represent mean ± standard deviation, dots represent individual data points; early follicular n = 12, luteal n = 17. Means were tested using an unpaired t‐test. (b) Correlation between maximal uncoupled respiration supported by NADH‐linked substrates and succinate (GMSE) and citrate synthase activity. E. Follicular: r = −0.17, 95% CI [−0.72, 0.52], p = 0.6547, n = 10 pairs; Luteal: r = 0.29, 95% CI [−0.26, 0.7], p = 0.2998, n = 15 pairs. (c) Correlation between maximal uncoupled respiration supported by fatty acid oxidation with NADH‐linked substrates and succinate (OcMSE) and citrate synthase activity. E. Follicular: r = 0.42, 95% CI [−0.34, 0.85], p = 0.2643, n = 9 pairs; Luteal: r = −0.17, 95% CI [−0.63, 0.38], p = 0.5497, n = 15 pairs. Trend lines represent best fits; correlations were tested using the Pearson product–moment correlation test.

Similar articles

References

    1. Baltgalvis, K. A. , Greising, S. M. , Warren, G. L. , & Lowe, D. A. (2010). Estrogen regulates estrogen receptors and antioxidant gene expression in mouse skeletal muscle. PLoS One, 5, e10164. - PMC - PubMed
    1. Benton, C. R. , Nickerson, J. G. , Lally, J. , Han, X. X. , Holloway, G. P. , Glatz, J. F. , Luiken, J. J. , Graham, T. E. , Heikkila, J. J. , & Bonen, A. (2008). Modest PGC‐1alpha overexpression in muscle in vivo is sufficient to increase insulin sensitivity and palmitate oxidation in subsarcolemmal, not intermyofibrillar, mitochondria. The Journal of Biological Chemistry, 283, 4228–4240. - PubMed
    1. Braun, B. , & Horton, T. (2001). Endocrine regulation of exercise substrate utilization in women compared to men. Exercise and Sport Sciences Reviews, 29, 149–154. - PubMed
    1. Brown, J. L. , Rosa‐Caldwell, M. E. , Lee, D. E. , Blackwell, T. A. , Brown, L. A. , Perry, R. A. , Haynie, W. S. , Hardee, J. P. , Carson, J. A. , Wiggs, M. P. , Washington, T. A. , & Greene, N. P. (2017). Mitochondrial degeneration precedes the development of muscle atrophy in progression of cancer cachexia in tumour‐bearing mice. Journal of Cachexia, Sarcopenia and Muscle, 8, 926–938. - PMC - PubMed
    1. Brown, S. A. , Jiang, B. , Mcelwee‐Malloy, M. , Wakeman, C. , & Breton, M. D. (2015). Fluctuations of hyperglycemia and insulin sensitivity are linked to menstrual cycle phases in women with T1D. Journal of Diabetes Science and Technology, 9, 1192–1199. - PMC - PubMed

LinkOut - more resources