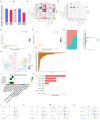
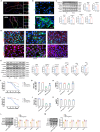
. 2025 Oct;12(37):e14530.
doi: 10.1002/advs.202414530. Epub 2025 Jul 12.

Hypoglycemia Induces Diabetic Macrovascular Endothelial Dysfunction via Endothelial Cell PANoptosis, Macrophage Polarization, and VSMC Fibrosis

Affiliations

Hypoglycemia Induces Diabetic Macrovascular Endothelial Dysfunction via Endothelial Cell PANoptosis, Macrophage Polarization, and VSMC Fibrosis

Deyu Zuo et al. Adv Sci (Weinh). 2025 Oct.

Abstract

Hypoglycemia is a commonly neglected complication in elderly diabetic patients, which can lead to cardiovascular events. Endothelial cell dysfunction is the primary inducer of cardiovascular events, and it is associated with hypoglycemia-triggered cytokine release and inflammatory programmed cell death. A comprehensive understanding of lineage-specific variations in pathological vascular changes is essential to mitigate cardiovascular events and ensure therapeutic efficacy. Herein, unbiased clustering analyses and single-nucleus RNA sequencing are performed on cells of the thoracic aorta in db/db and insulin-induced hypoglycemic db/db mice. Comparative analyses show changes in lineage-specific genes, subpopulation composition, intercellular communication, and molecular biology in hypoglycemic diabetic mice. The analyses also revealed the changes of different cells, particularly endothelial cell PANoptosis, macrophage inflammatory polarization, and vascular smooth muscle cell (VSMC) fibrosis. Pseudo-time sequencing, differential expression, and regulation network analyses revealed the association of potential hub genes Klf2, ETS2, Elavl1, C3, and Nr4a1 with the mentioned pathological processes. It is demonstrated that hypoglycemia induces VSMC fibrosis in vivo, whereas Angptl4 knockdown can attenuate VSMC fibrosis in vitro. These findings demonstrate the hypoglycemic macroangiopathy mechanism and provide important references for future disease intervention and treatment.

Keywords: ANGPTL4; PANoptosis; fibrosis; hypoglycemia; proinflammatory polarization.


Conflict of interest statement

The authors declare no conflict of interest.

Figures
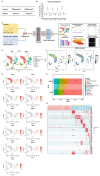
Figure 1
Figure 1
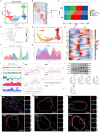
Variations in the relative proportion of each cell type of thoracic aorta tissues in DM and HDM groups. A,B) Construction of a db/db mouse hypoglycemic model. C) Scheme of the study design. Thoracic aorta tissues of mice in DM and HDM groups were collected for snRNA‐seq detection and analysis (n = 8). D) Unbiased clustering of nuclei from DM and HDM samples identified 11 major cell types. E) UMAP shows the expression of established marker genes in each cell type in the DM and HDM groups. F) Comparison of the nucleus density in the UMAP space between the two conditions reveals remarkable changes in the relative proportion of cell types in HDM. G) Changes in the relative proportion of each cell type in DM and HDM groups. +, expansion; –, contraction. H) Heatmap showing the molecular signature of each lineage.
Figure 2
Figure 2
Endothelial cell‐specific regulatory changes in the inflammatory condition of HDM. A) UMAP plot presenting the endothelial cell (EC) subpopulation. B) Heatmap screening of the molecular signatures of each EC subpopulation. C) Relative proportion of each subpopulation in ECs from each condition. +, expansion; –, contraction. D) Representative terms enriched in significantly upregulated genes in ECs from HDM compared to DM. P < 0.05, hypergeometric test. E) Slingshot is used to reconstruct cell trajectories in transition to inflammatory ECs. F) Density curve showing the distribution of four EC subpopulations. G) Distribution density curves of EC subpopulations in DM and HDM. H) Heatmaps screening the expression dynamics of 4429 genes with significantly different patterns along the trajectory between the two conditions. These genes were detected by differential expression pattern analysis using the “conditionTest” function of tradeSeq and were categorized into six gene clusters by hierarchical clustering. Significance was set at P < 0.05. I) Prioritized key genes based on the results of three independent analyses, including differences in expression patterns, FC of expression levels, and centrality change in GRNs. DRN rank: gene ranking based on the centrality change in GRNs obtained by differential GRN analysis. log2FC: log2FC of expression levels in ECs. Wald stat: natural logarithm of the statistics of differential expression pattern analysis. Only genes encoding TFs, ligands, and receptors were considered. J) Smoothed expression curves of representative candidate genes along the trajectory under both conditions. K) Western blot analysis of protein levels of ETS2, PPARG, PLTLH, NR4A1, and FUS in the DM group (n = 8) and HDM group (n = 8). ** P < 0.01, Wilcoxon rank‐sum test. L–N) Immunofluorescence staining showing the presence of the above genes in aortic tissues from DM and HDM mice. Scale bar, 200 µm.
Figure 3
Figure 3
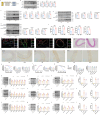
Hypoglycemia‐induced endothelial dysfunction by triggering EC PANoptosis. A) Scheme of PANoptosome (AIM2, ZBP1, and RIPK1)‐induced PANoptosis. B) Western blot assays confirm that protein levels of PANoptosis sensors AIM2, ZBP1, and RIPK1 change significantly in thoracic aorta tissues from HDM (n = 8) compared to DM (n = 8). * P < 0.05; ** P < 0.01, Wilcoxon rank‐sum test. C–E) Western blot assays confirming the significant change of PANoptosis protein levels in thoracic aorta tissues from HDM (n = 8) compared to DM (n = 8). * P < 0.05; ** P < 0.01, Wilcoxon rank‐sum test. F) ELISA confirming the significant change of cytokine levels of proinflammatory PCD in thoracic aorta tissues from HDM (n = 8) compared to DM (n = 8). * P < 0.05; ** P < 0.01, Wilcoxon rank‐sum test. G,H) Immunofluorescence staining showing the presence of PANoptosis proteins in thoracic aorta tissues from DM and HDM mice. Scale bar, 200 µm. I) Representative micrographs of immunohistochemical staining for GSDMD, BAX, and RIPK1 in HDM and DM thoracic aortic tissue. Scale bar, 50 µm. J) H&E staining confirms the continuity of the vascular endothelium in thoracic aorta tissues from DM and HDM. Scale bar, 100 µm. K) Left, Endothelium‐dependent vasodilation in DM, Z‐VAD‐FMK + HDM, bardoxolone + HDM, disulfiram + HDM, and HDM thoracic aorta rings (n = 8). PANoptosis inhibitors have a similar effect to attenuate the curve of endothelium‐dependent vasodilation. Right, EC50 of thoracic aortic rings in the above group. PANoptosis inhibitors similarly attenuate the decreasing EC50 and maximum diastolic rate of the thoracic aorta under hypoglycemia. * P < 0.05, HDM versus DM, #Z‐VAD‐FMK + HDM, bardoxolone + HDM, disulfiram + HDM versus HDM; P < 0.05, Wilcoxon rank‐sum test. L) Left, Vasoconstriction in DM and HDM thoracic aorta aortic rings (n = 8). Hypoglycemia did not significantly change the vasoconstriction of the thoracic aorta. Right, EC50 of thoracic aortic rings in DM and HDM. Hypoglycemia did not significantly change the EC50 and maximum constrictive rate of the thoracic aorta in HDM compared to DM. M) Left, Vascular smooth muscle vasodilation in DM, HDM, HDM + Z‐VAD‐FMK, HDM + bardoxolone, and HDM + disulfiram endothelium‐free thoracic aorta rings (n = 8). Z‐VAD‐FMK, bardoxolone or disulfiram has an effect to attenuate the curve of vascular smooth muscle vasodilation. Right, EC50 of endothelium‐free thoracic aortic rings in the above group. Z‐VAD‐FMK, bardoxolone or disulfiram has no effect to attenuate the EC50 and maximum diastolic rate of the thoracic aorta under hypoglycemia. **** P < 0.0001, HDM versus DM, ####HDM + Z‐VAD‐FMK versus DM; P < 0.0001, $$HDM + bardoxolone versus DM; P < 0.0001, ^^HDM + disulfiram versus DM; P < 0.0001, Wilcoxon rank‐sum test. N–P,R–T,V–X) Western blot assays confirming the significant change of PANoptosis protein levels in MAEC, from low glucose treatment (n = 8) compared to high glucose cultured (n = 8). * P < 0.05; ** P < 0.01; *** P < 0.001; **** P < 0.0001, si‐RIPK1 and si‐ZBP1 from low glucose treatment (n = 8) compared to low glucose treatment (n = 8). # P < 0.05; ## P < 0.01; ### P < 0.001; #### P < 0.0001, Wilcoxon rank‐sum test. Q,U,Y) ELISA confirming the significant change of cytokine levels of PANoptosis in MAEC, from low glucose treatment (n = 8) compared to high glucose cultured (n = 8). **** P < 0.0001, si‐ZBP1 from low glucose treatment (n = 8) compared to low glucose treatment (n = 8). #### P < 0.0001, Wilcoxon rank‐sum test.
Figure 4
Figure 4
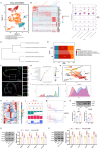
Macrophage‐specific regulatory changes in the inflammatory condition of HDM. A) UMAP plot showing the macrophage subpopulation. B) Heatmap presenting the molecular signatures of every macrophage subpopulation. C) Violin diagram of division showing the expression of activated macrophage markers. D) Hierarchical clustering of subpopulations. E) Relative proportion of each subpopulation in macrophages from each condition. +, expansion; –, contraction. F) Immunofluorescence staining showing the presence of the proinflammatory polarization of macrophages in thoracic aorta tissues from HDM and DM mice. Proinflammatory polarization and macrophages are labeled with iNOS and CD68, respectively. Scale bar, 200 µm. G) Representative terms enriched in upregulated genes in macrophages from HDM compared to DM. P < 0.05, hypergeometric test. H) Slingshot to reconstruct cell trajectories in transition to proinflammatory macrophages. I) Density curve showing the distribution of four subpopulations of macrophages. J) Distribution density curves of macrophage subpopulations in DM and HDM groups. K) Heatmap showing the 94 gene expression dynamics in DM and HDM, with their significantly different expression patterns. The conditionTest function of tradeSeq was used to analyze differential expression patterns, divided into six gene clusters using hierarchical clustering. The significance threshold was set at 0.05. L) Potential key genes prioritized based on the results of three independent analyses, including the difference in expression patterns, the FC of expression levels, and the centrality change in GRNs. M) Smoothed expression curves of representative candidate genes along the locus under both conditions. N) Western blot analysis of protein levels of C3 and Adrge5 in the DM group (n = 8) and HDM group (n = 8). ** P < 0.01, Wilcoxon rank‐sum test. O,P) Western blot assays confirming the significant change of levels of signaling pathways and marker of proinflammatory polarization of macrophage in the co‐culture system from low glucose incubation (n = 8) compared to high glucose cultured (n = 8). *** P < 0.001; **** P < 0.0001, si‐ZBP1 + low glucose incubation versus low glucose incubation; ## P < 0.01; ### P < 0.001; #### P < 0.0001, Wilcoxon rank‐sum test.
Figure 5
Figure 5
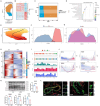
VSMC‐specific regulatory changes in the inflammatory condition of HDM. A) UMAP plot showing the VSMC subpopulation. B) Molecular signatures of each subpopulation of VSMC. C) Relative proportion of each subpopulation in VSMCs from each condition. +, expansion; –, contraction. D) Representative terms enriched in significantly upregulated genes in VSMCs from HDM compared to DM mice. P < 0.05, hypergeometric test. E) Slingshot to reconstruct cell trajectories in transition to inflammatory VSMCs. F) Distribution of two subpopulations of VSMCs. G) Distribution density curve of VSMC subpopulations in DM and HDM. H) Expression dynamics of 583 genes under two conditions, presenting significantly different expression patterns. These genes were analyzed for differential expression patterns using the “conditionTest” function of tradeSeq and divided into six gene clusters by hierarchical clustering. The significance threshold was set at 0.05. I) Potential key genes prioritized based on the results of three independent analyses, including the difference in expression patterns, the FC of expression levels, and the centrality change in GRNs. J) Expression curve along the trajectory of the representative candidate genes (Klf2, Fosb, Nr4a1, and Zbtb20) under both conditions. K) Western blot analysis of Klf2, Fosb, Nr4a1, and Zbtb20 protein levels in the DM group (n = 8) and HDM group (n = 8). ** P < 0.01, Wilcoxon rank‐sum test. L) Immunofluorescence staining confirms SMC fibrosis in thoracic aorta tissues from HDM and DM. Fibrosis is labeled with α‐SMA and Myh11. Scale bar, 200 µm.
Figure 6
Figure 6
Intercellular communication changes in HDM aortic tissues. A) Total number of ligand‐receptor interactions in aortic tissue subpopulations in DM and HDM groups. B) Overall interaction intensity between aortic tissue subpopulations in DM and HDM. The total interaction intensity was calculated by summing the communication probabilities of all inferred interactions. C) Differences in interactions between HDM and DM subpopulations. Red and blue indicate an increase and decrease in the number of interactions, respectively. The bar chart shows the sum of changes in the number of input signals for each subgroup. Sum of changes in the number of output signals for each subpopulation (right). D) Interaction intensity between HDM and DM subpopulations. E) Intensity of input and output interactions for each subpopulation in DM. Dot size indicates the number of interactions. F) Intensity of input and output interactions for each subpopulation in HDM. Dot size indicates the number of interactions. G) Relative information flow for each signaling pathway between HDM and DM subpopulations. Information flow is the sum of communication probabilities between all subpopulation pairs. H) Joint manifolds show DM and HDM communication networks and group signal pathways based on functional similarity. A high degree of functional similarity means that the primary sender and receiver are similar. I) Learn the Euclidean distance of each pathway in the combined manifold. The greater the distance, the greater the difference in functional similarity (i.e., similarity between the sender and receiver) between DM and HDM. Only overlapping paths between DM and HDM are displayed. J) Central analysis of primary senders and receivers of ANGPTL signaling pathway networks in DM and HDM. K) Relative contribution of each ligand‐receptor in HDM to the overall signaling of the ANGPTL signaling pathway. L,M) Layered graph showing the inferred communication network for ANGPTL4 – (ITGA5 + ITGB1) signaling in DM. M, Hierarchy graph showing the inferred communication network for ANGPTL4 – (ITGA5 + ITGB1) signaling in HDM. Solid and hollow circles represent targets and sources, respectively. The width of the edges represents the intensity of the interaction, and the size of the circle is proportional to the number of nuclei in each subpopulation. The edges are color‐coded according to the signal source.
Figure 7
Figure 7
ANGPTL4 functions as a transcription activator in fibrosis under hypoglycemia conditions. A) Immunostaining confirmed ANGPTL4 and VIMENTIN expression in aortic tissues from DM (top) and HDM (bottom). Scale bar, 200 µm. B) Immunostaining of α‐SMA showing the fibrosis caused by low glucose treatment with high‐glucose cultured VSMCs. Scale bar, 50 µm. C) Immunoblotting showing the protein expression changes in ANGPTL4 and representative fibrosis markers, such as COLLAGEN I, COLLAGEN III, α‐SMA, SM22α, ANGPTL4, and TGF‐β, in the HG group (n = 8) and HG + LG group (n = 8). *P < 0.05; **P < 0.01, Wilcoxon rank‐sum test. D) Immunostaining showing the changes in protein expression of α‐SMA and the representative VSMC marker MYH11 by ANGPTL4 knockdown in HG and HG + LG groups. E) Immunoblotting showing the protein expression changes in KLF4, COLLAGEN I, α‐SMA, SM22α, ANGPTL4, COLLAGEN III, and TGF‐β by ANGPTL4 knockdown in the HG group (n = 8) and HG + LG group (n = 8). *P < 0.05; **P < 0.01, Wilcoxon rank‐sum test. F–H) Left, Vascular smooth muscle vasodilation in DM, HDM, DM + Angptl4 KO, and HDM + Angptl4 KO endothelium‐free thoracic aorta rings (n = 8). Angptl4 KO has an effect to attenuate the curve of vascular smooth muscle vasodilation. Angptl4 KO has an effect to attenuate the curve of vascular smooth muscle vasodilation. Right, EC50 of endothelium‐free thoracic aortic rings in the above group. Angptl4 KO has an effect to attenuate the EC50 and maximum diastolic rate of the thoracic aorta under hypoglycemia. **** P < 0.0001, HDM versus DM, ####DM + Angptl4 KO versus HDM + Angptl4 KO; P < 0.0001, $$$$HDM versus HDM + Angptl4 KO; P < 0.0001, Wilcoxon rank‐sum test. I–K) Left, Endothelium‐dependent vasodilation in DM, HDM, DM + Angptl4 KO, and HDM + Angptl4 KO thoracic aorta rings (n = 8). Angptl4 KO has no effect on attenuating the curve of endothelium‐dependent vasodilation. Right, EC50 of thoracic aortic rings in the above group. Angptl4 KO has no effect to attenuate the EC50 and maximum diastolic rate of the thoracic aorta under hypoglycemia. **** P < 0.0001, HDM versus DM, ####DM + Angptl4 KO versus HDM + Angptl4 KO; P < 0.0001, Wilcoxon rank‐sum test. L,M) Western blot assays confirming the significant change of macrophages proinflammatory polarization markers and their signaling pathways in thoracic aorta tissues from HDM (n = 8) compared to DM mice (n = 8). **** P < 0.0001, HDM + Angptl4 KO(n = 8) compared to HDM (n = 8). P = ns, Wilcoxon rank‐sum test.
Figure 8
Figure 8
The schematic illustration on hypoglycemia induces PANoptosis of endothelial cells, proinflammatory polarization of macrophages, and fibrosis of vascular smooth muscle cells (VSMC), thereby contributing to diabetic macro‐vascular dysfunction. Hypoglycemia triggers endothelial cell PANoptosis by activating the ZBP1‐mediated PANoptosome. The inflammatory factors (e.g., IL‐1β and IL‐18) released during PANoptosis drive macrophages toward proinflammatory polarization, while the activation of the ANGPTL4 signaling pathway induces vascular smooth muscle cell (VSMC) fibrosis, ultimately leading to diabetic macrovascular dysfunction.

References

    1. Ong K. L., Stafford L. K., McLaughlin S. A., Boyko E. J., Vollset S. E., Smith A. E., Dalton B. E., Duprey J., Cruz J. A., Hagins H., Lindstedt P. A., Aali A., Abate Y. H., Lancet 2023, 402, 203.
    1. Dogra S., Dunstan D. W., Sugiyama T., Stathi A., Gardiner P. A., Owen N., Annu. Rev. Public Health 2022, 43, 439. - PubMed
    1. Hui T., Chunlin L., Linong J., Zhonghua Neifenmi Waike Zazhi 2022, 61, 12.
    1. Amiel S. A., Aschner P., Childs B., Cryer P. E., de Galan B. E., Frier B. M., Gonder‐Frederick L., Heller S. R., Jones T., Khunti K., Leiter L. A., Luo Y., McCrimmon R. J., Pedersen‐Bjergaard U., Seaquist E. R., Zoungas S., Diabetes Endocrinol. 2019, 7, 385. - PubMed
    1. Pieber T. R., Marso S. P., McGuire D. K., Zinman B., Poulter N. R., Emerson S. S., Pratley R. E., Woo V., Heller S., Lange M., Brown‐Frandsen K., Moses A., Barner Lekdorf J., Lehmann L., Kvist K., Buse J. B., Diabetologia 2018, 61, 58. - PMC - PubMed

LinkOut - more resources