. 2025 Aug;12(30):e00461.
doi: 10.1002/advs.202500461. Epub 2025 Jul 12.

ACSS2-Mediated Histone H4 Lysine 12 Crotonylation (H4K12cr) Alleviates Colitis via Enhancing Transcription of CLDN7

Affiliations

ACSS2-Mediated Histone H4 Lysine 12 Crotonylation (H4K12cr) Alleviates Colitis via Enhancing Transcription of CLDN7

Ming Yuan et al. Adv Sci (Weinh). 2025 Aug.

Abstract

Histone lysine crotonylation (Kcr), a highly conserved posttranslational modification, plays critical roles in various biological processes. Nevertheless, the dynamic alterations and functions of histone Kcr in inflammatory bowel disease (IBD) remain poorly explored. Herein, a notable decrease of both Pan-Kcr and ACSS2 (acyl-CoA synthetase short-chain family member 2), the key enzyme for crotonyl-CoA generation, is revealed in inflamed intestinal epithelial cells. Genetic or pharmacological inhibition of ACSS2 dramatically impairs mouse intestinal barrier integrity and exacerbates colitis. Mechanistically, ACSS2-mediated histone H4 lysine 12 crotonylation (H4K12cr) upregulates CLDN7 expression to fortify intestinal epithelial barrier, which can be augmented by crotonate supplementation. Furthermore, tumor necrosis factor-α (TNF-α) is revealed to enhance the m6A modification of ACSS2 mRNA, consequently destabilizing and downregulating ACSS2. Combinational therapy involving anti-TNF-α and crotonate can significantly ameliorate colitis. Overall, ACSS2-mediated H4K12cr emerges as a pivotal modulator governing intestinal barrier function during IBD progression.

Keywords: ACSS2; histone lysine crotonylation; inflammatory bowel disease; intestinal barrier.


Conflict of interest statement

The authors declare no conflict of interest.

Figures

Figure 1
Figure 1
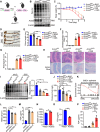
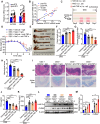
Reduced Pan‐Kcr and ACSS2 expression in intestinal epithelium of IBD patients. A) Immunoblotting of Pan‐Kcr and ACSS2 in colon tissues from healthy controls and CD patients. B) Heatmap of gene expression profiling involved in crotonylation from GSE59071 dataset. Red stars indicate significantly downregulated genes in inflamed colon tissues. C) Comparison of crotonyl‐CoA levels in plasma samples from healthy volunteers (n = 10) and CD patients (n = 28). D) UMAP visualization of ACSS2 expression levels across different cell types, analyzed by scIBD platform. E) Comparative analysis of ACSS2 mRNA expression in colon tissues between healthy control (n = 26) and CD patients with clinical stage B1 (n = 12) and B2+B3 (n = 14). F) Correlation analysis of ACSS2 mRNA levels in colon tissues and CDAI from CD patients (n = 26). G) Representative IHC images of ACSS2 and Pan‐Kcr in colon tissues from healthy control, CD patients, and UC patients. Scale bar = 250 µm (upper) and 50 µm (lower). H) Comparative analysis of ACSS2 and Pan‐Kcr levels (IHC score) in colon tissues among healthy control (n = 25), CD patients (n = 24), and UC patients (n = 9). The mRNA expression profiling of GSE59071 dataset is re‐analyzed by DESeq2 package (version 1.16.1) in R software (version 4.1.2). Values are mean ± SD. *p < 0.05, **p < 0.01, ***p < 0.001, determined by two‐tailed Student's t‐test C), one‐way ANOVA with Bonferroni's post hoc test E, H), and Pearson's correlation with two‐tailed test F).
Figure 2
Figure 2
ACSS2 inhibition impairs intestinal barrier function and aggravates colitis. A) The generation strategy for Acss2 CKO mice. B) Immunoblotting results for Pan‐Kcr and Acss2 in intestinal tissues from control and Acss2 CKO mice. Relative band intensities are annotated below respective lanes. C‐J) ACSS2 knockout in intestinal epithelium aggravates colitis progression (n = 7 for each group). C) The mice body weight curves from indicated experimental groups. D, E) Representative colon images and colon length statistics from each group. F) The DAI statistics for mice from indicated groups. G,H) Histological score and representative HE/Alcian blue staining images of colon tissues from indicated groups. Scale bar = 100 µm. I) Immunoblotting results and statistical analysis for Pan‐Kcr protein level in intestinal tissues from indicated groups. J) The plasma crotonyl‐CoA concentration in mice from indicated experimental groups. K) GSEA analysis of differentially expressed genes from control and ACSS2‐knockdown NCM460 cells. L–O) The pivotal role of ACSS2 in barrier function maintenance. The results of TEER and FD4 measurement in monolayers of Caco2 cells with either L,M) ACSS2 knockdown or N, O) ACSS2 overexpression. P) The plasma FD4 level in Acss2 CKO and Acss2fl/fl mice (n = 7). Values are mean ± SD. n.s. (not significant, p > 0.05), *p < 0.05, **p < 0.01, ***p < 0.001, determined by repeated measures ANOVA with Bonferroni's post hoc test C), one‐way ANOVA with Bonferroni's post hoc test E, I, J, L, M), two‐tailed Student's t‐test F, G, N‐P).
Figure 3
Figure 3
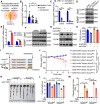
ACSS2 upregulates CLDN7 expression to enhance intestinal epithelial barrier function. A) The screening workflow and Venn diagram for candidate tight junction proteins regulated by ACSS2. B) Comparative analysis of CLDN7 mRNA expression in colon tissues between healthy control (n = 26) and CD patients with clinical stage B1 (n = 12) or B2 + B3 (n = 14). C,D) CLDN7 mRNA and protein expression levels in control and ACSS2‐knockdown Caco2 and NCM460 cell lines. E, F) CLDN7 mRNA and protein expression levels in control and ACSS2‐overexpression Caco2 and NCM460 cell lines. G) Immunoblotting results for CLDN7 and ACSS2 in indicated Caco2 cells. H) The results of TEER in monolayers of Caco2 cells from above indicated groups. I) The administration strategy of AAV in indicated groups. J–M) CLDN7 overexpression in intestinal epithelium rescued barrier function impairment and colitis progression (n = 6 for each group). J) The mice body weight curves from indicated experimental groups. K, L) Representative colon images and colon length statistics from each group. M) The DAI statistics for mice from each group. Relative band intensities are annotated below respective lanes (D, F, G). Values are presented as mean ± SD. *p < 0.05, ***p < 0.001, determined by one‐way ANOVA with Bonferroni's post hoc test B, C, H, L, M), two‐tailed Student's t‐test E), and repeated measures ANOVA with Bonferroni's post hoc test J).
Figure 4
Figure 4
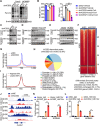
CLDN7 expression is regulated by ACSS2‐mediated H4K12cr. A) Immunoblotting for Pan‐Kcr level in control and ACSS2‐knockdown Caco2 and NCM460 cells. B) TEER and FD4 level in monolayers of Caco2 cells treated with indicated acyl‐CoA (200 µm). Caco2 cells were treated with indicated acyl‐CoA every other day until the successful establishment of the cell barrier model. C–E) Immunoblotting for H4K12cr level in control and C) ACSS2‐knockdown, D) VY‐3‐135 (1 µm) treated or E) ACSS2‐overexpressed cells. F) The heatmap of H4K12cr ChIP‐seq signals sorted by differential H4K12cr peaks in control and ACSS2‐knockdown NCM460 cells. G) The H4K12cr signal profiles around TSS regions in NCM460 cells with ACSS2 knockdown. H) The distribution of ACSS2‐knockdown mediated H4K12cr peaks loss. I) H4K12cr was positively correlated with mRNA expression levels. The ChIP signal intensity (read count per million mapped reads) was shown for genes with differential expressed genes (the top 50% and the bottom 50% of RNA‐seq counts). J) IGV track visulization for CLDN7 based on indicated ChIP‐seq and ATAC‐seq analysis results. K, L) ChIP‐qPCR analysis results of H4K12cr on CLDN7 in control and ACSS2‐knockdown Caco2 and NCM460 cells. Relative band intensities are annotated below respective lanes (A, C–E). Values are mean ± SD. *p < 0.05, **p < 0.01, ***p < 0.001, determined by one‐way ANOVA with Bonferroni's post hoc test B) and two‐tailed Student's t‐test K, L).
Figure 5
Figure 5
Sodium crotonate improves intestinal barrier function and ameliorates colitis. A) The plasma crotonate level in healthy volunteers (n = 10) and CD patients (n = 15), as detected by mass spectrometry. B‐C) TEER and FD4 measurement in monolayers of Caco2 cells with indicated treatment. D) Relative mRNA levels of CLDN7 in Caco2 and NCM460 cells treated with NaCr (10 mmol L−1). E) The administrative strategy for mice from indicated groups. F–O) NaCr treatment alleviated colitis progression (n = 8 for each group). F) The mice body weight curves from indicated experimental groups. G, H) Representative colon images and colon length statistics from each group. I) The DAI statistics for mice from indicated groups. J,K) Histological score and representative HE/Alcian blue staining images of colon tissues from indicated groups. Scale bar = 100 µm. L) The plasma FD4 level in mice from indicated experimental groups. M) The plasma crotonyl‐CoA concentration in mice from indicated experimental groups. N, O) Immunoblotting and statistical analysis of H4K12cr and CLDN7 in colon tissues from indicated groups. The concentration of NaCr used in vivo was 20 mg kg−1 d−1. Values are mean ± SD. n.s. (not significant, p > 0.05), *p < 0.05, **p < 0.01, ***p < 0.001, determined by two‐tailed Student's t‐test A, D), one‐way ANOVA with Bonferroni's post hoc test B, C, H‐J, L, M, O) and repeated measures ANOVA with Bonferroni's post hoc test F).
Figure 6
Figure 6
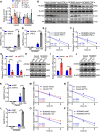
TNF‐α promotes decay of ACSS2 mRNA by increasing its m6A methylation. A) Relative mRNA levels of ACSS2 in Caco2 and NCM460 with indicated treatment (The concentration of all cytokines was 50 ng mL−1). B) Immunoblotting of H4K12cr and ACSS2 in Caco2 and NCM460 cells treated with TNF‐α. C, D) The m6A modification levels of ACSS2 mRNA in Caco2 and NCM460 cells treated with TNF‐α. E, F) Relative mRNA levels of ACSS2 in cells with indicated treatment, collected in indicated timepoint. The half‐life was calculated by the fitted line. G, H) FTO knockdown decreased ACSS2 expression in Caco2 and NCM460 cells, as detected by G) qRT‐PCR and H) immunoblotting. I, J) FTO overexpression enhanced ACSS2 expression in Caco2 and NCM460, as detected by I) qRT‐PCR and J) immunoblotting. K,L) The m6A modification level of ACSS2 mRNA in control and FTO‐knockdown Caco2 and NCM460 cells. M‐P) Relative mRNA levels of ACSS2 in control, FTO‐knockdown, and FTO‐overexpression Caco2 and NCM460 cells at indicated timepoint. The half‐life was calculated by the fitted line. Relative band intensities are annotated below respective lanes (B, H, J). Values are mean ± SD. n.s. (not significant, p > 0.05), *p < 0.05, **p < 0.01, ***p < 0.001, determined by one‐way ANOVA with Bonferroni's post hoc test A), two‐tailed Student's t‐test C, D, G, I, K, L).
Figure 7
Figure 7
Anti‐TNF‐α therapy enhances the therapeutic effect of NaCr on colitis. A) Relative mRNA levels of ACSS2 and CLDN7 in ten pairs of intestinal biopsies from CD patients before and after IFX treatment. B) Correlation analysis results of relative mRNA levels of ACSS2 and CLDN7. C) The administrative strategy of anti‐TNF‐α therapy and NaCr in DSS‐induced colitis models. D‐L) Combining anti‐TNF‐α therapy and NaCr significantly alleviated colitis progression (n = 8 for each group). D) The mice body weight curves from indicated experimental groups. E, F) Representative colon images and colon length statistics from each group. G) The DAI statistics for mice from the indicated groups. H, I) Histological score and representative HE/Alcian blue staining images of colon tissues from indicated groups. Scale bar = 100 µm. J) The plasma FD4 level in mice from the indicated groups. K) The plasma crotonyl‐CoA level in mice from the indicated groups. L‐M) Immunoblotting and statistical analysis of H4K12cr and CLDN7 in colon tissues from the indicated groups. Values are mean ± SD. *p < 0.05, **p < 0.01, ***p < 0.001, determined by two‐tailed Student's t‐test A), Pearson's correlation with two‐tailed test B), repeated measures ANOVA with Bonferroni's post hoc test D), and one‐way ANOVA with Bonferroni's post hoc test F‐H, J, K, M).
Figure 8
Figure 8
Schematic diagram revealing the critical role of ACSS2‐H4K12cr‐CLDN7 axis in maintaining intestinal barrier function. In inflamed intestinal epithelium, TNF‐α reduces FTO expression, thereby destabilizing and decreasing ACSS2 mRNA by increasing its m6A modification. Reduced ACSS2 diminishes H4K12cr, leading to CLDN7 downregulation and intestinal barrier destruction. Combining anti‐TNF‐α therapy with crotonate supplementation increases ACSS2 and CLDN7 expression and repair intestinal barrier function.

References

    1. Ng S. C., Shi H. Y., Hamidi N., Underwood F. E., Tang W., Benchimol E. I., Panaccione R., Ghosh S., Wu J. C. Y., Chan F. K. L., Sung J. J. Y., Kaplan G. G., Lancet 2017, 390, 2769. - PubMed
    1. Chang J. T., N. Engl. J. Med. 2020, 383, 2652. - PubMed
    1. Villablanca E. J., Selin K., Hedin C. R. H., Nat. Rev. Gastroenterol. Hepatol. 2022, 19, 493. - PubMed
    1. Markovich Z., Abreu A., Sheng Y., Han S. M., Xiao R., Gut Microbes 2024, 16, 2389320. - PMC - PubMed
    1. Horowitz A., Chanez‐Paredes S. D., Haest X., Turner J. R., Nat. Rev. Gastroenterol. Hepatol. 2023, 20, 417. - PMC - PubMed

LinkOut - more resources