. 2025 Jul 12;74(8):267.
doi: 10.1007/s00262-025-04101-4.

Single-cell RNA sequencing and multi-omics analysis of prognosis-related staging in papillary thyroid cancer

Affiliations

Single-cell RNA sequencing and multi-omics analysis of prognosis-related staging in papillary thyroid cancer

Guo Ji et al. Cancer Immunol Immunother. .

Abstract

Background: Papillary thyroid cancer (PTC) is the most common thyroid cancer, but current molecular features inadequately stratify its risk. Whether distinct underlying mechanisms can further classify PTC and improve prognostic precision remains unclear.

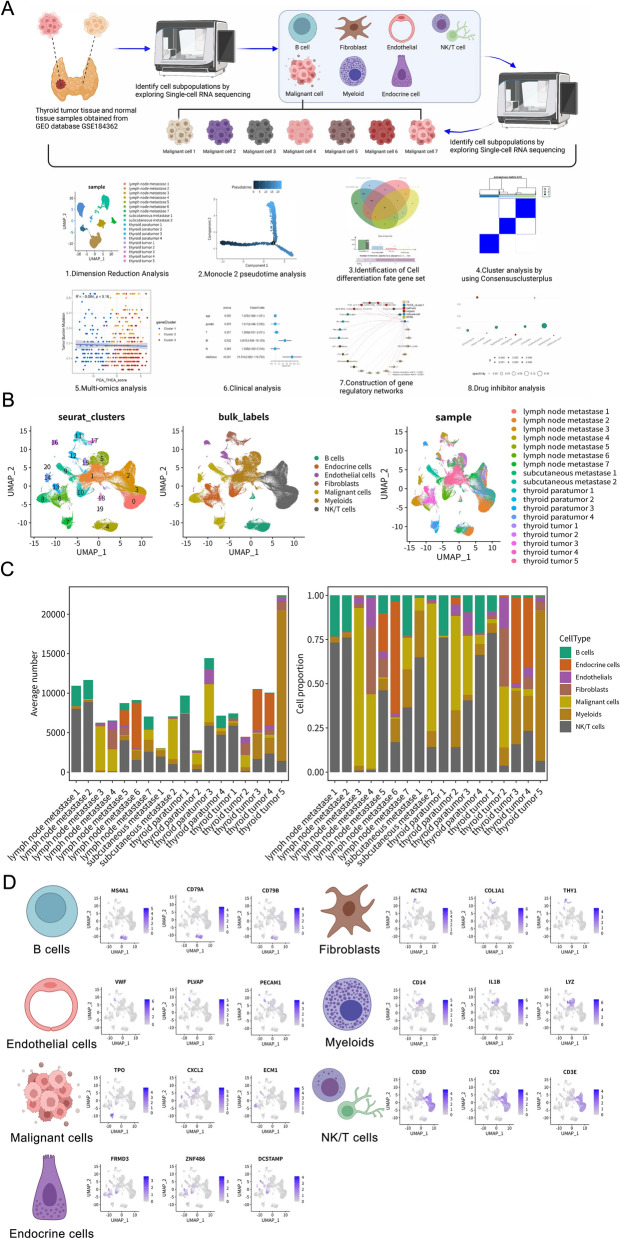
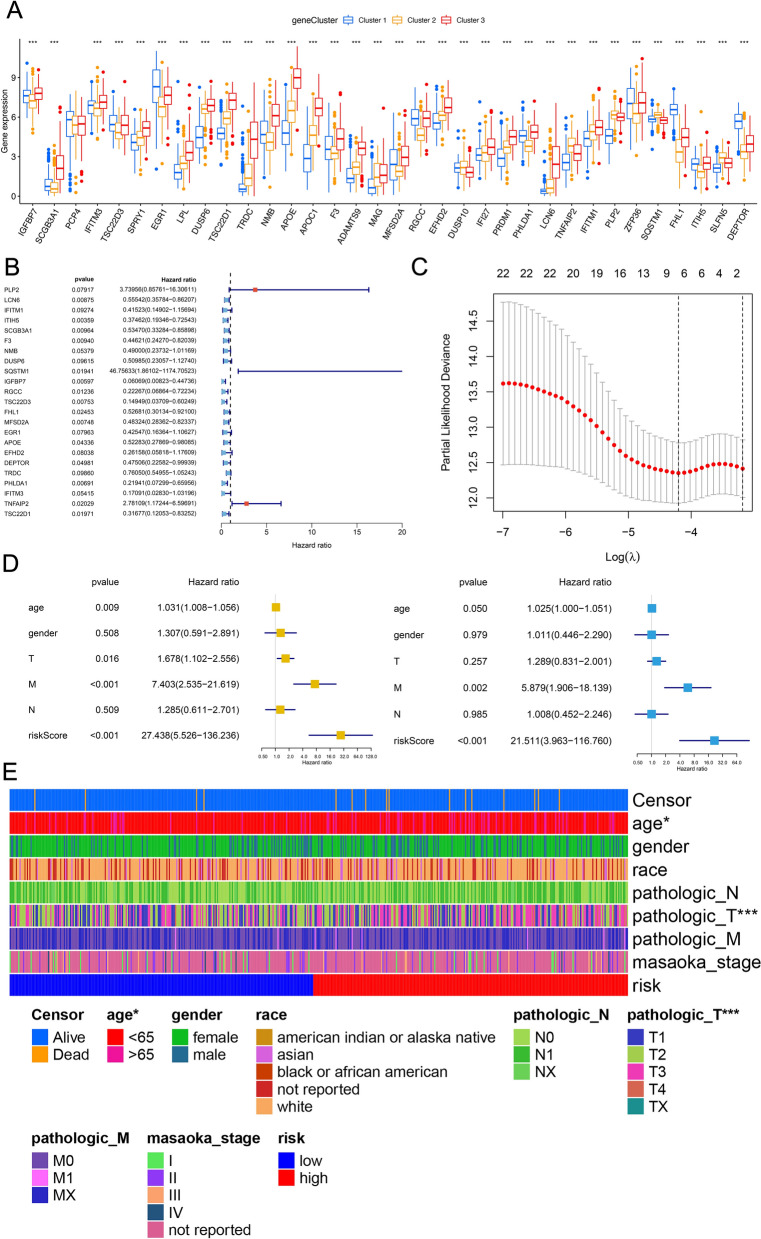
Methods: We integrated single-cell RNA sequencing data (158,577 cells from 11 PTC patients; GEO: GSE184362) with bulk-RNA sequencing data from The Cancer Genome Atlas Thyroid Carcinoma (TCGA-THCA) cohort (501 patients). Multi-omics analyses were employed to elucidate PTC heterogeneity, identify malignant cell differentiation and prognosis-related genes (MCD&PRGs), and construct a novel molecular classification, the Oncogenic Signature Of Papillary Thyroid Carcinoma Classification (OSPTCC). A prognostic risk score was developed, and the classification's prognostic relevance was further explored in an independent institutional cohort using qRT-PCR.

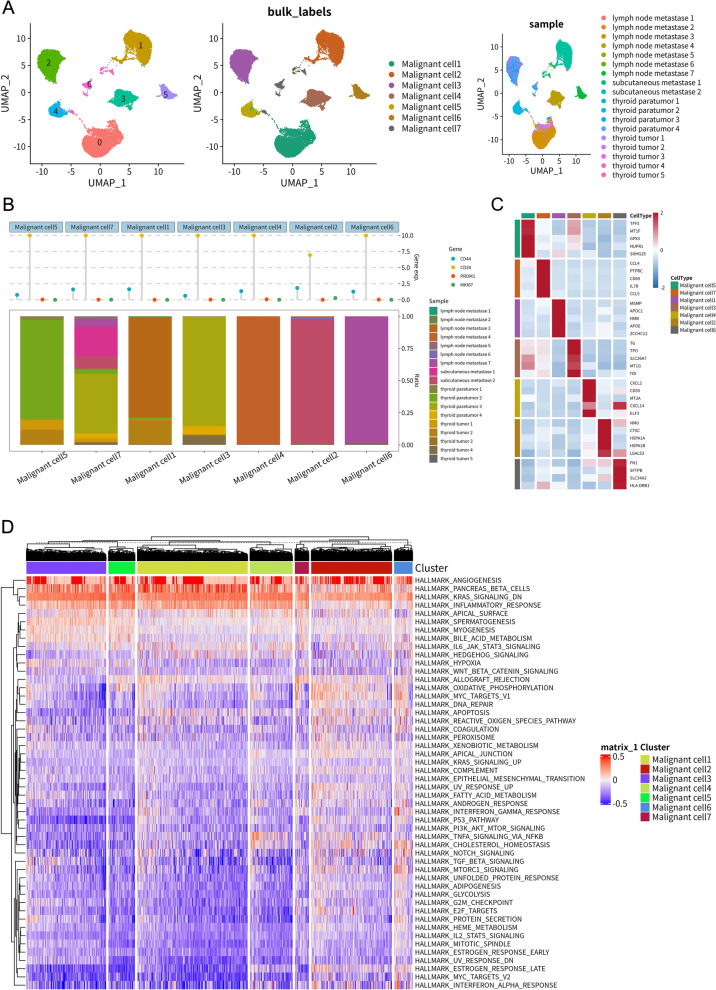
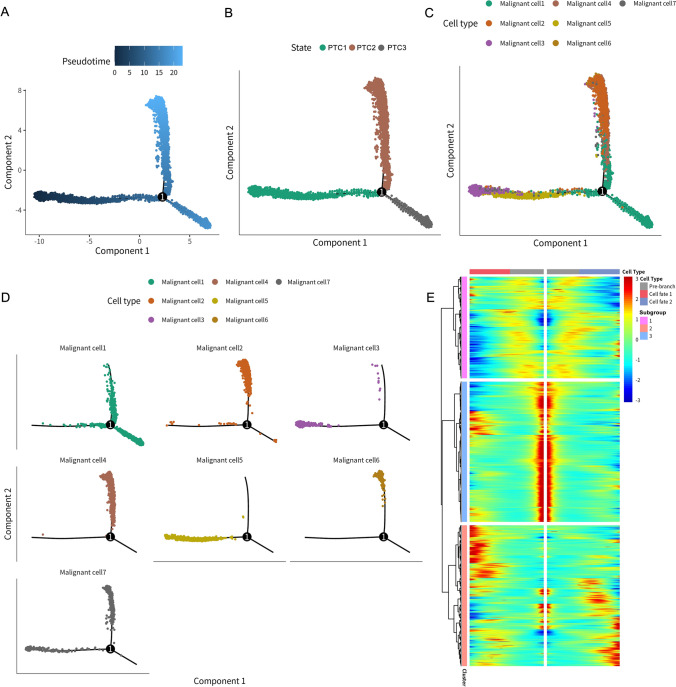
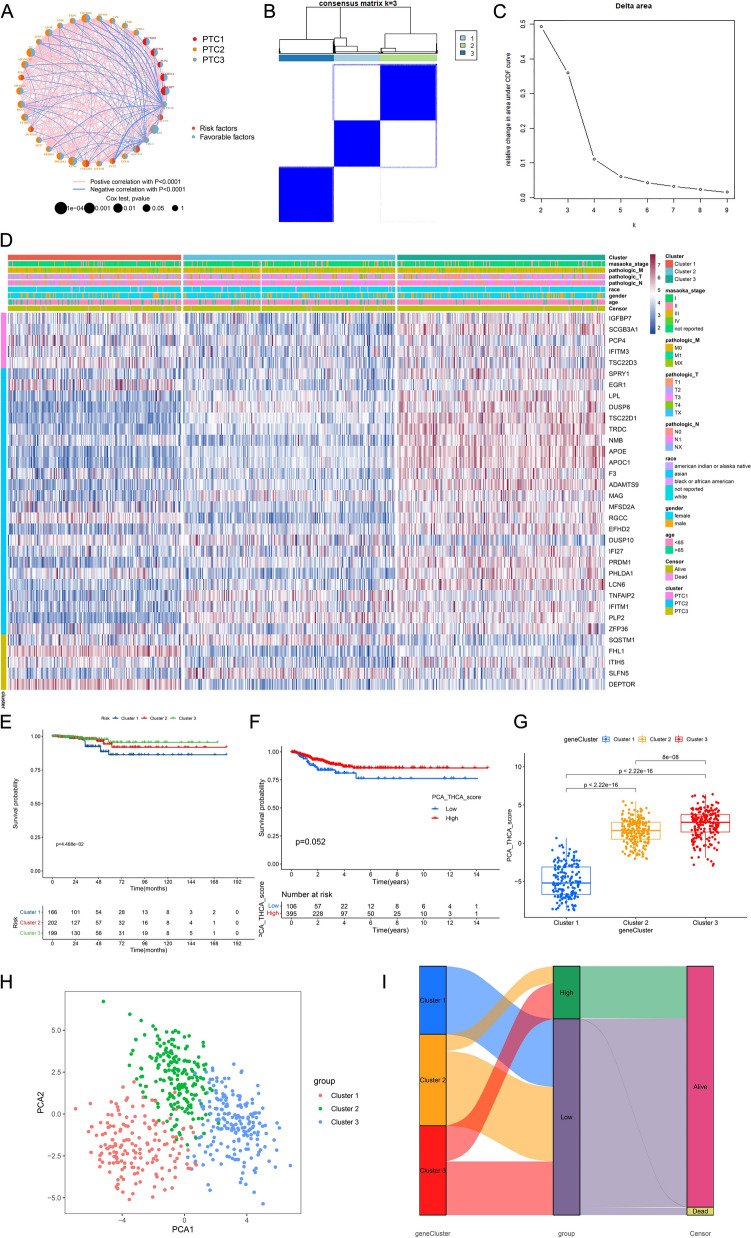
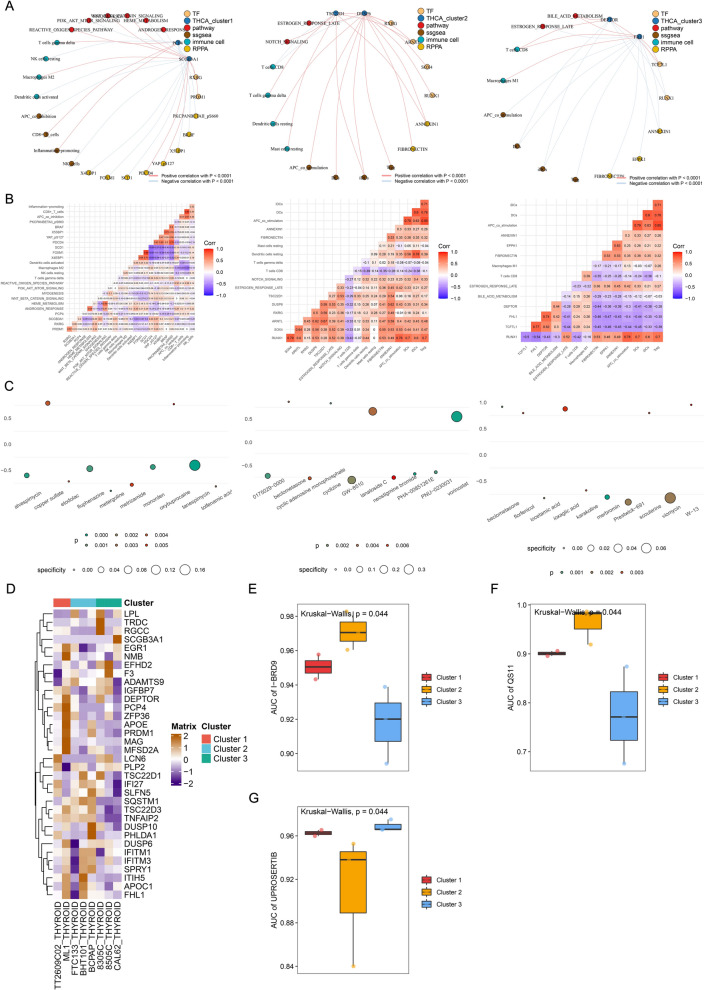
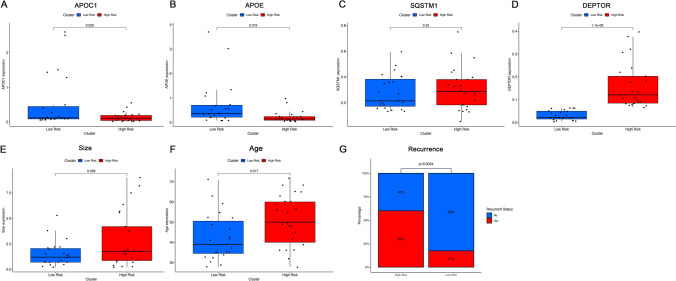
Results: Single-cell analysis revealed three malignant cell differentiation states (PTC1-3) and a 34-gene signature (MCD&PRGs). This formed the basis of our Oncogenic Signature Of Papillary Thyroid Carcinoma Classification (OSPTCC), defining three subtypes: Inflammation-associated (IPTCC), BRAF/autophagy-related (BAPTCC), and lipid metabolism-related (LPTCC). These subtypes showed distinct molecular profiles and significantly different progression-free survival (IPTCC poorest, P = 0.044). A 7-gene risk score derived from MCD&PRGs independently predicted prognosis (multivariate HR = 21.511, P < 0.001). qRT-PCR validation in an independent cohort (n = 48) using key markers (DEPTOR, APOE, APOC1) confirmed that OSPTCC-based risk stratification correlated with adverse clinical features, including higher recurrence rates in the high-risk group (P = 0.007).

Conclusions: This study introduces OSPTCC, a prognostically significant molecular classification for PTC based on tumor cell differentiation states. The identified subtypes, characterized by distinct biological mechanisms, provide deeper insights into PTC's molecular pathology and offer a framework for improved risk stratification and potential precision therapies.

Keywords: Molecular subtypes; Multi-omics; Papillary thyroid cancer; Single-cell RNA sequencing.


Conflict of interest statement

Declarations. Ethics approval and consent to participate: N/A Informed Consent: N/A Consent for publication: Not applicable. Competing interests: The authors declare no competing interests.

Figures

Fig. 1
Fig. 1
Single-cell RNA sequencing reveals cellular heterogeneity in papillary thyroid cancer. A Schematic overview of the study workflow, including data acquisition from GSE184362, scRNA-seq analysis steps (dimensionality reduction, pseudotime analysis, gene set identification, consensus clustering), multi-omics integration, clinical analysis, regulatory network construction, and drug prediction. B Uniform Manifold Approximation and Projection (UMAP) plots of 158,577 cells. Left: Cells colored by unsupervised Seurat clusters (0–19). Middle: Cells colored by annotated cell types (B cells, endocrine cells, endothelial cells, fibroblasts, malignant cells, myeloids, NK/T cells). Right: Cells colored by sample origin (lymph node metastasis, subcutaneous metastasis, thyroid paratumor, thyroid tumor). C Bar plots showing the average absolute number (left y-axis) and relative proportion (right y-axis, stacked bars) of each annotated cell type across different tissue samples. D UMAP feature plots illustrating the expression levels of representative canonical marker genes used for annotating major cell types: B cells (MS4A1, CD79A, CD79B), fibroblasts (ACTA2, COL1A1, THY1), endothelial cells (VWF, PLVAP, PECAM1), myeloids (CD14, IL1B, LYZ), malignant cells (TPO, CXCL2, ECM1), endocrine cells (FRMD3, ZNF486, DCSTAMP), and NK/T cells (CD3D, CD2, CD3E). Color intensity indicates expression level
Fig. 2
Fig. 2
Heterogeneity and functional characteristics of malignant cell subtypes in PTC. A UMAP plots focusing on 24,096 malignant cells. Left: Cells colored by malignant subtype annotation (malignant cell 1–7). Middle: Same as left, showing subtype labels. Right: Malignant cells colored by sample origin. B Top: Cleveland dot plot showing scaled expression levels of selected cancer-related markers (CD44, CD24, PROM1, MKI67) across the seven malignant subtypes. Bottom: Stacked bar plot illustrating the proportion of cells contributed by each sample origin within each malignant subtype. C Heatmap displaying the scaled expression of top differentially expressed genes (DEGs) characterizing each malignant cell subtype. Rows represent genes and columns represent subtypes. Red indicates higher expression, and blue indicates lower expression. D Heatmap showing Gene Set Variation Analysis (GSVA) scores for 50 Hallmark pathways across the seven malignant cell subtypes. Rows represent pathways; columns represent cell clusters corresponding to subtypes. Red indicates higher pathway activity; blue indicates lower activity. Hierarchical clustering is applied to pathways (rows)
Fig. 3
Fig. 3
Pseudotime trajectory analysis of malignant cell differentiation. A Pseudotime trajectory of malignant cells inferred by Monocle2. Cells are colored according to their calculated pseudotime value (dark blue = early, light blue/yellow = late). The black line represents the inferred trajectory path. B The same trajectory plot with cells colored by the three identified principal states (State 1, State 2, State 3) along the differentiation path. The branch point is labeled'1.'C The trajectory plot with cells colored by their malignant cell subtype annotation (malignant cell 1–7). D Individual trajectory plots faceted by malignant cell subtype, illustrating the distribution of each subtype along the inferred differentiation path. E Heatmap showing smoothed gene expression dynamics across pseudotime based on branch point 1 of the pseudotime trajectory. Rows represent trajectory-dependent genes grouped into three clusters (Subgroup 1–3). Columns represent cells ordered by pseudotime, segmented into pre-branch (PTC1) and two differentiation branches (cell fate 1 and cell fate 2, corresponding to PTC2 and PTC3). The distinct expression patterns validate the effectiveness of pseudotime trajectory analysis in capturing transcriptional differences associated with cell fate divergence. Red indicates higher expression, and blue indicates lower expression relative to the average expression across pseudotime
Fig. 4
Fig. 4
Construction and prognostic significance of OSPTCC molecular subtypes. A Co-expression network of the 34 MCD&PRGs. Nodes are colored based on association with differentiation states (PTC1, PTC2, PTC3 from Fig. 3) and prognostic impact (risk vs. favorable factors based on Cox analysis). Edges represent significant correlations (pink = positive, blue = negative, P < 0.0001). Node size reflects Cox test P-value significance. B Consensus matrix heatmap for k = 3 clusters based on MCD&PRG expression in TCGA-THCA. Dark blue indicates high consensus (samples frequently cluster together). C Delta area plot showing the relative change in area under the CDF curve for different numbers of clusters (k), indicating optimal stability at k = 3. D Heatmap showing the expression profiles of the 34 MCD&PRGs (rows) across TCGA-THCA tumor samples (columns), ordered by OSPTCC cluster assignment (Cluster 1, 2, 3). Clinical annotations (e.g., stage, TNM, gender, age, survival status) are shown above the heatmap. Red indicates higher expression; blue indicates lower expression. E Kaplan–Meier curves comparing PFS among the three OSPTCC subtypes (Clusters 1, 2, 3) in the TCGA-THCA cohort. Log-rank P-value is shown. F Kaplan–Meier curves comparing survival (likely Overall Survival or similar, based on timescale) between patients stratified by the median PCA_THCA_score (low vs. high). Log-rank P-value is shown. G Boxplots comparing the PCA_THCA_score distribution across the three OSPTCC subtypes. P-values from pairwise comparisons (e.g., Wilcoxon test) are indicated. H Principal component analysis (PCA) plot of TCGA-THCA samples based on the expression of the 34 MCD&PRGs. Points are colored by OSPTCC subtype assignment (Cluster 1 = Red, Cluster 2 = Green, Cluster 3 = Blue). I Sankey diagram illustrating the flow of patients between OSPTCC subtypes (geneCluster: Clusters 1–3), PCA score groups (group: low vs. high based on median), and survival status (censor: alive vs. dead). The width of the flows represents the number of patients
Fig. 5
Fig. 5
Development and validation of the MCD&PRG-based prognostic risk score. A Boxplots showing the expression levels of selected MCD&PRGs (likely those in the final risk model) across the three OSPTCC subtypes (Clusters 1, 2, 3) in the TCGA-THCA cohort. Asterisks denote statistical significance (*P < 0.05, **P < 0.01, ***P < 0.001). B Forest plot displaying the results of univariate Cox regression analysis for the 22 MCD&PRGs initially associated with PFS. Hazard ratios (HRs) and 95% confidence intervals (CIs) are shown for each gene. C LASSO regression ten-fold cross-validation plot. The Y-axis represents the partial likelihood deviance, and the X-axis represents the log(λ) penalty parameter. Vertical dashed lines indicate the lambda values corresponding to the minimum deviance (lambda.min) and the minimum deviance plus one standard error (lambda.1se). The numbers at the top indicate the number of nonzero coefficients (selected genes) at different lambda values. D Forest plots summarizing univariate (left) and multivariate (right) Cox regression analyses for PFS, including clinical variables (age, gender, pathological T, M, N stage) and the derived risk score. HRs and 95% CIs are shown. E Heatmap illustrating the association between the risk score groups (low vs. high risk) and various clinicopathological features in the TCGA-THCA cohort. Rows represent clinical features; columns represent individual patients ordered by risk score. Colors indicate different categories for each clinical variable as defined in the legend
Fig. 6
Fig. 6
Subtype-specific regulatory networks and therapeutic predictions. A Network diagrams illustrating potential regulatory interactions within each OSPTCC subtype (Cluster 1/IPTCC, Cluster 2/BAPTCC, Cluster 3/LPTCC). Nodes represent transcription factors (TF), core MCD&PRGs (THCA_cluster1/2/3), signaling pathways (pathway), immune cell infiltration scores (ssgsea), immune cell types (immune cell), and RPPA protein levels (RPPA). Edges indicate significant correlations (Pearson/Spearman |R|> 0.3, P < 0.001), with red lines for positive and blue lines for negative correlations. B Corresponding heatmaps showing the correlation coefficients between selected components within each subtype-specific network depicted in A. Red indicates positive correlation; blue indicates negative correlation. C Bubble plots summarizing Connectivity Map (CMap) predictions for small molecule inhibitors targeting each OSPTCC subtype signature. Bubble size represents specificity score; color intensity represents statistical significance (P-value). Top candidate drugs are labeled. D Heatmap displaying the expression levels (scaled Z-score) of the 34 MCD&PRGs across a panel of thyroid cancer cell lines. Rows represent genes; columns represent cell lines. (E–G) Boxplots showing the predicted drug sensitivity (area under the curve, AUC; lower AUC indicates higher sensitivity) based on GDSC data for specific inhibitors across the three OSPTCC clusters. E Sensitivity to I-BRD9. F Sensitivity to QS11. G Sensitivity to UPROSERTIB. Kruskal–Wallis test P-values are indicated
Fig. 7
Fig. 7
qRT-PCR and clinical feature validation of OSPTCC typing. A Differential expression of the APOC1 gene between high- and low-risk groups. B Differential expression of the APOE gene between high- and low-risk groups. C Differential expression of the SQSTM1 gene between high- and low-risk groups. D Differential expression of the DEPTOR gene between high- and low-risk groups. E Difference in tumor size between high-risk and low-risk groups. F Difference in age between high-risk and low-risk groups. G Difference in the incidence of recurrence events between high-risk and low-risk groups

Similar articles

References

    1. Fagin JA, Wells SA Jr (2016) Biologic and Clinical Perspectives on Thyroid Cancer. N Engl J Med 375(11):1054–1067 - PMC - PubMed
    1. Leenhardt L, Grosclaude P, Chérié-Challine L (2004) Increased incidence of thyroid carcinoma in france: a true epidemic or thyroid nodule management effects? Report from the French Thyroid Cancer Committee. Thyroid 14(12):1056–1060 - PubMed
    1. Wiltshire JJ et al (2016) Systematic Review of Trends in the Incidence Rates of Thyroid Cancer. Thyroid 26(11):1541–1552 - PubMed
    1. Davies L, Welch HG (2014) Current thyroid cancer trends in the United States. JAMA Otolaryngol Head Neck Surg 140(4):317–322 - PubMed
    1. Ahn HS, Kim HJ, Welch HG (2014) Korea’s thyroid-cancer “epidemic”–screening and overdiagnosis. N Engl J Med 371(19):1765–1767 - PubMed

Substances