. 2025 Jul 22;44(7):115977.
doi: 10.1016/j.celrep.2025.115977. Epub 2025 Jul 10.

BLIMP1 controls GC B cell expansion and exit through regulating cell cycle progression and key transcription factors BCL6 and IRF4

Affiliations

BLIMP1 controls GC B cell expansion and exit through regulating cell cycle progression and key transcription factors BCL6 and IRF4

Laura Conter et al. Cell Rep. .

Abstract

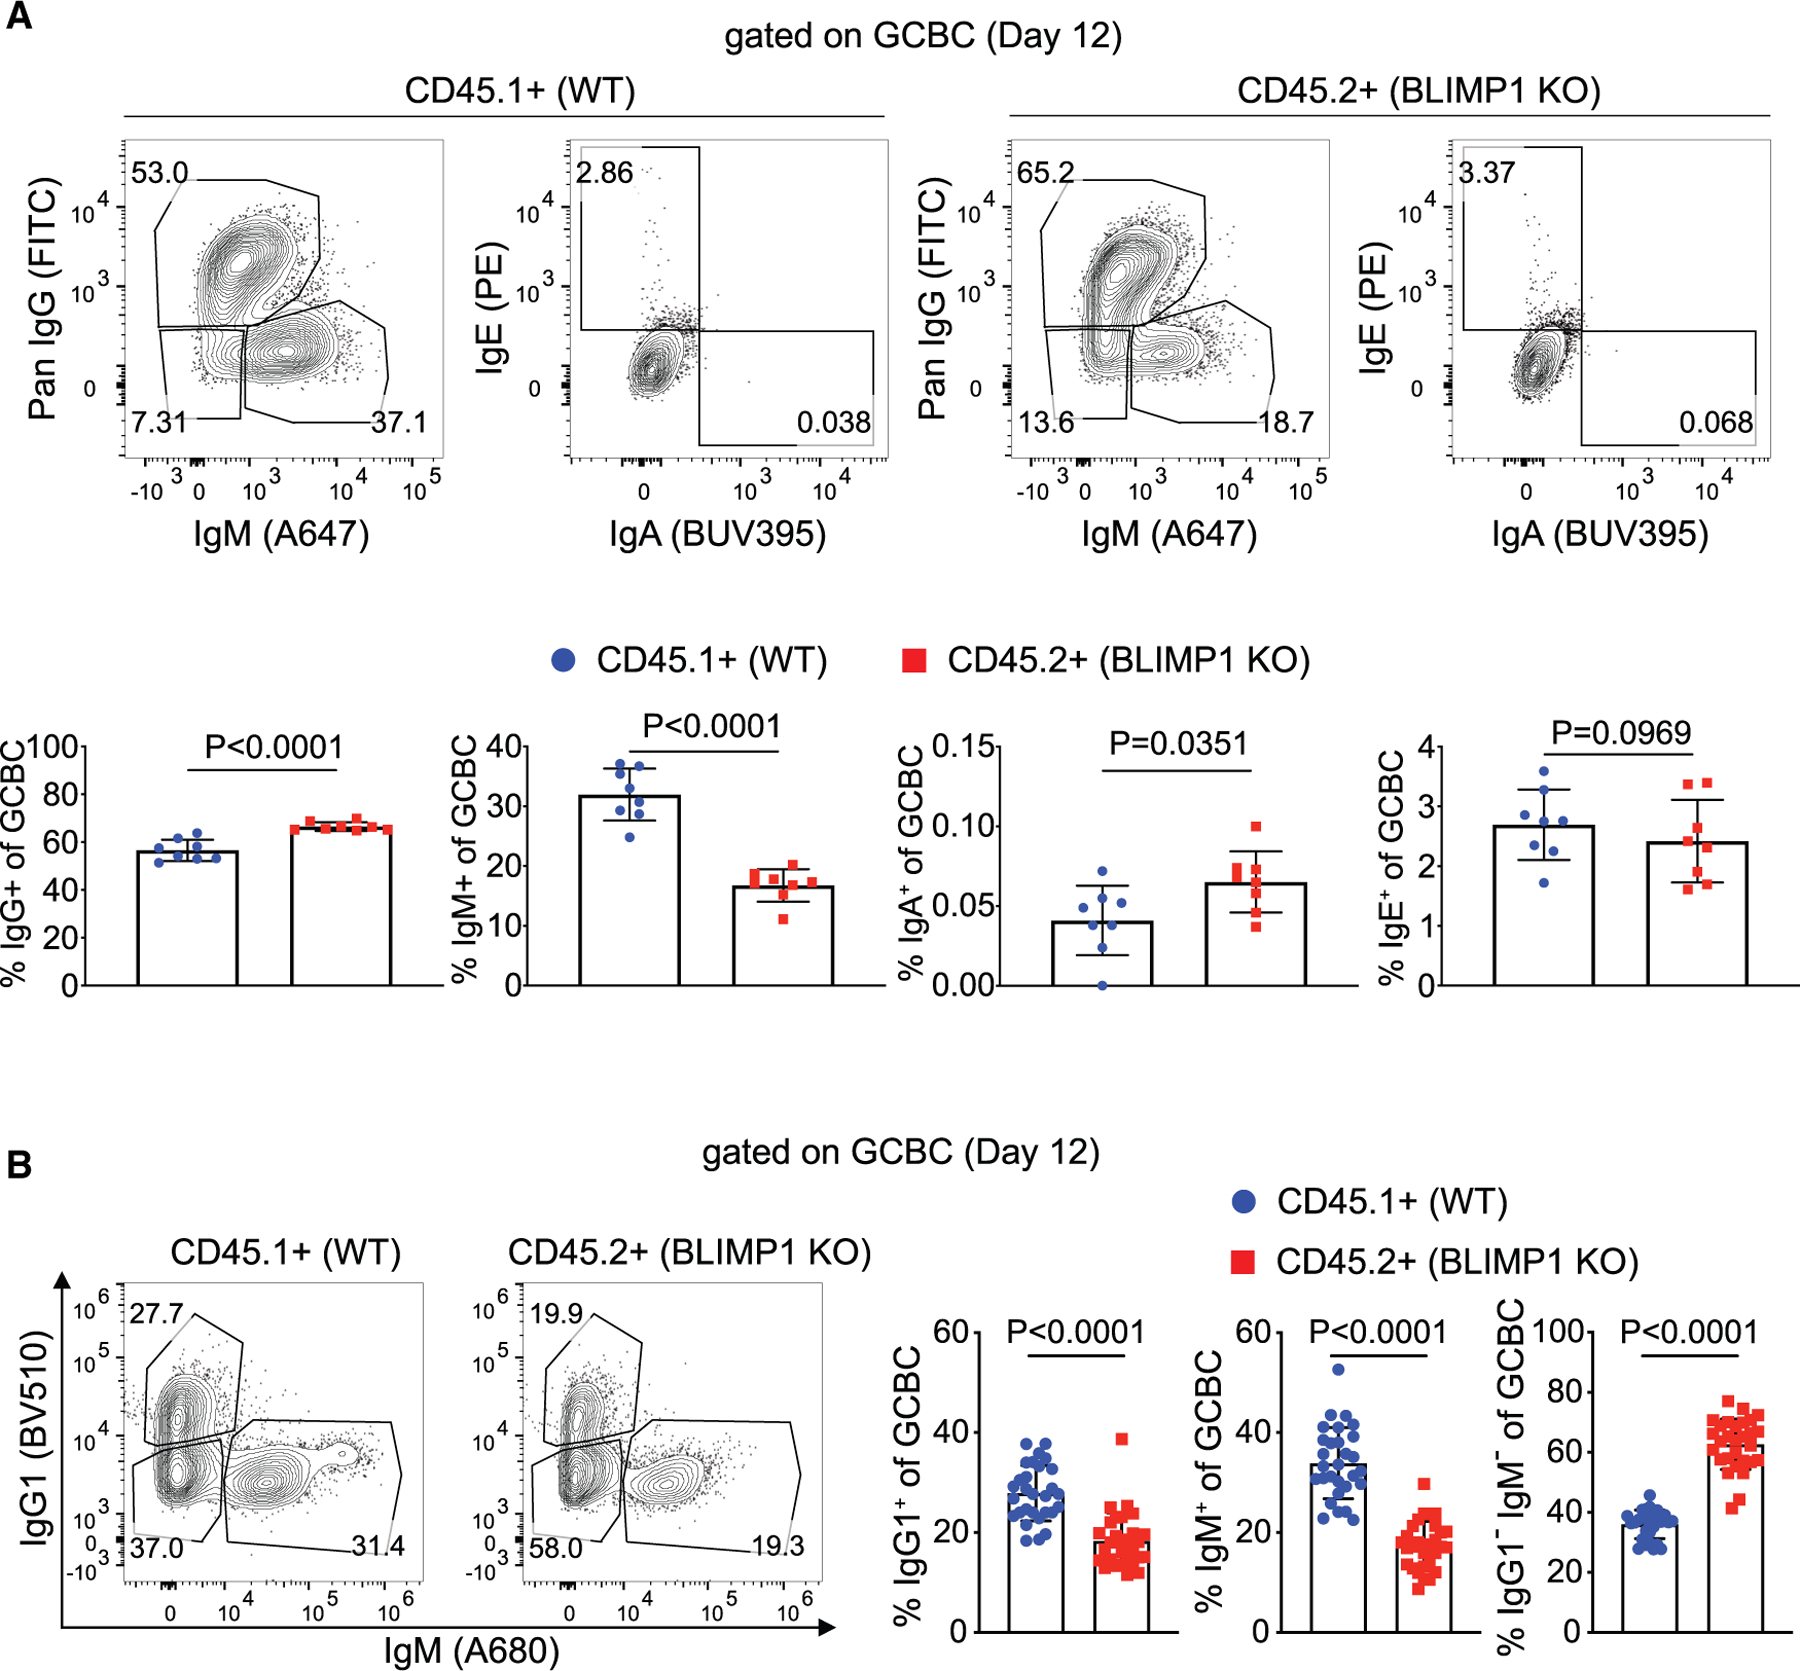
In B cells, BLIMP1 is required for plasma cell differentiation. BLIMP1 is also expressed in some germinal center (GC) B cells (GCBC), yet the role of BLIMP1 in GCBC is not understood. Here we generated mixed bone marrow (BM) chimeric mice using Prdm1+/+ CD19Cre and Prdm1fl/fl CD19Cre BM, allowing us to examine the cell-intrinsic functions of BLIMP1 in GCBC, independent of antibody or antigen levels. Strikingly, BLIMP1-deficient B cells quickly dominate GCs and persist for a much longer time compared with wild-type cells. BLIMP1 deficiency promotes positive selection of GCBCs and enhances cell-cycle progression. Additionally, BLIMP1 deficiency alters class switching and memory B cell generation from GCBCs. Mechanistically, BLIMP1-deficient GCBCs fail to downregulate BCL6 and to upregulate IRF4, indicating that BLIMP1 controls the expression of these transcription factors that mediate exit from the GC. These studies revealed unique functions of BLIMP1 in regulating GCBC responses that impact long-lived immune compartments.

Keywords: B cell; BCL6; Blimp1; CP: Immunology; germinal center; memory B cells; plasma cells; transcription factors.


Conflict of interest statement

Declaration of interests S.H.K. receives consulting fees from Peraton.

Figures

Figure 1.
Figure 1.. BLIMP1 controls GCBC expansion in a cell-intrinsic manner
(A) Schematic of the BM chimera design. (B) BM chimera mice were immunized with NP-CGG in alum. The frequency of BLIMP1 KO and WT donor cells among GCBCs and non-GCBCs in the spleen at days 7 and 12 and week 8 after immunization was examined by flow cytometry. Day 7 consists of two independent experiments (n = 13), day 12 consists of four independent experiments (n = 30), and week 8 consists of three independent experiments (n = 21). p values were determined by two-tailed paired t test. Bars show mean ± SD. (C) Immunofluorescence staining of GC with CD45.1 and CD45.2 markers (see additional image examples in Figure S2A). Spleen sections from three mice on day 12 after NP-CGG in alum were imaged and four to nine GCs per mouse were analyzed. Graph shows fraction of PNA+ pixels that are BLIMP1 KO or WT. p values were determined by two-way repeated measures ANOVA.
Figure 2.
Figure 2.. BLIMP1 deficiency affects GCBC cell-cycle progression, zonal distribution, and positive selection
BM chimera mice were immunized with NP-CGG in alum and splenic BLIMP1 KO and WT donor cells were examined by flow cytometry at day 12 after immunization. (A) Mice were treated with EdU 1 h before analysis. Data show representative flow plots and frequencies of G1, S, and G2/M subsets in BLIMP1 KO and WT GCBC as determined by DAPI and EdU staining. Data are from two independent experiments (n = 15). p values were determined by two-tailed paired t test. Bars show mean ± SD. (B) Representative flow plots of LZ and DZ distribution among BLIMP1 KO and WT GCBCs and quantitation of the ratio of DZ to LZ from four independent experiments (n = 29). p value was determined by two-tailed paired t test. (C) Representative flow plots and quantitation of the frequency of cleaved caspase3+ among BLIMP1 KO and WT GCBCs. Data are from two independent experiments (n = 15). p values were determined by two-tailed paired t test. Bars show mean ± SD. (D) Frequency of c-MYC+ splenic BLIMP1 KO and WT GCBC from BM chimeric mice at day 12 and week 8 after NP-CGG immunization. Shown are representative flow plots with statistical analysis of four independent experiments (n = 30) for day 12 and three independent experiments (n = 21) for week 8. p values were determined by two-tailed paired t test. (E) Isolated B cells from immunized BLIMP1 KO and WT mice t day 12 after NP-CGG in alum were stimulated for 2 h as indicated. c-MYC expression in GCBCs were examined by flow cytometry. Data are from two independent experiments (n = 9). Bars show mean ± SD. p values were determined by two-tailed unpaired t test. NP-Ficoll stimulation gated on NP-Ficoll FITC+ cells.
Figure 3.
Figure 3.. BLIMP1-deficient GCBCs more frequently express downstream Ig isotypes
Mixed BM chimeric mice were analyzed by flow cytometry at day 12 after NP-CGG in alum immunization. (A) Representative flow plots (top) and frequencies (bottom) of IgM, IgG, IgA, and IgE expression on BLIMP1 KO and WT GCBCs. Each dot is a single animal from one experiment (n = 8). p values were determined by two-tailed paired t test. Bars show mean ± SD. (B) Representative flow plots and frequencies of IgM and IgG1 staining on BLIMP1 KO and WT. Data are from four independent experiments (n = 29). p values were determined by two-tailed paired t test. Bars show mean ± SD.
Figure 4.
Figure 4.. The effect of BLIMP1 deficiency on GCBC affinity maturation
(A) Stacked bar plots showing the number of unique VDJ sequences classified as non-productive, productive-mutated, or productive-unmutated across genotypes (WT and BLIMP1 KO) for each isotype group (IgG+, IgM+, and IgM/IgG). (B) Distribution of Ighv region mutation counts (in nucleotides) among all productive rearrangements. Histograms depict the number of sequences with a given mutation load, with overlaid density plots showing smoothed distributions across genotypes and isotypes. (C) Fraction of all sequences containing a leucine substitution at position 33 (IMGT numbering), where a conserved tryptophan is typically encoded, stratified by isotype and genotype. (D) Posterior probability density functions for selection strength estimates (Σ) in the CDRs (top) and FWRs (bottom), calculated based on the most abundant sequence of each independent clone, using the BASELINe framework with the focused method. (Left) Selection strength distributions across isotypes in WT and BLIMP1 KO genotypes. (Right) Selection strength distributions by genotype across IgM/IgG B cells from three individual mice.
Figure 5.
Figure 5.. Transcriptomic analysis of BLIMP1 KO and WT GCBC
(A) Heatmap showing unbiased hierarchical clustering of differentially expressed genes (false discovery rate [FDR] of <0.05, log2 fold-change = 1) in BLIMP1 KO compared with WT samples (three replicates). (B) Volcano plot showing top differentially expressed genes in BLIMP1 KO compared with WT GCBC. The x axis shows the log2 fold-change and the y axis shows −log10 of the FDR. Each dot is a gene. Blue dots highlight significantly differentially expressed genes (FDR < 0.05). Square shape represents TFs and triangles are genes encoding surface proteins. (C and D) Bubble plots show the top 20 (C) TF motifs and (D) pathways enriched among upregulated (magenta) and downregulated (blue) genes from cluster 8 (BLIMP1hi GCBCs) from our previously published scRNA-seq. The x axis shows the −log10 FDR for the enriched terms displayed on y axis. Bubble size reflects the number genes in the pathway that are differential in cluster 8 versus the other clusters (from Luo et al.).
Figure 6.
Figure 6.. MBC development in absence of BLIMP1
Mixed BM chimera mice were immunized with NP-CGG in alum. Eight weeks after immunization, the frequency of BLIMP1 KO (CD45.2) and WT (CD45.1) donor cells among splenic NP-specific CD80/PDL2 MBC subsets was examined by flow cytometry. (A) Representative flow plots illustrating the gating for NP-specific MBC subsets and frequencies of BLIMP1 KO and WT cells in each subset. Each subset quadrant gate is color coded in the rightmost plot on the top row and then the CD45.1 vs. CD45.2 distribution is plotted according to the same scheme in the four plots below that. (B) Quantification of the ratio of BLIMP1 KO to WT cells in each MBC subset normalized to the ratio of BLIMP1 KO and WT cells in the total B cell population. Data are from three independent experiments (n = 21). p values were determined by two-tailed paired t test. p values on each bar represent significance of testing the null hypothesis that the ratio is 1 (predicted value if no difference between KO and WT). (C) Fluorescence-activated cell sorting analysis of MBC precursors in GCBCs based on CCR6 and CD38 expression levels from mixed BM chimera mice at day 12 after immunization with NP-CGG in alum. Representative flow plots and frequency of CCR6+CD38+ in BLIMP1 KO and WT GCBCs are shown. Data are from three independent experiments (n = 25). p value was determined by two-tailed paired t test.
Figure 7.
Figure 7.. BLIMP1 signaling controls GCBC differentiation by regulating BCL6 and IRF4 expression
(A and B) Mixed BM chimera mice were immunized with NP-CGG in alum. Splenic BLIMP1 KO and WT donor cells were examined at days 7 and 12 and week 8 after immunization by flow cytometry. (A) Representative day 12 flow staining of BCL6 and IRF4 gated on BLIMP1 KO (CD45.2) and WT (CD45.1) GCBCs. (B) Tabulation of frequencies of BCL6lo IRF4hi and BCL6lo IRF4lo among BLIMP1 KO and WT GCBCs at different time points. Day 7 consists of two independent experiments (n = 13), day 12 consists of four independent experiments (n = 30), and week 8 consists of three independent experiments (n = 21). p values were determined by two-tailed paired t test. Bars show mean ± SD. (C) Sorted GCBC from NP-CGG-immunized BLIMP1 KO and WT mice were cultured for 48 h with α-CD40 or α-CD40 + IL-21. Flow cytometry was used to examine BCL6 and IRF4 expression after stimulation. Representative flow plots and frequencies of BCL6loIRF4hi and BCL6loIRF4lo cells are shown. Data are from three independent experiments with cells pooled from 5 to 11 mice in each experiment. p values were determined by two-tailed paired t test. Bars show mean ± SD.

References

    1. Luo W, Weisel F, and Shlomchik MJ (2018). B Cell Receptor and CD40 Signaling Are Rewired for Synergistic Induction of the c-Myc Transcription Factor in Germinal Center B Cells. Immunity 48, 313–326.e5. 10.1016/j.immuni.2018.01.008. - DOI - PMC - PubMed
    1. Tunyaplin C, Shaffer AL, Angelin-Duclos CD, Yu X, Staudt LM, and Calame KL (2004). Direct repression of prdm1 by Bcl-6 inhibits plasmacytic differentiation. J. Immunol 173, 1158–1165. 10.4049/jimmunol.173.2.1158. - DOI - PubMed
    1. Shaffer AL, Yu X, He Y, Boldrick J, Chan EP, and Staudt LM (2000). BCL-6 represses genes that function in lymphocyte differentiation, inflammation, and cell cycle control. Immunity 13, 199–212. 10.1016/s1074-7613(00)00020-0. - DOI - PubMed
    1. Shaffer AL, Lin KI, Kuo TC, Yu X, Hurt EM, Rosenwald A, Giltnane JM, Yang L, Zhao H, Calame K, and Staudt LM (2002). Blimp-1 orchestrates plasma cell differentiation by extinguishing the mature B cell gene expression program. Immunity 17, 51–62. 10.1016/s1074-7613(02)00335-7. - DOI - PubMed
    1. Shapiro-Shelef M, Lin KI, McHeyzer-Williams LJ, Liao J, McHeyzer-Williams MG, and Calame K (2003). Blimp-1 is required for the formation of immunoglobulin secreting plasma cells and pre-plasma memory B cells. Immunity 19, 607–620. 10.1016/s1074-7613(03)00267-x. - DOI - PubMed

MeSH terms

Substances

LinkOut - more resources