. 2025 Jul 8;53(13):gkaf660.
doi: 10.1093/nar/gkaf660.

Design of mismatch closure for enhanced specificity in DNA strand displacement reactions

Affiliations

Design of mismatch closure for enhanced specificity in DNA strand displacement reactions

Hongyan Yu et al. Nucleic Acids Res. .

Abstract

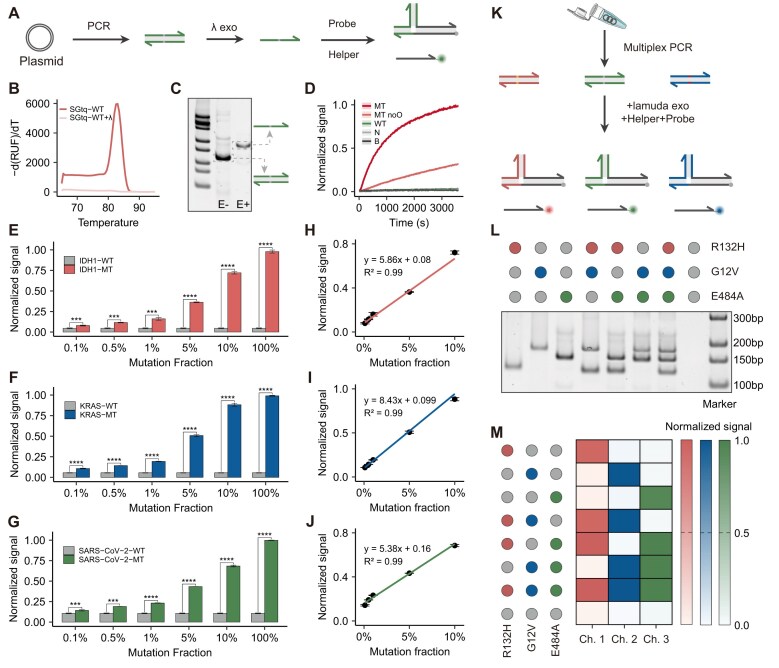
Specific and sensitive DNA hybridization plays a key role in biotechnology, nanotechnology, and medical technology. However, traditional DNA hybridization-based strategies often require careful tuning of the binding affinity of the probe to attain a trade-off between specificity and sensitivity. Herein, we proposed energy barrier-gated dynamic selectivity to overcome this limitation. The mismatch closure-mediated strand displacement reaction (mcSDR) induces structural constraints through helper strand binding at mismatched sites, resulting in the displacement of the mismatch target requires overcoming an additional activation energy barrier, whereas the perfect match target proceeds via a normal pathway. The mcSDR has been thermodynamically and kinetically demonstrated to be able to balance specificity and sensitivity simultaneously. The energy barrier height can be programmably adjusted by design of helper strand and works in synergy with the toehold exchange strategy to achieve multi-parameter optimization. The superior properties of the mcSDR facilitated the identification of 12 mutation types exhibits excellent specificity in 28 clinically relevant single nucleotide variations. By combining polymerase chain reaction, mutations with an abundance of 0.1% were successfully detected in plasmid samples, and a triple mcSDR was successfully constructed. Clinical validation of 95 glioma and 93 colorectal cancer samples showed that IDH1 and KRAS mutations were 100% consistent with Sanger sequencing. The energy barrier-driven identification mechanism and operational simplicity of mcSDR make it promising for wide applications in biomedical research, molecular diagnosis, and precision medicine.


Conflict of interest statement

None declared.

Figures

Graphical Abstract
Graphical Abstract
Figure 1.
Figure 1.
(A) Schematic diagram of a traditional strand displacement reaction (tSDR). (B) Schematic diagram of a mcSDR.
Figure 2.
Figure 2.
(A) Schematic illustration of the reaction between the target and the tTD probe. (B) Schematic illustration of the reaction between the target and the MC probe. (C) Graph of yield change with ΔG. Compared to the tSDR, the yield and ΔΔG of mcSDR are observed to be greater. Perfect matches are indicated by circles, and mismatches are indicated by forks. (D) The energy landscape of tSDR. The tSDR process involves (i) the initial state of the reaction, (ii) toehold binding, (iii) branch migration, and (iv) incumbent separation. The mismatch between target and probe introduces an energetic penalty, which mainly increases the rate of back-off of the toehold binding step at the mismatch location. The presence of a mismatch leads to an overall elevated energy. (E) The energy landscape of mcSDR. The mcSDR process involves (i) the initial state of the reaction, (ii) toehold binding, (iia) base breathing, (iii) branch migration, and (iv) incumbent separation. The mismatch between the target and the probe reduces the number of toehold binding steps and branch migration steps by one step, respectively. (F) Yields of tSDR and mcSDR. (G) Reaction paths of PM targets. (H) Change in product concentration over time calculated using kinetic modeling. The dependence of the k value on (I) the length of the association domain and (J) the number of spacers. This was obtained by fitting the kinetics through the ordinary differential equation (ODE). (K) DF of spacer at different position. (L) mcSDR detection of different concentration ranges of targets. (M) Fluorescence signals generated by 250 nM PM and different concentrations of MM. T is the target concentration, P is the probe concentration, and the fixed probe concentration is 250 nM. (N) Fluorescence signals generated by different abundance targets. The probe worked robustly in (O) different temperatures, (P) different buffers, and (Q) different concentrations of interfering strands (PolyN) to distinguish mutations.
Figure 3.
Figure 3.
(A) Schematic diagram of mcSDR with increasing number of closures. (B) Graph of yield change with ΔG. (C) Comparison of ΔΔG with tSDR for mcSDR with varying number of closures. Simulation of the yields of (D) PM target and (J) MM target with different toehold lengths under different number of closures. Simulate the apparent rates of (E) PM target and (K) MM target with different toehold lengths under different number of closures. Simulation of (F) DF and (L) DDF (Yield (PM)2/Yield(MM)) with different toehold lengths under different number of closures. Experimental validation of the yields of (G) PM target and (M) MM target at different number of closures with different toehold lengths. Experimental validation of the apparent rates of (H) PM target and (N) MM target at different number of closures with different toehold length. Experimental validation of (I) DF and (O) DDF at different number of closures with different toehold length.
Figure 4.
Figure 4.
Normalized signal values and DFs of intended targets and SNVs observed for different mutation types when mcSDR was closed: (A) 1 nt, (B) 2 nt, (C) 3 nt. (D) Comparison of DDF produced by targets with different mutation types at different closure numbers. (E) Detection of 28 clinically or biologically important SNV mutant sequences and their corresponding WTs by experimentally calculated DF. (F) Validation of orthogonality analysis of 10 randomly selected targets by mcSDR.
Figure 5.
Figure 5.
(A) Workflow for analyzing SNV in plasmid samples using PCR and MC probes. (B) Comparison of Tm before and after treatment with λ exonuclease. (C) PAGE analysis of PCR products before and after λ exonuclease treatment. (D) Fluorescence curve of mcSDR to analyze PCR products of SNV targets. Evaluating the sensitivity of mcSDR for analyzing (E) IDH1, (F) KRAS, and (G) SARS-CoV-2 in plasmid samples with varying mutation abundance from 0.1% to 100%. Unpaired two-tailed t-tests were used to evaluate statistical differences between samples. ***P < .01, ****P < .0001. Normalized signals of (H) IDH1, (I) KRAS, and (J) SARS-CoV-2 were linearly related to mutation abundance from 0.1% to 10%. (K) Multiplex mcSDR assay. The schematic of the workflow of 3-plex mcSDR for simultaneous analysis of IDH1, KRAS, and SARS-CoV-2 mutations in plasmid samples. (L) PAGE analysis of the products of 3-plex PCR. (M) Assessment of plasmid sample combinations and their compatibility with MC probe mixtures used for the analysis IDH1, KRAS, and SARS-CoV-2. Technical replicates were performed for each sample (n = 3).
Figure 6.
Figure 6.
(A) Schematic of the workflow for analyzing clinical glioma and colorectal cancer tissues with MC probes after PCR enrichment. (B) Heatmap of results on 95 glioma tissue samples using MC probes and Sanger sequencing. (C) Partial Sanger sequencing results of IDH1 mutation sites. (D) Normalized signals in glioma samples from two clinical cohorts, including 38 positive and 57 negative samples. The normalized signals in the positive cohort were significantly higher than those in the negative cohort (P < .0001). (E) ROC curve used to determine the diagnostic accuracy and threshold of the proposed strategy in glioma samples. (F) Sensitivity and specificity of MC probes compared to Sanger sequencing in glioma samples was assessed using a confusion matrix (n = 95). (G) Heatmap of the results of 95 colorectal cancer tissue samples using MC probes and Sanger sequencing. (H) Partial sanger sequencing results of KRAS mutation sites. (I) Normalized signals in colorectal cancer samples from two clinical cohorts, including 22 positive and 71 negative samples. The normalized signals in the positive cohort were significantly higher than those in the negative cohort (P < .0001). (J) ROC curve used to determine the diagnostic accuracy and threshold of the proposed strategy in colorectal cancer samples. (K) Sensitivity and specificity of MC probes compared to Sanger sequencing in colorectal cancer samples was assessed using a confusion matrix (n = 93). Statistical differences between cohorts were assessed using unpaired two-tailed t-tests. All experiments were repeated three times.

Similar articles

References

    1. Seeman NC, Sleiman HF DNA nanotechnology. Nat Rev Mater. 2017; 3:17068. 10.1038/natrevmats.2017.68. - DOI
    1. Tang W, Zhong W, Tan Y et al. DNA strand displacement reaction: a powerful tool for discriminating single nucleotide variants. Top Curr Chem (Cham). 2020; 378:10. 10.1007/s41061-019-0274-z. - DOI - PubMed
    1. Gootenberg JS, Abudayyeh OO, Lee JW et al. Nucleic acid detection with CRISPR-Cas13a/C2c2. Science. 2017; 356:438–42. 10.1126/science.aam9321. - DOI - PMC - PubMed
    1. Rossi-Gendron C, El Fakih F, Bourdon L et al. Isothermal self-assembly of multicomponent and evolutive DNA nanostructures. Nat Nanotechnol. 2023; 18:1311–8. 10.1038/s41565-023-01468-2. - DOI - PMC - PubMed
    1. Hu Q, Li H, Wang L et al. DNA nanotechnology-enabled drug delivery systems. Chem Rev. 2019; 119:6459–506. 10.1021/acs.chemrev.7b00663. - DOI - PubMed

LinkOut - more resources