. 2025 Jul 12;16(1):6450.
doi: 10.1038/s41467-025-61579-3.

Highly adaptable deep-learning platform for automated detection and analysis of vesicle exocytosis

Affiliations

Highly adaptable deep-learning platform for automated detection and analysis of vesicle exocytosis

Abed Alrahman Chouaib et al. Nat Commun. .

Abstract

Activity recognition in live-cell imaging is labor-intensive and requires significant human effort. Existing automated analysis tools are largely limited in versatility. We present the Intelligent Vesicle Exocytosis Analysis (IVEA) platform, an ImageJ plugin for automated, reliable analysis of fluorescence-labeled vesicle fusion events and other burst-like activity. IVEA includes three specialized modules for detecting: (1) synaptic transmission in neurons, (2) single-vesicle exocytosis in any cell type, and (3) nano-sensor-detected exocytosis. Each module uses distinct techniques, including deep learning, allowing the detection of rare events often missed by humans at a speed estimated to be approximately 60 times faster than manual analysis. IVEA's versatility can be expanded by refining or training new models via an integrated interface. With its impressive speed and remarkable accuracy, IVEA represents a seminal advancement in exocytosis image analysis and other burst-like fluorescence fluctuations applicable to a wide range of microscope types and fluorescent dyes.


Conflict of interest statement

Competing interests: The authors declare no competing interests.

Figures

Fig. 1
Fig. 1. Overview of our neural networks and the feature extraction process.
a Flow of the two distinct methodologies employed to prepare the data prior to classification. LM coordinate matrix WiN2×d represents the selected region. Methodology 1 (top) is used for random burst events. The regions are extracted and then fed into a shared encoder network. A total of 26 patches, each 32 × 32 pixel, were extracted for every selected region. Methodology 2 (bottom) is applied to stationary burst events, where feature extraction is performed. Feature vectors comprise 13 regions centered on the event’s local maxima (R1,R2R13). The black regions in the “13 Small regions” scheme represent buffer zones. The feature extraction output for stationary burst events is organized by event count, region, and time series dimension. b Vision transformer network architecture. c Multivariate LSTM network architecture. d LSTM network recognizes each data package as a graph of 13 curves representing the regions normalized mean-intensity variations over time. The LSTM model is available for random burst event analysis as well. Event pattern graphs illustrate: 1. single T cell lytic granule fusion in which the fluorescent cargo was either pH-sensitive (left) or 2. pH-insensitive (middle left); 3. fusion at neuron synapse in which the vesicles are stained with pH-sensitive membrane protein (middle right); 4. fusion of a single moving granule (right).
Fig. 2
Fig. 2. Overview of random burst event detection algorithm and simulation analysis.
a Algorithm flowchart. Xi denotes the image sequence. ΔIF and ΔIB are the forward and backward subtraction images (ΔI). Δμi, σi, Ci and ti are the event Ei mean intensity, FWHM, center coordinate and the time for which Ei was detected, respectively. Δμ and σ are the automated parameters for detection. θ, R and T denote the detection sensitivity, a search radius of three pixels, and a time interval of four frames, respectively. Image patches are the 32 × 32 pixels crops extracted over time for each selected region. The network scheme is an encoder-vision-transformer network (eViT). The center of mass step refines the centroid of each true positive event. The final step applies a Gaussian spatiotemporal function used for non-maximum suppression. b Effect of Poisson noise added to simulated videos. Left: simulated video with Poisson noise scaling factor λ = 0.1 with an ideal exocytosis event in a cytotoxic T-lymphocyte. Middle: same video with λ = 1. Right: same video with λ equal 10 times the signal. c Graph in the middle presents the evaluation of our eViT performance following the analysis of simulated videos with a noise scaling factor that varied between 0.1 and 10. The graph shows the average recall (blue), precision (orange), and F1 score values (yellow) with SEM (n = 5). d 3D ellipsoid representing the Gaussian spatiotemporal search equation g(xj,yj,tj) for event Ej. The color bar ranging from 0 to 1 corresponds to the mean gray value at point (x, y, t). Point A and B are two true positive events occurring close in time and space to Ej. At point A the mean gray value at (xA,yA,tA) exceeds g(xj,yj,tj), indicating that A is a separate event. While, at point B the mean gray value at (xB,yB,tB) is below g(xj,yj,tj), meaning Ej= B. Source data are provided as a Source Data file.
Fig. 3
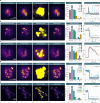
Fig. 3. Random burst event analysis.
Detection process compared to the human expert (HE) displayed from left to right; ROIs are shown as an overlay. Panel (ae) from left to right, the first column shows TIRF-microscopy raw images of cytotoxic T cells, chromaffin cells, and INS-1 cells. The second column shows ROIs of the detected events by HE. The third column shows the raw images with all the selected regions prior to classification. The fourth column shows the classified events by our eViT network using the model indicated above. Bar graphs displays: total number of events identified by HE (purple), selected regions (SR, gray), events classified by eViT (blue), LSTM (green), and ExoJ (orange). The line plot column shows fluorescence intensity profiles of the true positive events detected by IVEA. The events profiles are aligned to their respective detection times. The fluorescence peaks at 2 sec corresponds to the exocytosis of the detected events. a CTL expressing pH-sensitive granzyme B-pHuji with thirteen movies of individual cells were analyzed (ncell = 13). b CTL expressing pH-insensitive granzyme B-tdTomato. Seven videos, each containing 1–11 cells, were analyzed (ncell = 33). c Shown are CTLs transfected with CD63-pHuji. The analysis was performed on five of the same type of movie and one movie of HeLa cell expressing CD9-SEP found in Zenodo. d Chromaffin cells expressing NPY-mCherry (pH-insensitive fluorescent protein). Five videos were analyzed and pooled with five videos of INS-1 cells expressing NPY-mCherry (ncell = 10). e INS-1 cells expressing NPY-mNeonGreen. Nine videos of individual INS-1 cells expressing NPY-mGFP or NPY-mNeonGreen were pooled (both weakly pH-sensitive yet displays distinct cloud release) (ncell = 9). INS-1 cell videos were acquired at the Medical Cell Biology, Uppsala University, Sweden. The exocytosis-stimulation protocol is provided in the Methods section (acquisition protocol). Source data are provided as a Source Data file.
Fig. 4
Fig. 4. Detection and analysis of exocytosis in neurons with stationary burst event algorithm.
a This panel displays the stationary burst event algorithm flowchart. Defining parameters: Xi denotes the raw images; ΔIF is the forward-subtracted image. Δμi, σi, Ci and ti are the event Ei mean gray value, full width at half maximum (FWHM), center coordinate, and event occurrence time; Δμ and σ are the mean gray values and FWHM thresholds. θ, R and T denote the detection sensitivity, search radius and the event time-interval, respectively. Tns,f,t represents the extracted data in 3D tensor form. b Left, raw image of dorsal root ganglion (DRG) neurons over-expressing SypHy forming synapses on spinal cord neurons. Exocytosis stimulation protocol is given in the Methods under acquisition protocol. Right, depicts the area within the dashed gray box on the raw image overlaid with four different ROIs. Displayed, from left to right, top to bottom, are the human expert (HE) ROIs, the selected regions (SR) ROIs, the neural network ROIs, and a composite overlay of HE (Magenta) with neural network (Yellow) ROIs. c Bar graph representing the total number of events analyzed in 11 DRG neurons videos. IVEA parameters for the analysis were set to default. d Overall mean intensity profile of the combined ROI areas, comparing different event types shown in different colors as indicated. e Mean intensity profile over time representing the events detected at the stimulation time (synchronized events, left), and before or after stimulation (non-synchronized, right). f Mean intensity profile for short event category, whether synchronized or non-synchronized. The event intensity profiles are aligned on their respective detection time (e & f). Colored lines represent different events, while the thick black line shows their average. Source data are provided as a Source Data file.
Fig. 5
Fig. 5. Overview of the sensor-based exocytosis detection algorithm.
a Algorithm flowchart of DART. b Algorithm flowchart of IVEA hotspots area extraction. IVEA employs three new methods compared with DART. These include parameter automation, multilayer intensity correction (MIC) (see Supplementary Fig. 12), and temporal tracking. c Detection process displays (left to right): raw image; hotspot mask (two hotspots); intensity variation image where hotspots are evident; iterative threshold steps over a cropped region of the intensity variation image; and the segmented image used to determine the events ROIs. d Event activity (left to right): raw image of dopaminergic neuron; intensity variation composite with the raw image; sequence of zoomed snapshots that display the hotspot over time. e Graph representing the intensity variation over time for ROI’s mean intensity of the original image sequence (I(e), blue line) and for the intensity variation processed image sequence (ΔIi(e), red line). The right-hand graph magnifies I(e) around the hotspot occurrence window. It displays the temporal intensity tracking period. f Images comparing IVEA hotspot area extraction with DART. The yellow ROIs denotes the hotspot; red ROIs indicates probably false hotspots; and the cyan ROIs are true hotspots detected by one algorithm but not by the other. This figure displays images from two representative videos out of 8.

References

    1. Slavík, J. Fluorescent probes. In: Fluorescence Microscopy and Fluorescent Probes (ed Slavík J.) (Springer US, 1996).
    1. Shroff, H., Testa, I., Jug, F. & Manley, S. Live-cell imaging powered by computation. Nat. Rev. Mol. Cell Biol.25, 443–463 (2024). - PubMed
    1. Govindaraju, R., Govindaraju, S., Yun, K. & Kim, J. Fluorescent-based neurotransmitter sensors: present and future perspectives. Biosensors (Basel)13, 1008 (2023). - PMC - PubMed
    1. Chang, H. F., Schirra, C., Pattu, V., Krause, E. & Becherer, U. Lytic granule exocytosis at immune synapses: lessons from neuronal synapses. Front. Immunol.14, 1177670 (2023). - PMC - PubMed
    1. Becherer, U. et al. Regulated exocytosis in chromaffin cells and cytotoxic T lymphocytes: how similar are they? Cell Calcium52, 303–312 (2012). - PubMed

Substances

LinkOut - more resources