. 2025 Jul 12;16(1):6451.
doi: 10.1038/s41467-025-61448-z.

Androgen receptor promotes arachidonic acid metabolism and angiogenic microenvironment in AFP-negative hepatocellular carcinoma

Affiliations

Androgen receptor promotes arachidonic acid metabolism and angiogenic microenvironment in AFP-negative hepatocellular carcinoma

Zhilong Lin et al. Nat Commun. .

Abstract

Alpha-fetoprotein (AFP) is a classic biomarker for hepatocellular carcinoma (HCC). AFP-positive HCC (AFP+ HCC) has been intensively investigated; however, the genomic, transcriptomic and microenvironmental characteristics of AFP-negative HCC (AFP- HCC) remain to be deciphered. Here we show that tumors display mild differences in genetic alterations between AFP- HCC and AFP+ HCC patients, while AFP- HCC exhibits hyperactive arachidonic acid metabolism. Furthermore, the transcription activity of androgen receptor (AR) is significantly increased in AFP- HCC and plays a positive regulatory role in arachidonic acid metabolism and its metabolite 11,12-epoxyeicosatrienoic acid (11,12-EET). The tumor-derived 11,12-EET exhibits high affinity for EGFR that promotes the migration and tube formation of endothelial cells in vitro. Combination of lenvatinib and bicalutamide (an AR antagonist) enhances the therapeutic efficacy for AFP- HCC. Overall, we uncover the AR-mediated hyperactive arachidonic acid metabolism in AFP- HCC, and reveal AR-11,12-EET-EGFR axis-induced angiogenesis, providing a promising strategy of combined AR antagonist with lenvatinib for AFP- HCC treatment.


Conflict of interest statement

Competing interests: The authors declare no competing interests.

Figures

Fig. 1
Fig. 1. Profiling of genetic alteration and cell diversity in HCC.
a Schematic overview of the research. The numbers of patients and multiple experimental validation methods are provided. The lipidomics datasets (n = 34) comprise two subsets: tumor tissue lipidomics (n = 14) and blood plasma lipidomics (n = 20). b Genetic profiles and associated clinical features of all 157 HCC patients with WES data. The top panel shows mutation numbers followed by clinicopathological features. The middle panel exhibits significantly mutated genes calculated through MutSigCV. The bottom panel shows the CNV profiles of top chromosomal lesions with the most significant q values. Different alteration types and clinical features are signified with different color codes. Significance of these variables between AFP HCC and AFP+ HCC was calculated by chi-square test or Fisher’s exact test, which was provided in Supplementary Data 1. c The UMAP visualization of 47 cell types from scRNA-seq data. d Scatter plot showing positive correlation between serum AFP level and transcriptomic AFP expression in scRNA-seq (left panel) and bulk RNA-seq (right panel) data of FAH-SYSU cohort. Transcriptomic AFP expression in scRNA-seq data was calculated as the average expression across tumor cells per sample. R indicates the correlation coefficient calculated by Spearman correlation test. The number of dots indicates the number of patients. e Representative images of IHC staining in FFPE tissues (left panel) and protein expression of AFP in AFP HCC and AFP+ HCC (right panel). The number of dots indicates the number of patients. Scale bars, 50 μm. Data were shown as mean ± SD. **p < 0.01 by two-sided t-test. f Scatter plot showing positive correlation between proteinic AFP expression and available transcriptomic AFP expression. R indicates the correlation coefficient calculated by Spearman correlation test. The number of dots indicates the number of patients. Source data are provided as a Source Data file.
Fig. 2
Fig. 2. Transcriptomic differences of tumor cells between AFP HCC and AFP+ HCC.
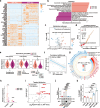
a Differentially expressed genes (DEGs) calculated from scRNA-seq data between AFP HCC and AFP+ HCC. b Pathways enriched in tumor cells in AFP HCC and AFP+ HCC from scRNA-seq data by GSEA. The p-values, calculated by permutation test, of all listed pathways were less than 0.05. c The volcano plot from scRNA-seq data manifested differentially metabolic activity of tumor cells in AFP HCC when compared to AFP+ HCC. The color and dot size correspond to the log2FC in metabolic activity between AFP HCC and AFP+ HCC. d Correlation analysis between metabolic pathways and transcriptomic AFP expression in scRNA-seq data by Spearman correlation test. e Metabolic pathway diagram of arachidonic acid metabolism and gene signature scores of three branches in arachidonic acid metabolism. Box plot depicts the median and interquartile range, and the lower and upper hinges denote the 25–75% interquartile range (IQR), with whiskers extending up to a maximum of 1.5 times IQR. f Scatter plot showing negative correlation between transcriptomic AFP expression and CYP gene signature in scRNA-seq data by Spearman correlation test. g The heatmap of genes involved in arachidonic acid metabolism in AFP HCC and AFP+ HCC, colored by average expression value. h Relative expression of CYP2C8/CYP1B1 detected by RT-qPCR in tumor tissues from 15 AFP HCC and 15 AFP+ HCC patients. Data were shown as mean ± SD. i The volcano plot shows metabolites detected by targeted lipidomics. The abbreviations ARA and DTA stand for arachidonic acid and docosatetraenoic acid, respectively. j The expression levels of AFP were detected by RT-qPCR and western blot in HCC cell lines. k ELISA analysis revealed elevated levels of 11,12-EET in the CM derived from AFPlow cell lines compared to AFPhigh cell lines. Data were shown as mean ± SD. *p < 0.05, **p < 0.01, ***p < 0.001 by Wilcoxon rank sum test in (e, g, i), two-sided t-test in (h) and one-way ANOVA with Tukey’s multiple comparisons test (j, k). Source data are provided as a Source Data file.
Fig. 3
Fig. 3. Upregulation of AR transcription activity in AFP HCC tumor cells.
a SCENIC analysis in scRNA-seq data shows TF activities in AFP HCC and AFP+ HCC tumor cells. b Spearman correlation analysis between activity of TFs listed in (a), and AFP expression (colored in blue) as well as CYP genes signature (colored in red) in tumor cells. c Detection of AR expression using IHC in AFP HCC (n = 10) and AFP+ HCC (n = 10). Scale bars, 50 μm. d Correlation between AFP and AR expression by Spearman correlation test (n = 20). e Relative expression of AR detected by RT-qPCR (AFP HCC vs. AFP+ HCC = 15:15). f AR expression in AFP HCC compared to AFP+ HCC, as determined by bulk RNA-seq data from FAH-SYSU (AFP HCC vs. AFP+ HCC = 161:273) and TCGA-LIHC cohort (AFP HCC vs. AFP+ HCC = 142:127). g Concentrations of testosterone and 5α-DHT detected by lipidomics using blood plasma from 10 AFP/AFP+ HCC. h Relative expression of AR detected by RT-qPCR and western blot in HCC cells. i Relative concentration of 11,12-EET detected by ELISA assays in CM from HCC cells. j Relative expression of CYP2C8 and CYP1B1 with or without 5α-DHT stimulation. k Validation of the AR knockdown (shAR) in MHCC97H and HCCLM3 using western blot. l 11,12-EET concentrations detected by ELISA assays in CM from MHCC97H and HCCLM3 cells (shNC) compared to their shAR counterparts. m Detection of 11,12-EET levels in AR-overexpressing Hepa1-6 cells (oeAr) versus control cells (oeNC). Validation of AR binding with CYP2C8 and CYP1B1 promoters by ChIP-PCR (n) and ChIP-qPCR (o) in MHCC97H and HCCLM3. p Normalized snATAC-seq tracks of AFP, AR, CYP2C8 and CYP1B1. Three biological replicates were employed (hj, l, m, o). Data were shown as mean ± SD (c, gj, l, m, o). *p < 0.05, **p < 0.01, ***p < 0.001 and ns stands for no significance by Wilcoxon rank sum test (f, g), two-sided t-test in (c, e, i, j, m) and one-way ANOVA with Tukey’s multiple comparisons test (h, l, o). Source data are provided as a Source Data file.
Fig. 4
Fig. 4. Enrichment of endothelial cells in AFP HCC.
a Cell proportion analysis of each cell cluster between AFP HCC and AFP+ HCC patients, as shown by boxplots and pie charts. P values are displayed only for cell types with significant differences between the two groups (AFP HCC vs. AFP+ HCC = 6:11). b Endothelial cell proportion deconvoluted by xCell using bulk RNA-seq from FAH-SYSU cohort (AFP HCC vs. AFP+ HCC = 161:273) and TCGA-LIHC cohort (AFP HCC vs. AFP+ HCC = 142:127), which showed higher infiltration of endothelial cells in AFP HCC. c Representative images of IHC staining in FFPE tissues (left panel) and microvascular density quantification (right panel) in AFP HCC and AFP+ HCC. The number of dots indicates the number of patients (AFP HCC vs. AFP+ HCC = 10:10). Data were shown as mean ± SD. Scale bars, 50 μm. d The UMAP visualization of four subtypes of endothelial cells (upper panel) and corresponding tissue distribution (lower panel). e Marker gene expression for endothelial cells. f Pathway enrichment analysis for endothelial cells using GO-BP gene sets. g Functional scoring of endothelial cell phenotypes based on tip-like and stalk-like gene signatures. *p < 0.05, **p < 0.01, ***p < 0.001, and ns stands for not significant by Wilcoxon rank sum test in (a, b), two-sided t-test in (c) and Wilcoxon rank sum test with FDR correction (g). Source data are provided as a Source Data file.
Fig. 5
Fig. 5. Activation of EGFR with AR-induced 11,12-EET from AFP HCC tumor cells promoted aberrant angiogenesis.
a Scatter plot showing positive correlation between proteinic nuclear AR expression and proteinic CD31 expression. R indicates the correlation coefficient calculated by Spearman correlation test. The number of dots indicates the number of patients. b Sensorgrams for detecting the binding affinity of 11,12-EET and EGFR using SPR assay. c Representative images (left panel) and quantitative analysis (right panel) demonstrating the pro-angiogenic effects of 11,12-EET on HUVEC migration and tube formation compared to non-11,12-EET treatment group (NC). A total of three biological replicates were employed. Data were shown as mean ± SD. d Protein expression of VEGFR2, phosphorylated VEGFR2 (p-VEGFR2), EGFR2 and phosphorylated EGFR2 (p-EGFR2) in HUVECs when co-cultured with 11,12-EET compared to non-11,12-EET treatment group (NC). Representative images (left panel) and corresponding statistical results (right panel) of migration (e) and tube formation (f) of HUVECs when co-cultured with the CM from shNC and shAR cell lines, including MHCC97H and HCCLM3, respectively. A total of three biological replicates were employed. Data were shown as mean ± SD. g Representative images (left panel) and quantitative analysis (right panel) of migration and tube formation of HUVECs when co-cultured with CM from MHCC97H. The MHCC97H cells were pre-treated with 10 nM 5α-DHT for 48 h, followed by separate treatments with either 6 μM lenvatinib, 10 μM gefitinib, 20 μM gefitinib or vehicle control for 24 h. A total of three biological replicates were employed. Data were shown as mean ± SD. Scale bars, 100 μm. *p < 0.05, **p < 0.01, ***p < 0.001 and ns stands for no significance by two-sided t-test in (c) and one-way ANOVA with Tukey’s multiple comparisons test (eg). Source data are provided as a Source Data file.
Fig. 6
Fig. 6. Modulation of AR in tumorigenesis and vascularization in vivo.
a Experimental design using NCG mice (n = 6 per group). Representative images of tumors (b), tumor growth curve (c), tumor volume measurements (d) and tumor weight measurements (e) in MHCC97H subcutaneous HCC mouse models (shNC vs. shAR = 6:6). Representative images of tumors (f), tumor growth curve (g), tumor volume measurements (h) and tumor weight measurements (i) in Huh7 subcutaneous HCC mouse models (oeNC vs. oeAR = 6:6). j Relative concentrations of 11,12-EET measured by ELISA assays in MHCC97H and Huh7 subcutaneous HCC tumors, and their corresponding shAR and oeAR counterparts (n = 6 per group), respectively. Flow cytometry analysis of CD45-CD31+EGFR+ endothelial cell (EC) fractions in MHCC97H (k) and Huh7 (l) subcutaneous HCC tumors (n = 6 per group). m Experimental design using C57BL/6 mice (n = 6 per group). Representative images of tumors (n), tumor growth curve (o), tumor volume measurements (p) and tumor weight measurements (q) in RIL-175 subcutaneous HCC mouse models (shNC vs. shAr = 6:6). Representative images of tumors (r), tumor growth curve (s), tumor volume measurements (t) and tumor weight measurements (u) from Hepa1-6 subcutaneous HCC mouse models (oeNC vs. oeAr = 6:6). v Relative concentration of 11,12-EET detected by ELISA kit in RIL-175 and Hepa1-6 subcutaneous HCC tumors, and their corresponding shAr and oeAr counterpart (n = 6 per group), respectively. Flow cytometry analysis of EGFR+ ECs fractions in RIL-175 (w) and Hepa1-6 (x) subcutaneous HCC tumors (n = 6 per group). Data were shown as mean ± SD. *p < 0.05, **p < 0.01, ***p < 0.001 by two-way ANOVA in (c, g, o, s) and two-sided t-test in (d, e, hl, pq, tx). Source data are provided as a Source Data file.
Fig. 7
Fig. 7. Combined inhibition of AR-mediated anti-angiogenesis with lenvatinib repressed tumor progression in AFP HCC in vivo.
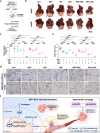
a Schematic of the experimental design using NCG mice (n = 5 per group). Representative gross images of MHCC97H orthotopic tumors (b) and statistical analysis of tumor volume (c). The “+” indicates treatment with gefitinib (GEF), bicalutamide (BIC) or lenvatinib (LEN), while the “–” indicates treatment with vehicle control (n = 5 per group). Data were shown as mean ± SD. d, e Representative images of IHC staining (left panel) and microvascular density quantification (right panel) in MHCC97H orthotopic tumors across different treatment groups (n = 5 per group). Data were shown as mean ± SD. f A graphical summary. In AFP HCC patients, TF activity of AR was elevated and promoted the expression levels of CYP2C8 and CYP1B1, which enhanced arachidonic acid metabolism and the production of the downstream metabolite 11,12-EET. The 11,12-EET metabolite activated EGFR on endothelial cells, thereby promoting angiogenesis. Targeting this pathway, a combination of AR antagonists with lenvatinib might represent a promising therapeutic strategy for AFP HCC. Scale bars, 50 μm. *p < 0.05, **p < 0.01, ***p < 0.001, and ns stands for no significance by one-way ANOVA with Tukey’s multiple comparisons test (c, e). Source data are provided as a Source Data file.

References

    1. Rumgay, H. et al. Global burden of primary liver cancer in 2020 and predictions to 2040. J. Hepatol.77, 1598–1606 (2022). - PMC - PubMed
    1. Devarbhavi, H. et al. Global burden of liver disease: 2023 update. J. Hepatol.79, 516–537 (2023). - PubMed
    1. Llovet, J. M. et al. Hepatocellular carcinoma. Nat. Rev. Dis. Prim.7, 6 (2021). - PubMed
    1. Wang, T. & Zhang, K. H. New blood biomarkers for the diagnosis of AFP-negative hepatocellular carcinoma. Front Oncol.10, 1316 (2020). - PMC - PubMed
    1. Zong, J., Fan, Z. & Zhang, Y. Serum tumor markers for early diagnosis of primary hepatocellular carcinoma. J. Hepatocell. Carcinoma7, 413–422 (2020). - PMC - PubMed

MeSH terms