. 2025 Jul 12;16(1):6461.
doi: 10.1038/s41467-025-61730-0.

Notch activity is modulated by the aGPCR Latrophilin binding the DSL ligand in C. elegans

Affiliations

Notch activity is modulated by the aGPCR Latrophilin binding the DSL ligand in C. elegans

Willem Berend Post et al. Nat Commun. .

Abstract

The Notch pathway is a highly conserved signaling cascade across metazoans that regulates numerous physiological processes, including cell proliferation, differentiation, and fate determination. Given its fundamental roles, the pathway is tightly regulated by diverse molecules through multiple mechanisms. Here, we identify the Adhesion GPCR latrophilin (LPHN/ADGRL) as a positive modulator of Notch signaling, which increases Notch receptor activation and the translocation of its intracellular domain into the nucleus. Physiologically, this latrophilin role is crucial for balancing the number of proliferating cells in the gonadal stem cell niche of the nematode C. elegans. In silico, in vitro, and in vivo analyses demonstrate that the C. elegans latrophilin homolog LAT-1 directly interacts with the DSL protein/Notch ligand LAG-2 on the same cell. This interaction is mediated by LAT-1's conserved GAIN and the RBL domain. Importantly, the modulatory effect depends solely on the receptor's N terminus and is independent of G protein signaling. Finally, we explore the implications of this fine-tuning of Notch signaling by an aGPCR.


Conflict of interest statement

Competing interests: The authors declare no competing interests.

Figures

Fig. 1
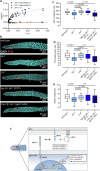
Fig. 1. Nematodes lacking lat-1 display a reduction in germ cells.
a Schematic depiction of the adult C. elegans gonad. The nematode has two symmetrical U-shaped gonads where oocytes are produced during adulthood. The most distal part of each gonad arm, the progenitor zone, is encased by the distal tip cell (DTC). Within this zone, germ cells undergo continuous self-renewal through mitotic divisions. Subsequently, they enter meiosis in the transition zone, where they arrest in the pachytene before cellularizing, growing, and progressing further through meiotic development. Eventually, the oocytes are pushed through the spermatheca, where sperm, produced during the last larval stage, is stored. After fertilization, the eggs move to the uterus and are laid. b Hermaphrodite gonads lacking LAT-1 display altered germ cell zone sizes. Shown are two representative images of gonads of L4 + 8 h-old hermaphrodites. Asterisks: DTC; dashed lines: zones (c) Quantification of germ cell numbers in (b) reveals shorter zones in lat-1 worms. Wild-type: n = 33, lat-1: n = 19 in four independent experiments. d Expression of mNeonGreen-fused rec-8 ceases in more distal germ cell rows in lat-1 individuals compared to wild-type controls. Asterisks: DTC; dashed lines: end of progenitor zone. e Quantification of REC-8-positive cells per cell row shown in (d) confirms the shorter progenitor zone and thus, the earlier change in the transition from progenitor (REC-8-positive cells) to meiotic (REC-8-negative cells) fate in lat-1 mutant germlines. Wild-type: n = 23, lat-1: n = 18 in four independent experiments. Exact p values are provided in the Source Data. f Representative images of PH3-stained gonads of 8 h-post-L4 lat−1 and wild-type individuals. Asterisks: DTC; dashed lines: end of progenitor zone. g PH3-stained germlines from (f) reveal a lower incidence of M phase nuclei in the progenitor zone of lat-1 compared to wild-type gonads. Wild-type: n = 44, lat-1: n = 38 in six independent experiments. h lat-1 mutant germlines have a decreased M index (percentage PH3-positive nuclei from all progenitor zone nuclei). Wild-type: n = 44, lat-1: n = 38 in six independent experiments. i EdU-stained gonads 8 h-post-L4 worms visualize S phase nuclei. Asterisks: DTC; dashed lines: end of progenitor zone. j Quantification of images from (i) demonstrates that the distal germline of lat-1 hermaphrodites has more EdU-positive (S phase) nuclei than wild-type controls. Wild-type: n = 34, lat-1: n = 26 in 6 independent experiments. k Quantification of S indices based on images from (i). lat-1 germlines have a decreased S index (percentage of EdU-positive nuclei from all progenitor zone nuclei). Wild-type: n = 34, lat-1: n = 26 in six independent experiments. Graph raw data are provided in the Source Data. Graph details and statistics are: (c), (g), (h), (j), (k): Box plots with median (center), interquartal range, 5th (lower whisker) and 95th (upper whisker) percentiles. e: Mean ± SEM. Two-sided unpaired t-test without multiple comparison correction.
Fig. 2
Fig. 2. LAT-1 modulates Notch signaling in the distal gonad.
a In the distal gonad, the Notch pathway controls cell proliferation and the switch between germ cell division and differentiation. It is initiated by the Notch ligand LAG-2 on the distal tip cell (DTC) binding to the Notch receptor GLP-1 present on germ cell membranes. This causes the Notch intracellular domain (NICD) to be cleaved off to translocate to the nucleus, initiating together with LAG-1 and LAG-3 the transcription of downstream effectors such as LST-1 and SYGL-1. In turn, these effectors repress expression of e.g., gld-1-3. b Expression of gld-1 occurs more distally in lat-1 mutant (bottom) than in wild-type (top) L4 + 8 h gonads. Asterisks: DTC, dashed lines: end of the progenitor zone. c Quantification of gld-1::GFP expression/germ cell row in lat-1 and wild-type gonads by measuring fluorescence intensity with increasing distance from the distal tip cell based on images from (b). Loss of lat-1 leads to a reduced repression of gld-1. Wild-type: n = 17, lat-1: n = 22 in four independent experiments. de Comparison of progenitor zones of Notch pathway component single mutants (lag-2(q420), glp-1(bn18)) and respective double mutants with lat-1(ok1465). Analyses are based on DAPI-/PH3-stained dissected gonads to visualize all and specifically M phase nuclei (for images see Supplementary Fig. 2a). The progenitor zone sizes in the double mutants differ from those in lat-1 single mutants, but are similar to the respective Notch component single mutants (d). Overall, no differences in PH3-positive germ cell number were observed in single compared to double mutants (e). Replicate values: wild-type: 44, lat-1: 38, lag-2: 42, lat-1; lag-2: 36, glp-1: 41, lat-1; glp-1: 46 gonads in 6 independent experiments. f Notch activation was visualized using the GLP-1 NICD::V5 reporter glp-1(q1000[glp-1::4xV5]. In lat-1 germline nuclei of L4 + 8 h-old hermaphrodites, less NICD is present than in the wild-type (red arrowheads) which is ameliorated by the presence of the LNT. The lag-2(q420) mutant (positive control) shows severely reduced NICD in cell nuclei. asterisks: DTC. g Quantification of the NICD fraction located in germ cell nuclei based on images in (f) confirms the reduced activity of Notch in lat-1 mutants. Replicate values (independent experiments): wild-type: 33 (5), lat-1: 33 (3), lag-2: 21 (4), LNT: 16 (3). h DIC images showing anus morphology defects in L1 nematodes, which occurs both in lat-1 and lag-2 mutants. i Quantification of the images from (h). Wild-type: 127, lag-2: 122, lat-1: 167, lat-1; lag-2: 86 in three independent experiments. j lat-1 mutant nematodes exhibit a similar delayed reversal upon exposure to octanol as lag-2 mutants. Replicate values (independent experiments): wild-type: 75 (5), osm-11: 45 (3), lat-1: 75 (6), lag-2: 45 (3), lat-1, lag-2: 45 (3). Graph raw data are provided in the Source Data. Graph details and statistics are: (c): Mean gld-1::GFP expression/germ cell row ± SEM (replicates and exact p values in the Source Data). Two-sided unpaired t-test without multiple comparison correction. (d), (e), (g), (i), (j): Box plots with median (center), interquartal range, 5th (lower whisker) and 95th (upper whisker) percentiles. One-way ANOVA with Bonferroni post-hoc test. (i): Mean ± SEM. One-way ANOVA with Bonferroni post-hoc test.
Fig. 3
Fig. 3. LAT-1 interacts with the Notch ligand LAG-2 in silico and in vitro.
a AlphaFold2 Multimer models suggest an interaction between the extracellular region of LAG-2 (blue, surface representation) and both the RBL (yellow, cartoon representation) and GAIN (cyan, cartoon representation) domains of LAT-1. The interacting regions in LAT-1 include the main protruding loop of the RBL domain and a stretch of the GAIN domain. The HRM domain (gray, cartoon representation) is not involved in binding. Interacting residues are shown as stick representation. Details on energy breakdown values calculated using Rosetta’s per_residue_energies application are given in Supplementary Fig. 4. b Location of the residues within RBL and GAIN domain of LAT-1 identified by models and energetic breakdown analyses (Supplementary Fig. 4) to be candidates to mediate the binding to LAG-2. c Nano Bioluminescence Resonance Energy Transfer (NanoBRET) analyses show an interaction of LAT-1 (Venus::LAT-1) with LAG-2 (Nluc::LAG-2) in HEK293 cells. The human GLP1R fused to Venus served as negative control. Note that higher BRET50 values correspond to low binding affinity. Introduction of distinct point mutations in single domains predicted to be essential for the interaction (identified in (a–c)) do not significantly reduce affinity of LAT-1 for LAG-2, however, affinity is decreased when mutations in RBL and GAIN domain are combined. Mean ± SEM, n = 4 technical replicates in 11 (LAT-1), 8 (hGLP1R), 4 (LAT-1 (RBLmut)), 4 (LAT-1 (GAINmut)), 10 (LAT-1 (RBLmut GAINmut)) independent experiments. One-way ANOVA with Bonferroni post-hoc test. Corresponding netBRET values and curves are shown in Supplementary Fig. 7b.
Fig. 4
Fig. 4. LAT-1 binds to LAG-2 in vivo.
a, b, e Bimolecular fluorescence complementation (BiFC) analyses using the two parts of a split Venus protein (VN/VC) fused each to a protein of interest in C. elegans. Expression of these constructs is driven by the heat-shock promoter hsp16.41p. Upon heat shock, the proteins are produced, and a fluorescent signal occurs if they interact as the split Venus protein parts get into proximity, reconstitute, and fluoresce. For signal monitoring, the pharynx was chosen as the heat-shock promoter is highly active in pharyngeal neurons. a LAG-2 binds to GLP-1 yielding a clear fluorescence signal after heat shock (I). Co-expression of VN::lat-1 and VC::glp-1 shows a very minor fluorescence signal, indicating that they do not interact (II). A strain harboring VN::lat-1 and VC::lag-2 together shows fluorescence after heat shock, indicating binding of the two (III). Shown are representative images of 22 (LAG-2; GLP-1), 35 (GLP-1; LAT-1) and 75 (LAT-1; LAG-2) heat-shocked worms. b Competition BiFC assay. In the strain expressing VN::lat-1 and VC::lag-2 (employed in (a) III), varying amounts of a construct containing an untagged lag-2 serving as a competitor were introduced. Nematodes stably carrying all three constructs were heat-shocked, and fluorescence was measured. Hermaphrodites with 50-fold excess of untagged lag-2 competitor relative to VC::lag-2 (1 ng VC::lag-2/ 50 ng untagged lag-2) displayed severely less fluorescence. This indicates that LAT-1 interacts with the untagged LAG-2, which competes with VC::LAG-2. Shown are exemplary images. c Quantification of the competition BiFC assay from images shown in (b). Fluorescence significantly decreases with increasing amounts of untagged lag-2 asa competitor. Four nematode lines carrying fixed amounts of VN::lat-1 (1 ng) and VC::lag-2 (1 ng) together with no competitor (same line as in (a) III), 5-fold (5 ng), 10-fold (10 ng), and 50-fold (50 ng) competitor, respectively, were used. To always maintain the same total amount of DNA, pBluescript was supplemented. Replicate values (independent experiments): no competitor: 75 (8), 5-fold: 17 (3), 10-fold: 21 (3), 50-fold: 24 (3). d Western Blot analysis confirms the expression of lat-1 (V5-tagged, 81 kDa (autocatalytically cleaved)), lag-2 (HA-tagged, 57 kDa), and mutated lat-1(RBLmut GAINmut) (V5-tagged, 81 kDa (autocatalytically cleaved)) on protein level in worm lines after heat shock and shows that the point mutations in LAT-1 do not hamper expression. Black arrowheads indicate the lines studied further in (e), (f). Actin served as a loading control. For full Western blots, see Supplementary Fig. 7e. Western Blot was performed twice with 60-80 worms per sample. e Exemplary images of BiFC using VC::LAG-2 and LAT-1(RBLmut GAINmut)::VN showing less fluorescence than in combination with a wild-type VN::LAT-1. f BiFC analysis using VC::LAG-2 in combination with VN::LAT-1 carrying the 12 point mutations of residues within the RBL/GAIN domains potentially essential for LAG-2 binding (Fig. 3b). Worm lines selected based on similar LAG-2, LAT-1, and LAT−1(RBLmut GAINmut) protein levels (d, black arrowheads) were tested. The mutations lead to significantly reduced fluorescence levels compared to wild-type LAT-1. Replicate values (independent experiments): LAT-1: 26 (4), LAT-1 (RBLmut GAINmut): 17 (3). Graph raw data are provided in the Source Data. Graph details and statistics are: (c), (f): Box plots with median (center), interquartal range, 5th (lower whisker) and 95th (upper whisker) percentiles. One-way ANOVA with Bonferroni post-hoc test (c). Two-sided unpaired t-test without multiple comparison correction (f).
Fig. 5
Fig. 5. LAT-1 elicits its effect on germ cells from the DTC.
a BRET analysis indicates that LAT-1 and LAG-2 establish their interaction on the same cell (cis) (blue line), whereas expression on opposite cells (trans) results in no measurable BRET window (red and yellow lines). n = 4 technical replicates in 2 (setup 1), 2 (setup 2) and 11 (LAT-1 cis) independent experiments. Note that the cis BRET curve is the same as in Supplementary Fig. 7b. b Representative images of gonads from L4 + 8 h-old hermaphrodites with tissue-specific expression of lat-1 in the DTC and germ cells, respectively. Only lat-1 expression in the DTC but not the germ cells resulted in a higher PH3-positive germ cell number and progenitor zone size than in lat-1 mutants, comparable to the wild-type. As a positive control, lat-1 promoter-driven LNT was used that ameliorates the reproductive defects in lat-1 mutants to wild-type levels. Asterisks: DTC, dashed lines: end of the progenitor zone. c Quantification of the progenitor zone (from images shown in (b)). Replicate values (independent experiments): wild-type: 71 (9), lat-1: 53 (12), LNT: 37 (7), lag-2p::lat-1: 46 (7), mex-5p::lat-1: 30 (8). d Quantification of PH3-positive germ cells of images shown in (b). Wild-type 71 (9), lat-1: 53 (12), LNT: 37 (7), lag-2p::lat-1: 46 (7), mex-5p::lat−1: 31 (8). e M index (percentage PH3-positive nuclei from all progenitor zone nuclei). Wild-type 71 (9), lat-1: 53 (12), LNT: 37 (7), lag-2p::lat-1: 46 (7), mex-5p::lat-1: 30 (8). Raw data of PH3-positive cell counts and the denominators for index calculations are given in the Source data. f Proposed model of LAT-1 function. LAT-1 interacts with LAG-2 on the DTC to boost GLP-1 activation in germ cells. This interaction leads to the modulation of gld-1 expression and subsequently, an increase in germ cell proliferation and the regulation of progenitor zone size. Red arrows and lines highlight steps investigated in this study. Graph raw data are provided in the Source Data. Graph details and statistics are: (a): Mean ± SD. (c), (d), (e): Box plots with median (center), interquartal range, 5th (lower whisker) and 95th (upper whisker) percentiles. One-way ANOVA with Bonferroni post-hoc test.

References

    1. Hamann, J. et al. International union of basic and clinical pharmacology. XCIV. Adhesion G protein–coupled receptors. Pharmacol. Rev.67, 338–367 (2015). - PMC - PubMed
    1. Rosa, M., Noel, T., Harris, M. & Ladds, G. Emerging roles of adhesion G protein-coupled receptors. Biochem. Soc. Trans.49, 1695–1709 (2021). - PMC - PubMed
    1. Einspahr, J. M. & Tilley, D. G. Pathophysiological impact of the adhesion G protein-coupled receptor family. Am. J. Physiol. Cell Physiol.323, C640–C647 (2022). - PMC - PubMed
    1. Bohnekamp, J. & Schöneberg, T. Cell adhesion receptor GPR133 couples to Gs protein. J. Biol. Chem.286, 41912–41916 (2011). - PMC - PubMed
    1. Gupte, J. et al. Signaling property study of adhesion G-protein-coupled receptors. FEBS Lett.586, 1214–1219 (2012). - PubMed

MeSH terms

LinkOut - more resources