. 2025 Jul 12;16(1):6463.
doi: 10.1038/s41467-025-61799-7.

Endogenous tyrosinase-catalyzed therapeutics

Affiliations

Endogenous tyrosinase-catalyzed therapeutics

Yawen You et al. Nat Commun. .

Abstract

Tyrosinase (TYR) catalyzes the two initial steps of melanin synthesis from tyrosine in various organisms. However, overproduction, accumulation, and abnormal reduction of melanin can lead to severe diseases, particularly skin diseases, which makes tyrosinase a significant endogenous target in developing therapeutics to treat melanin-associated disorders. Herein, we devise a TYR-based in situ catalytic platform that can generate drugs intracellularly through an endogenous copper-catalyzed azide-alkyne cycloaddition (CuAAC) reaction. By taking advantage of the potent catalytic activity of TYR that is mechanistically validated by ab initio molecular dynamics (AIMD) theoretical calculation and experimental catalysis performance, we develop a TYR-catalyzed in-situ formed proteolysis-targeting chimeras (PROTACs) to degrade intracellular TYR protein to decrease melanin synthesis for treating hyperpigmentation and a TYR-catalyzed in-situ activated prodrug strategy to overcome drug resistance for melanoma therapy. In male mouse models, we show that this TYR-catalyzed therapeutics could efficiently alleviate skin hyperpigmentation within 48 h as well as resensitize the drug-resistant melanoma cells to chemotherapeutics to control tumor growth. Together, we offer an integrative platform to leverage the catalytic activity of endogenous TYR to generate therapeutics through in situ bioorthogonal chemistry for treating melanin-associated skin diseases.


Conflict of interest statement

Competing interests: The authors declare no competing interests.

Figures

Fig. 1
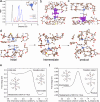
Fig. 1. TYR-catalyzed therapeutics.
a Schematic of the design of TYR-catalyzed therapeutics. Left: TYR-catalyzed in-situ clicked PROTACs to degrade TYR for treating skin hyperpigmentation. Right: TYR-catalyzed in-situ prodrug activation for treating drug-resistant melanoma. b Scheme of TYR-catalyzed fluorescent precursors (pS1 and pS2) via the CuAAC reaction. c Fluorescence spectra of pS1 + pS2, pS1 + pS2 + mTYR, and pS1 + pS2 + mTYR + SA at the concentration of 10 μM. a. u., arbitrary units. (mTYR:0.1 mg/mL). Representative confocal microscopy images of A375 (d) and B16F10 (e) cells treated with pS1 + pS2 and pS1 + pS2 + SA, respectively. (n  =  3 independent experiments). Flow cytometry assays of A375 (f) and B16F10 (g) cells treated with pS1 + pS2 and pS1 + pS2 + SA, respectively.
Fig. 2
Fig. 2. AIMD studies of the TYR-catalyzed azide-alkyne cycloaddition reaction.
a Radial distribution function of atoms between Cu-N, Cu-C and Cu-Cu atoms. Atoms are color-coded: carbon in brown, copper in blue, nitrogen in white, and oxygen in red. Charge density difference of azido (b) and ethynyl (c) binding vertically on two Cu activation sites representing the coordinative bonding interaction, respectively. d Scheme of catalytic transformation from the initial state to the intermediate to the final product. e Energy variation of TYR-catalyzed two individual azido and ethynyl molecules to an intermediate. Simulation condition: one-dimensional free energy surface from a metadynamics simulation at 298 K for 16 ps. f Energy change of reaction from intermediate to final product. Simulation condition: one-dimensional free energy surface from a metadynamics simulation at 298 K for 12 ps. Insert in (e, f) is the Lewis structure of azido and ethynyl binding to TYR at different transition states.
Fig. 3
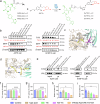
Fig. 3. TYR-catalyzed in-situ formed TYR degraders.
a Chemical structure of azido-modified VH032 ligands (VH032-Azi1, VH032-Azi2, VH032-Azi3); alkyne-modified TYR inhibitor (Alk-TIn), and click-catalyzed TYR degraders (DeTYR-1, DeTYR-2, DeTYR-3). b Western blot analysis of TYR and MITF in A375 and B16F10 cells treated with VH032, Alk-TIn, VH032 + Alk-TIn, VH032-Azi1 + Alk-TIn + SA (0.5 μM), VH032-Azi2 + Alk-TIn + SA (0.5 μM) and VH032-Azi3 + Alk-TIn + SA (0.5 μM) at the concentration of 0.1 μM for 24 h. (n  =  3 independent experiments). c Molecular dynamic simulation of TYR (wheat), Alk-TIn (yellow), VHL (cyan), and VH032-Azi3 (magenta). The distance was measured by the two linker atoms (circled in green). d Molecular dynamic simulation of DeTYR-3 (yellow) interacting with VHL (cyan) and TYR (wheat) proteins. e Co-immunoprecipitation of TYR and VHL from lysates of A375 and B16F10 cells treated with VH032-Azi3 (0.1 μM) + Alk-TIn (0.1 μM) + SA (0.5 μM) or epi-VH032-Azi3 (0.1 μM) + Alk-TIn (0.1 μM) + SA (0.5 μM) for 4 h. (n  =  3 independent experiments). TYR inhibition of blank control, kojic acid, TIn, Alk-TIn and VH032-Azi3 + Alk-TIn + SA (0.5 μM) at 0.1 μM in A375 (f) and B16F10 (g) cells, respectively. (n  =  3 biological replicates). (****P  <  0.0001). Data are presented as mean ± standard deviation (SD). Melanin content of blank control, kojic acid, TIn, Alk-TIn, and VH032-Azi3 + Alk-TIn + SA at 0.1 μM in A375 (h) (P = 0.0479) and B16F10 (i) (P = 0.0147) cells, respectively. (n  =  3 biological replicates). Data are presented as mean ± standard error (SEM). Statistical analysis was performed using ONE-WAY variance (ANOVA) by Dunnett’s multiple comparisons (*P < 0.05).
Fig. 4
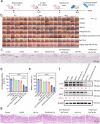
Fig. 4. Therapeutic efficacy evaluation of TYR degradation in a mouse hyperpigmentation model.
a Schematic of the experimental plan in the mouse hyperpigmentation model. b Images of square pigmentation patterns on the backs of mice treated with (1) blank control, (2) VH032, (3) Alk-TIn, (4) VH032 + Alk-TIn, (5) epi-VH032-Azi3 + Alk-TIn + SA, (6) DeTYR-3 and (7) VH032-Azi3 + Alk-TIn + SA creams at different time points (0, 24 and 48 h). c Fontana-Masson (FM) staining of melanin in mouse skin. (n  =  3 independent samples). d Normalized pigmentation level in different treatment groups by digital image analysis using Image J. (n  =  3 biological replicates). Data are presented as mean ± standard deviation (SD). ****P < 0.0001. e Melanin contents of mouse skin samples treated with different groups for 48 h. (n  =  5 biological replicates). Data are presented as mean ± standard deviation (SD). ****P  <  0.0001. f Western blot assay of TYR and MITF in mice skin samples treated with different groups for 48 h. (n  =  3 independent experiments). g H&E staining of mouse skin tissues treated with different groups for 48 h. (n  =  3 independent samples). Statistical analysis was performed using ONE-WAY variance (ANOVA) by Dunnett’s multiple comparisons.
Fig. 5
Fig. 5. TYR-catalyzed in-situ activation of anti-cancer prodrugs.
a Schematic illustration of TYR-catalyzed intracellular prodrug activation. Cytotoxicity analysis of Cd and Pd1 + Pd2 + SA treatment against DR-A375 (b) (P = 0.00024) and DR-B16F10 (c) (P = 0.00063) cells for 24 h, respectively. (n  =  3 biological replicates). Data are presented as mean ± standard error (SEM). d Flow cytometry analysis of the apoptosis of DR-A375 and DR-B16F10 cells after treatments with Cd, and Pd1 + Pd2 + SA for 24 h. High-performance liquid chromatography (HPLC) measurements of intracellular and extracellular Cd after 24 and 48 h incubation with Cd and Pd1 + Pd2 + SA in DR-A375 (e) and DR-B16F10 (f) cells. (n  =  3 biological replicates). Data are presented as mean ± standard deviation (SD). g Images of DR-A375 tumor spheres treated with Cd and Pd1 + Pd2 + SA under different concentrations for 48 h. h Average volume of DR-A375 tumor spheres at 48 h after different treatments. (n  =  3 biological replicates). Data are presented as mean ± standard error (SEM). P = 0.0061. i Images of DR-B16F10 tumor spheres treated with Cd and Pd1 + Pd2 + SA under different concentrations for 48 h. j Average volume of DR-B16F10 tumor spheres at 48 h after different treatments. (n  =  3 biological replicates). Data are presented as mean ± standard error (SEM). P = 0.0011. Statistical analysis was performed via unpaired Student’s t-test (two-tailed) (**P < 0.01, ***P < 0.001).
Fig. 6
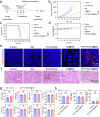
Fig. 6. Therapeutic efficacy evaluation of TYR-activated anti-cancer prodrugs in a mouse drug-resistant melanoma model.
a Experimental schedule of TYR-catalyzed intracellular prodrug activation for treating drug-resistant B16F10 melanoma on a mouse model. b Tumor growth curves of DR-B16F10 melanoma-bearing mice treated with different groups (PBS, Gel, Cd@Gel and Pd1-Pd2-SA@Gel, n = 7 mice; Pd1-Pd2-SA, n = 6 mice). Data are presented as mean ± standard error (SEM). The statistical analysis was conducted between Cd@Gel and Pd1-Pd2-SA@Gel on day 15 using two-way ANOVA followed by Dunnett’s multiple comparisons test. ****P < 0.0001. c Survival curves of the DR-B16F10-bearing mice treated with different treatment groups. Data are analyzed with the Log-rank (Mantel-Cox) test (n  =  7 mice). d Body weight changes during the treatment course (PBS, Cd@Gel and Pd1-Pd2-SA@Gel, n = 7 mice; Gel, Pd1-Pd2-SA, n = 6 mice). Data are presented as mean ± standard deviation (SD). P = 0.0002. e TUNEL staining of the tumor tissues post-treatment. (n  =  3 independent samples). f Representative images of H&E-staining of the tumor tissues post-treatment. (n  =  3 independent samples). g Complete blood count analysis of the blood from mice treated with PBS and Pd1-Pd2-SA@Gel. (WBC White Blood Cell Count, HGB Hemoglobin, RBC Red Blood Cell Count, HCT Hematocrit, MCV Mean Corpuscular Volume, PLT Platelet Count, MCH Mean Corpuscular Hemoglobin, MCHC Mean Corpuscular Hemoglobin Concentration.) (n = 6, biologically independent mice). Data are presented as mean ± standard deviation (SD). Statistical analysis was performed via unpaired Student’s t-test (two-tailed). h Liver (ALT Alanine Transaminase, AST Aspartate Transaminase) and kidney (CREA Creatinine) function analysis after PBS or Pd1-Pd2-SA@Gel treatments in mice. (n = 3 mice). Data are presented as mean ± standard deviation (SD). Statistical analysis was performed via unpaired Student’s t-test (two-tailed). (ns. not significant, ***P  <  0.001).

References

    1. Vaezi, M. Structure and inhibition mechanism of some synthetic compounds and phenolic derivatives as tyrosinase inhibitors: review and new insight. J. Biomol. Struct. Dyn.41, 4798–4810 (2023). - PubMed
    1. Pomerantz, S. H. & Li, J. P. C. Tyrosinase in the skin of albino hamsters and mice. Nature252, 241–243 (1974). - PubMed
    1. Qu, Y. et al. Catalysis-based specific detection and inhibition of tyrosinase and their application. J. Pharm. Anal.10, 414–425 (2020). - PMC - PubMed
    1. Klabunde, T., Eicken, C., Sacchettini, J. C. & Krebs, B. Crystal structure of a plant catechol oxidase containing a dicopper center. Nat. Struct. Biol.5, 1084–1090 (1998). - PubMed
    1. Walker, K. T. et al. Self-pigmenting textiles grown from cellulose-producing bacteria with engineered tyrosinase expression. Nat. Biotechnol. 43, 345–354 (2024). - PMC - PubMed

MeSH terms

LinkOut - more resources