. 2025 Jul 12;10(1):151.
doi: 10.1038/s41541-025-01207-9.

A live attenuated NS1-deficient vaccine candidate for cattle-origin influenza A (H5N1) clade 2.3.4.4.b viruses

Affiliations

A live attenuated NS1-deficient vaccine candidate for cattle-origin influenza A (H5N1) clade 2.3.4.4.b viruses

Ahmed Mostafa et al. NPJ Vaccines. .

Abstract

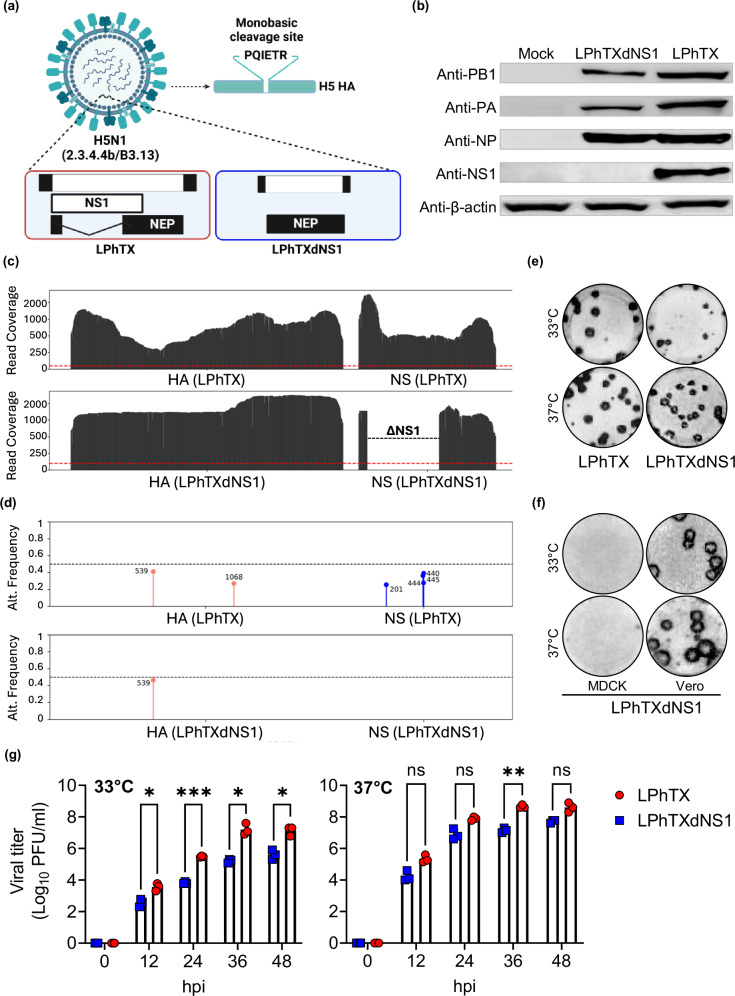
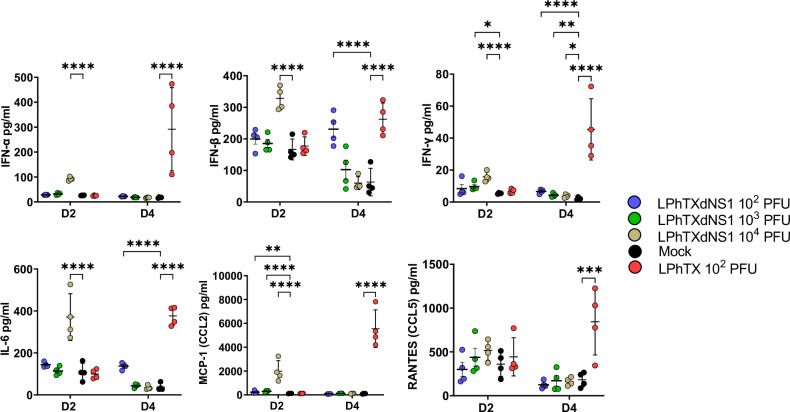
Avian Influenza viruses (AIVs) present a public health risk, especially with seasonal vaccines offering limited protection. AIV H5N1 clade 2.3.4.4b has caused a multi-state outbreaks in the United States (US) poultry and cattle since March 2024, raising pandemic concerns. We developed a nonstructural protein 1 (NS1)-deficient mutant of a low pathogenic version of the cattle-origin human influenza A/Texas/37/2024 H5N1, namely LPhTXdNS1, and assessed its safety, immunogenicity, and protection efficacy. LPhTXdNS1 is attenuated in vitro, showing reduced replication efficiency in Vero cells and inability to control IFNβ promoter activation. The LPhTXdNS1-immunized C57BL/6 J mice exhibit significantly reduced viral replication and pathogenicity compared to those infected with the low pathogenic version expressing NS1, namely LPhTX. Notably, a single intranasal dose of LPhTXdNS1 elicited protective immune responses, providing robust protection against lethal wild-type H5N1 challenge. These results demonstrate that LPhTXdNS1 is safe and able to induce protective immune responses against H5N1.


Conflict of interest statement

Competing interests: The A.G.-S. laboratory has received research support from GSK, Pfizer, Senhwa Biosciences, Kenall Manufacturing, Blade Therapeutics, Avimex, Johnson & Johnson, Dynavax, 7Hills Pharma, Pharmamar, ImmunityBio, Accurius, Nanocomposix, Hexamer, N-fold LLC, Model Medicines, Atea Pharma, Applied Biological Laboratories and Merck. A.G.-S. has consulting agreements for the following companies involving cash and/or stock: Castlevax, Amovir, Vivaldi Biosciences, Contrafect, 7Hills Pharma, Avimex, Pagoda, Accurius, Esperovax, Applied Biological Laboratories, Pharmamar, CureLab Oncology, CureLab Veterinary, Synairgen, Paratus, Pfizer and Prosetta. A.G.-S. has been an invited speaker in meeting events organized by Seqirus, Janssen, Abbott, Astrazeneca and NovavaxA.G.-S. is inventor on patents and patent applications on the use of antivirals and vaccines for the treatment and prevention of virus infections and cancer, owned by the Icahn School of Medicine at Mount Sinai, New York. All other authors declare no commercial or financial conflict of interest.

Figures

Fig. 1
Fig. 1. Generation and characterization of LPhTXdNS1.
a Schematic representation of influenza low pathogenic human A/Texas/37/2024 H5N1 (LPhTX, left) and NS1 deficient (LPhTXdNS1, right) viruses. Mutation of the multibasic cleavage site of A/Texas/37/2024 H5N1 HA (PLREKRRKR/GLF) to a monobasic cleavage site (PQIETR) that made the backbone of LPhTX and LPhTXdNS1 is indicated on the top right. b Western blot showing the lack of NS1 protein expression in LPhTXdNS1-infected, compared to LPhTX-infected Vero cells. The PB1, PA, and NP viral proteins were included as viral infection controls. β-actin was included as a loading control. c Read depth across HA and NS segments – Coverage was calculated across the HA and NS segments for the LPhTX and LPhTXdNS1. The red dotted line represents 100x read depth. The NS gene in LPhTXdNS1 contains a complete NS1 deletion. d Non-reference allele frequency - The genome of the rescued viruses was compared to the LPhTX reference to identify variant sites. SNV allele frequency from LPhTX and LPhTXdNS1 are shown with circles. Variants on the HA and NS segments are shown in red and blue respectively. Variants <25% frequency and indels caused by homopolymer runs greater than 3 nt are not shown. Allele frequencies are provided in Table 2. The red line indicates 50% allele frequency. e Plaque phenotypes of LPhTX and LPhTXdNS1 at 33 °C (top) and 37 °C (bottom) in Vero cells. Both viral stocks were titrated using immunostaining assay 24 hpi. f Plaque phenotypes of LPhTXdNS1 at 33 °C (top) and 37 °C (bottom) in MDCK (left) and Vero (right) cells by immunostaining at 48 hpi. g Growth kinetic of LPhTX and LPhTXdNS1 in Vero cells. Cell monolayers were infected at MOI = 0.001 and viral titers at 12, 24, 36 and 48 hpi were determined by plaque assay using an immunostaining assay. A two-way repeated measure ANOVA with Geisser-Greenhouse correction. Post-hoc multiple comparisons performed using Šídák method to compare groups within each time-point. The significant differences are indicated (* = p < 0.05, ** = p < 0.01, *** = p < 0.001).
Fig. 2
Fig. 2. IFNβ promoter activation by LPhTXdNS1 infection.
a Schematic representation of the IFNβ induction bioassay: MDCK cells constitutively expressing GFP-CAT and FFluc reporter genes under the control of the IFNβ promoter (MDCK IFNβ GFP-CAT/FFluc) were infected at MOI 2 with LPhTX, LPhTXdNS1, or mock-infected. At 12 hpi, IFNβ promoter activation was determined by GFP (b) and FFluc (c) expression. The viral NP in infected cells was detected with the HT103 MAb and DAPI was used for nuclear staining. The scale bar was set for 100 μm. BF: Bright-Field; GFP: Green Fluorescent Protein. All data points are shown with black lines representing the mean (n = 3). Groups compared using a Welch’s one-way ANOVA, followed by multiple comparisons using Dunnett T3 method (*** = p < 0.001; **** = p < 0.0001).
Fig. 3
Fig. 3. Pathogenicity of LPhTXdNS1.
a Experimental design including immunization schedule, the number of animals, necropsy timepoints, and sera collection timelines. b HAI antibody titers against influenza A/Texas/37/2024 H5N1 in mouse sera after immunization with 102-104 PFU of LPhTXdNS1. Serum samples were collected on weekly basis post-immunization for 4 weeks (WPI 1-4) and were tested with HAI assay to detect antibody response specific to influenza A/Texas/37/2024 H5N1. c Body weight loss of C57BL/6 J mice infected with LPhTX (102 PFU) or LPhTXdNS1 (102-104 PFU), control (Ctrl), and mock-infected mice (inoculated with 1XPBS) (n = 5). d Survival rates of C57BL/6 J mice in (a). e, f Viral replication of LPhTXdNS1 and LPhTX in the nasal turbinate (NT), lung and brain homogenates of mice at 2 (e) and 4 (f) DPI. Data are presented as mean ± SD. A mixed-effects ANOVA followed by Dunnett’s multiple comparisons test (* = p < 0.05, ** = p < 0.01, *** = p < 0.001).
Fig. 4
Fig. 4. LPhTXdNS1 induces innate immune responses in C57BL/6 J at high doses at early times post-vaccination.
Lung tissue homogenates from LPhTX- and LPhTXdNS1-infected C57BL/6 J mice were analyzed at 2 and 4 dpi for secreted cytokines (IFN-α, IFN-β, IFN-γ and IL-6 and chemokines (CCL2 and CCL5) using a 6-plex bead Luminex assay. Data is shown as Mean ± SEM with n = 4 mice/group. A two-way ANOVA with Dunnett’s multiple comparisons test was used to compare groups within each time-point. The significant differences are indicated (** = p < 0.01, *** = p < 0.001; **** = p < 0.0001).
Fig. 5
Fig. 5. H&E and IHC staining of lung and brain tissues of mice infected with LPhTXdNS1 at 4 dpi.
a H&E staining of brain (top) and lung (bottom) tissues of mock-infected and LPhTX- or LPhTXdNS1-infected mice. b Viral NP antigen IHC staining of brain (top) and lung (bottom) tissues of mock-infected and LPhTX- or LPhTXdNS1-infected mice. Scale bars represent 2 mm. c–e Quantitative assessment of histological lesions (c) and tissue viral NP antigen positivity (%) in the lung (d) and brain (e) tissues from mock-infected and LPhTX- and LPhTXdNS1-infected mice. Data are presented as mean ± SD. Differences in quantitative assessment of histologic lesions and percentage of viral antigens were analyzed using beta regression. Post-hoc testing was conducted using Wald’s z-test with Tukey’s adjustment for multiple comparisons (* = p < 0.05; **** = p < 0.0001).
Fig. 6
Fig. 6. Histopathological findings in brain and lung sections of mice infected with LPhTXdNS1 at 4 dpi.
H&E staining (a) and IHC detection of viral NP antigen (b) in the brain (top) and lung (bottom) tissues of mock-infected or infected mice with LPhTX and LPhTXdNS1. First row scale bars of each tissue represent 1000 μm and second row scale bars of each tissue represent 100 μm. The images displayed at the bottom are directly associated with the corresponding squares shown at the top images.
Fig. 7
Fig. 7. Protection efficacy of LPhTXdNS1.
a Schematic representation of the challenge experimental design, detailing the challenge virus, infectious dose, number of animals, and in vivo imaging (IVIS) schedule. b Body weight loss (%) following vaccination with different doses of LPhTXdNS1 (vLPhTXdNS1) and challenge with 103 PFU of HPhTX-Nluc. Mock-vaccinated animals challenge with 103 PFU of HPhTX-Nluc, and mock-challenged mice, were included as control. c Survival rate following challenge with HPhTX-Nluc from animals in (a). d Nluc expression as determined by IVIS from same group of animals used in panel a to assess morbidity and mortality at 4 and 6 DPI. e IVIS of necropsy groups of mice and their corresponding lung and brain tissues at 4 and 6 DPI.
Fig. 8
Fig. 8. HPhTX-Nluc viral titers in the NT, lungs, and brains of mice vaccinated with LPhTXdNS1.
a, b Viral replication of HPhTX-Nluc was determined by measuring Nluc activity (a) and viral titers (b) at day 4 post-challenge. c, d Viral replication of HPhTX-Nluc was determined by Nluc activity (c) and viral titers (d) at day 6 post-challenge. Data are presented as mean ± SD. A mixed-effects ANOVA followed by Dunnett’s multiple comparisons test (* = p < 0.05, ** = p < 0.01, *** = p < 0.001, **** = p < 0.0001).
Fig. 9
Fig. 9. Immunization with LPhTXdNS1 inhibit inflammatory innate immune responses in C57BL/6 J mice following challenge with HPhTX-Nluc.
Lung tissue homogenates from mock-vaccinated and LPhTXdNS1-vaccinated C57BL/6 J mice were analyzed at 4 and 6 days after challenge with HPhTX-Nluc for secreted cytokines (IFN-α, IFN-β, IFN-γ and IL-6) and chemokines (CCL2 and CCL5) using a 6-plex bead Luminex assay. Data is shown as Mean ± SEM with n = 4 mice/group. A two-way ANOVA with Dunnett’s multiple comparisons test was used to compare groups within each time-point. The significant differences are indicated (** = p < 0.01, *** = p < 0.001; **** = p < 0.0001).
Fig. 10
Fig. 10. Histologic lesions and IHC staining for viral NP antigen after challenge with HPhTX-Nluc.
a, b H&E tissue sections (a) and IHC (b) of brain (top) and lung (bottom) tissues from mock-vaccinated, mock-challenged mice; mock-vaccinated, challenged mice; and vaccinated mice (102-4 PFU vLPhTXdNS1), challenge mice. All challenged groups were infected with a lethal infection dose of 103 PFU of the HPhTX-Nluc. Scale bars represent 2 mm. c–e Quantitative assessment of histologic lesions (c) and tissue viral NP antigen positivity (%) in the lung (d) and brain (e) tissues from mice in panel a. Data are presented as mean ± SD. Differences in quantitative assessment of histologic lesions and percentage of viral antigens were analyzed using beta regression. Post-hoc testing was conducted using Wald’s z-test with Tukey’s adjustment for multiple comparisons (**** = p < 0.0001).
Fig. 11
Fig. 11. Histopathological findings in the brain and lung sections of mice challenge with HPhTX-Nluc.
a H&E staining and bIHC detection of viral antigen (NP) in in the brain (top) and lung (bottom) tissues. First row scale bars of each tissue represent 1000 μm and second row scale bars of each tissue represents 100 μm. The images displayed at the bottom are directly associated with the corresponding squares shown at the top images.

References

    1. Mostafa, A. et al. Avian influenza A (H5N1) virus in dairy cattle: origin, evolution, and cross-species transmission. mBio15, e02542–02524 (2024). - PMC - PubMed
    1. CDC. H5 bird flu: current situation https://www.cdc.gov/bird-flu/situation-summary/index.html (CDC, 2025).
    1. USDA. The occurrence of another highly pathogenic avian influenza (HPAI) spillover from wild birds into dairy cattle. (USDA, 2025).
    1. Rolfes, M. A. et al. Effects of influenza vaccination in the United States during the 2017–2018 influenza season. Clin. Infect. Dis.69, 1845–1853 (2019). - PMC - PubMed
    1. Frutos, A. M. et al. Interim estimates of 2023-24 seasonal influenza vaccine effectiveness - United States. MMWR Morb. Mortal. Wkly Rep.73, 168–174 (2024). - PMC - PubMed

LinkOut - more resources