. 2025 Jul 12;15(1):25231.
doi: 10.1038/s41598-025-10933-y.

Hyperglycemia-induced mitochondrial abnormalities in autonomic neurons via the RAGE axis

Affiliations

Hyperglycemia-induced mitochondrial abnormalities in autonomic neurons via the RAGE axis

María G Otero et al. Sci Rep. .

Abstract

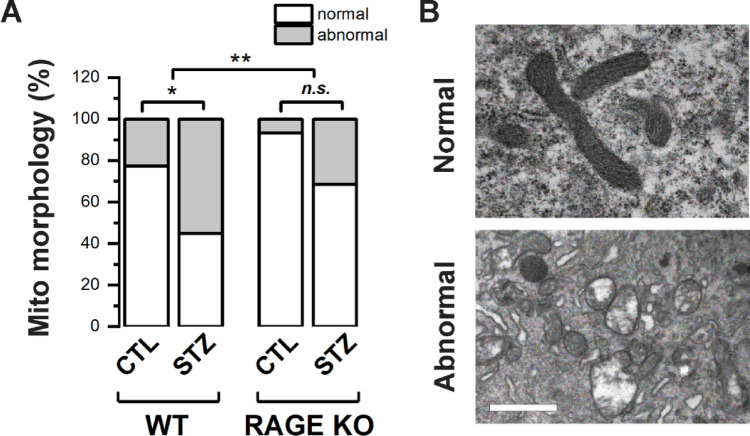
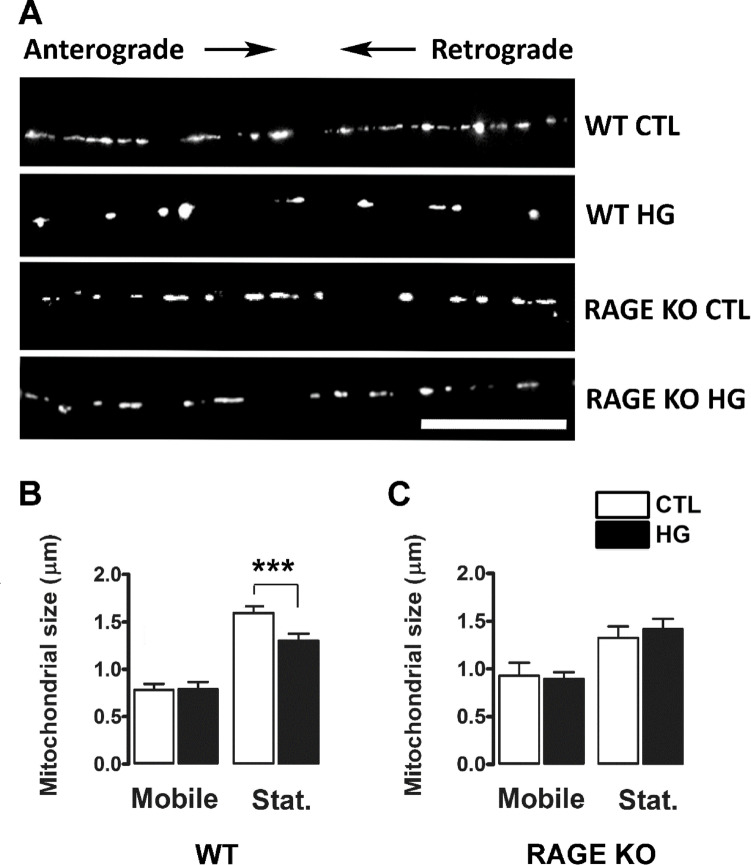
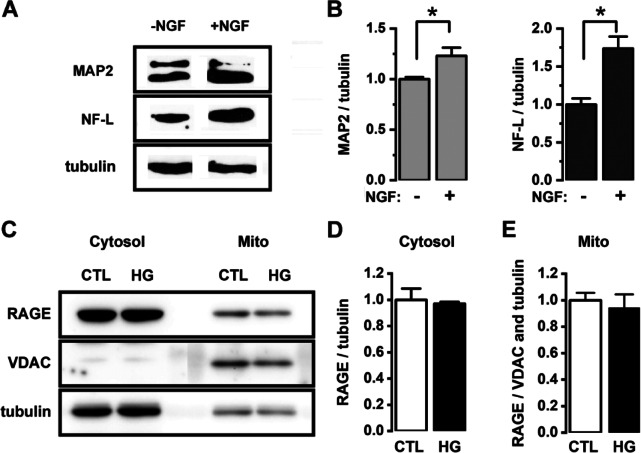
Diabetic peripheral neuropathy is characterized by mitochondrial dysfunction, including suboptimal respiration, impaired calcium homeostasis, and accumulation of reactive oxygen species (ROS). Hyperglycemia drives excessive electron donation to the mitochondria, resulting in damaging ROS levels. In peripheral neurons, hyperglycemia also leads to the formation of advanced glycation end-products (AGEs), which, through their membrane receptor (RAGE), trigger autonomic malfunction in diabetes. However, it remains unclear whether RAGE is required to induce mitochondrial abnormalities under hyperglycemia. Thus, we first investigated mitochondrial morphology in autonomic ganglia (superior cervical ganglion, SCG) from streptozotocin (STZ)-induced diabetic mice and found an enhanced proportion of swollen mitochondria with disrupted cristae in wild-type (WT) diabetic mice, but not in RAGE knock-out (KO) diabetic mice. Next, we exposed cultured SCG neurons to high glucose and found fragmentation and an imbalanced traffic represented by an increased proportion of only anterograde moving mitochondria in neurons from WT, but such imbalance was not observed in neurons from RAGE KO mice. Treating WT neurons with the non-membrane permeable RAGE selective inhibitor FPS-ZM1, did not prevent fragmentation, although a non-significant restoring trend was observed. Furthermore, ATP production was unaffected by exposure to high glucose in neurons for WT, and remained unchanged by incubation in FPS-ZM1. Interestingly, neurons from RAGE KO mice had significantly less ATP produced in all conditions than those from WT mice. Lastly, we found RAGE protein in enriched mitochondrial fractions from nerve growth factor (NGF)-transformed PC12 (PC12NGF) cells, as well as the colocalization of RAGE with a mitochondrial marker in cultured SCG neurons. Therefore, our data support that RAGE mediates mitochondrial damage in autonomic neurons under hyperglycemic conditions.


Conflict of interest statement

Declarations. Competing interests: The authors declare no competing interests. Ethics approval: This study was performed in line with the principles of the Canadian Council on Animal Care (CCAC). The Animal Use Protocol (AUP 20090082) involved in the current study is reviewed annually, and approval is granted by the University of Saskatchewan’s Animal Research Ethics Board (AREB).

Figures

Fig. 1
Fig. 1
Hyperglycemia induces changes in mitochondrial ultrastructure in WT but not in RAGE KO mice. A-B, Transmission electron microscopy (TEM) images were obtained from the SCG of WT (A-B) and RAGE KO (C-D) mice. Mice were either control (CTL, A&C) and STZ-induced diabetic (STZ; B&D). Insets show the magnified area of interest outlined in red. N: nucleus; Cyt: cytoplasm; and M: plasma membrane. Scale bars: 1 μm (A-B), 2 μm (C-D), and for the inset panels 0.2 and 0.4 μm WT and RAGE KO, respectively. (N = 5 for WT CTL, WT STZ and RAGE KO CTL; and N = 4 for RAGE KO STZ).
Fig. 2
Fig. 2
The SCG of STZ-induced diabetic WT mice had an increased proportion of abnormal mitochondria with respect to RAGE KO mice. A, Quantification of the average proportion of normal to abnormal mitochondria from TEM images of SCG slices from WT and RAGE KO mice, control (CTL) and STZ-induced diabetic (STZ), Chi-square test (χ2) of independence. B, Representative images depicting examples of normal vs. abnormal mitochondria. Scale bar = 500 nm. N = 5 for WT CTL, WT STZ and RAGE KO CTL; and N = 4 for RAGE KO STZ.
Fig. 3
Fig. 3
High glucose treatment in vitro caused a reduction in the size of stationary mitochondria in SCG neurons from WT but not from RAGE KO mice. A, Representative examples of epifluorescence images captured from neurites of SCG neurons expressing Mito-eGFP from either WT or RAGE KO mice exposed to control (CTL) or high glucose (HG) conditions. Images are oriented with the cell body to the left and the neurite tip to the right. Scale bar = 20 μm. B-C, Quantification of the mitochondrial size from mobile and stationary organelles in SCG cultures from WT (B) and RAGE KO (C) mice. Means were statistically compared by One-Way ANOVA; *** p < 0.001. (N = 134 WT CTL, 156 WT HG, 70 RAGE KO CTL, and 161 RAGE KO HG).
Fig. 4
Fig. 4
Mitochondrial fragmentation in high glucose was not prevented by the selective RAGE inhibitor FPS-ZM1. A, Representative examples of epifluorescence images captured from neurites of SCG neurons labeled with MitoTracker Green in either WT or RAGE KO mice, or in WT mice incubated with the selective RAGE inhibitor (RI) FPS-ZM1 for 72 h before measurement. All groups were maintained in control (CTL) or high glucose (HG) conditions. Scale bar = 10 μm. B, Quantification of the mitochondrial size in SCG cultures from WT and RAGE KO mice. Means were statistically compared using one-way ANOVA, F (5, 1908) = 13.87; *** p < 0.0001; **** p < 0.0001. (N = 353 WT CTL, 332 WT CTL + RI, 359 WT HG, 282 WT HG + RI, 297 RAGE KO CTL, 413 RAGE KO HG).
Fig. 5
Fig. 5
RAGE interferes with retrograde mitochondrial transport in high glucose conditions. A, Kymograph analysis from movies neurites of SCG neurons expressing Mito-eGFP (CTL and HG) from WT mice. B, Quantification of the proportion of anterograde (Anter), retrograde (Retro), and stationary (Stat) mitochondria within neurites. C, Mitochondrial density per micron. D-E, Kymographs analysis and quantification of parameters as in A-C in cultured SCG neurons from RAGE KO mice. Scale bar = 20 μm. Means were statistically compared by One-Way ANOVA; * p < 0.05. (N = 64 WT CTL, 37 WT HG, 23 RAGE KO CTL, and 22 RAGE KO HG).
Fig. 6
Fig. 6
RAGE contributes to mitochondrial ATP production in SCG neurons exposed to high glucose. Quantification of mitochondrial ATP (mATP) production in media containing control (CTL) or high glucose (HG) in cultured neurons from WT and RAGE KO mice. Neurons from WT mice were also incubated with the RAGE inhibitor (RI) FPS-ZM1 in both experimental conditions. Means were statistically compared by One-Way ANOVA– (F, = 6.014); ** p < 0.001. (N = 12 WT CTL, 11 WT CTL + RI, 11 WT HG, 12 WT HG + RI, 8 RAGE CTL, 8 RAGE HG).
Fig. 7
Fig. 7
Detection of RAGE protein in mitochondria-enriched samples from PC12NGF cells. A-B, Immunoblots and quantification of the level of expression of the neuronal markers MAP-2, neurofilament light chain (NF-L) and tubulin in whole PC12 samples maintained in media without (-NGF) or with NGF added (+ NGF). C, The immunoblots show the levels of RAGE, VDAC and tubulin detected in the cytosol-enriched and mitochondria-enriched samples from PC12 cells transformed by NGF (PC12NGF) maintained in either control (CTL) or high glucose (HG) conditions. C-D, The bar graphs show mean ± SEM levels of each protein after normalization to tubulin or VDAC in cytosol-enriched and mitochondria-enriched samples, respectively. Means were statistically compared by the Mann-Whitney U test; (MAP2: t4 = 2.695; NF-L: t4 = 3.297); * p < 0.05. (N = 3 per group in A and C). For clarity, the blots shown in A and C have been cropped, and the background brightness has been adjusted (complete blots available in Supplementary Data file).
Fig. 8
Fig. 8
Colocalization of RAGE and ATPB in the neurites of cultured SCG neurons. A-B, Representative images of immunocytochemical colocalization of RAGE and the mitochondrial marker ATPB in neurites of SCG neurons maintained in either control (CTL, A) or high glucose (HG, B). The inset image show a zoomed-in area depicting a mitochondrion and puncta RAGE staining. Scale bar = 2 μm. C-D, Bar graphs show the Pearson’s and Mandel’s coefficients obtained for the colocalization of RAGE and ATPB in the neurites of SCG neurons maintained in CTL or HG conditions. Means were statistically compared by Student’s t-test; p > 0.05. (N = 3 per group).

References

    1. Maser, R., Mitchell, B., Vinik, A. & Freeman, R. The association between cardiovascular autonomic neuropathy and mortality in individuals with diabetes: a meta-analysis. Diabetes Care. 26 (6), 1895–1901 (2003). - PubMed
    1. Vinik, A. I., Freeman, R. & Erbas, T. Diabetic autonomic neuropathy. Semin Neurol.23 (4), 365–372 (2003). - PubMed
    1. Tang, M., Donaghue, K. C., Cho, Y. H. & Craig, M. E. Autonomic neuropathy in young people with type 1 diabetes: A systematic review. Pediatr. Diabetes. 14 (4), 239–248 (2013). - PubMed
    1. Pop-Busui, R. Cardiac autonomic neuropathy in diabetes: A clinical perspective. Diabetes Care. 33 (2), 434–441 (2010). - PMC - PubMed
    1. Kuehl, M. & Stevens, M. J. Cardiovascular autonomic neuropathies as complications of diabetes mellitus. Nat Rev Endocrinol. 8(7):405–16. http://www.ncbi.nlm.nih.gov/pubmed/22371159 (2012). - PubMed

MeSH terms

Substances