. 2025 Jul 12;25(1):908.
doi: 10.1186/s12870-025-06932-w.

Comprehensive transcriptional analysis of ethylene and softening regulation in plums with distinct climacteric ripening behaviors

Affiliations

Comprehensive transcriptional analysis of ethylene and softening regulation in plums with distinct climacteric ripening behaviors

Po-Kai Huang et al. BMC Plant Biol. .

Abstract

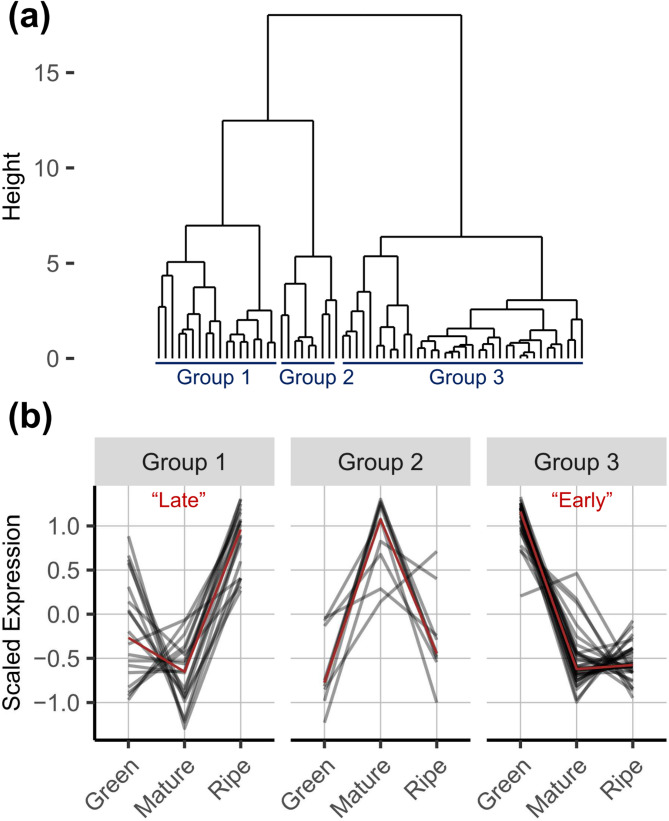
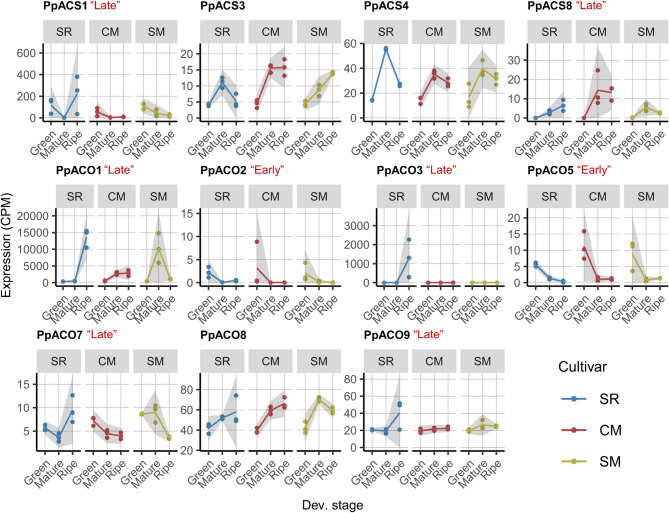
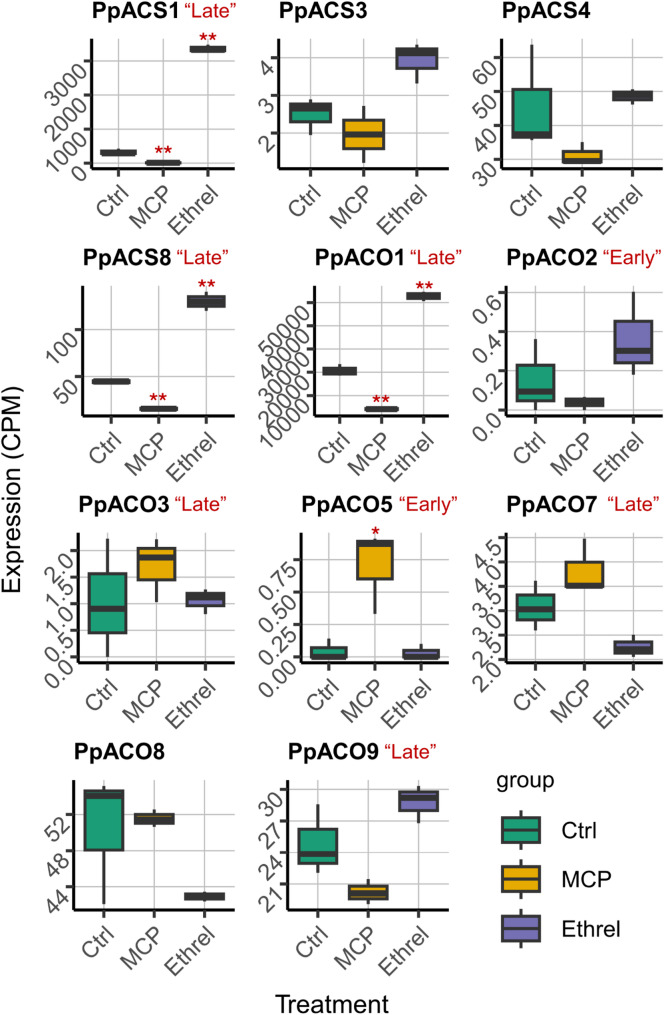
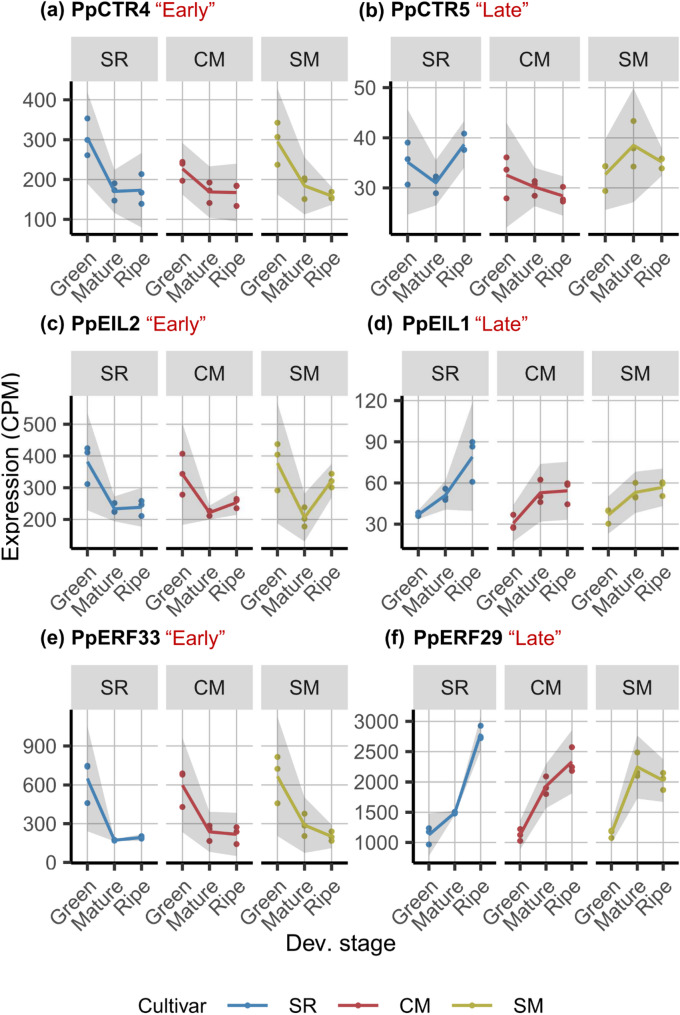
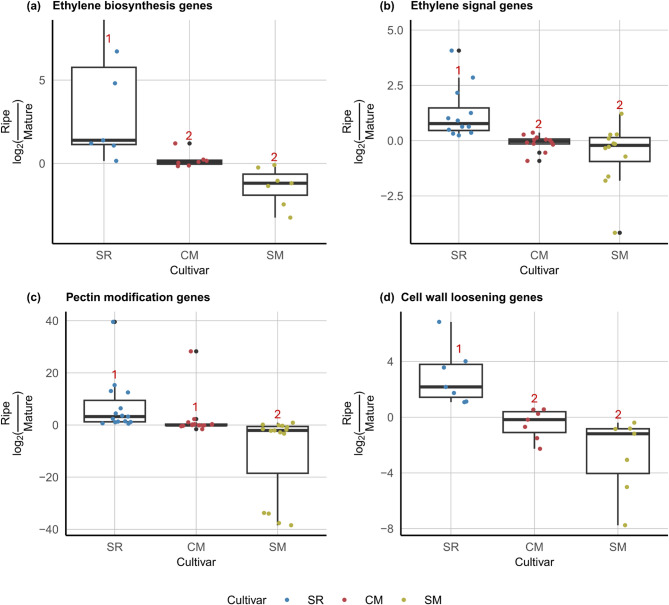
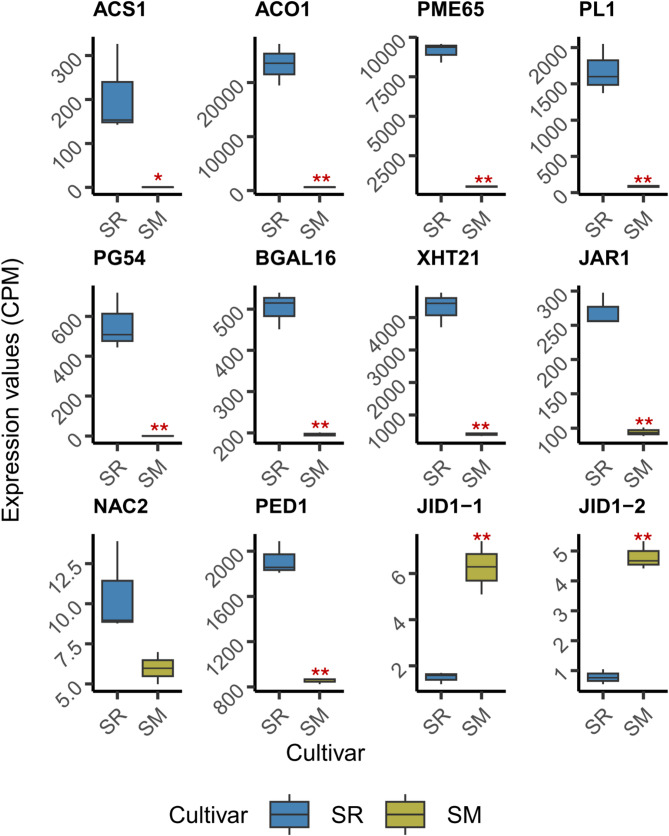
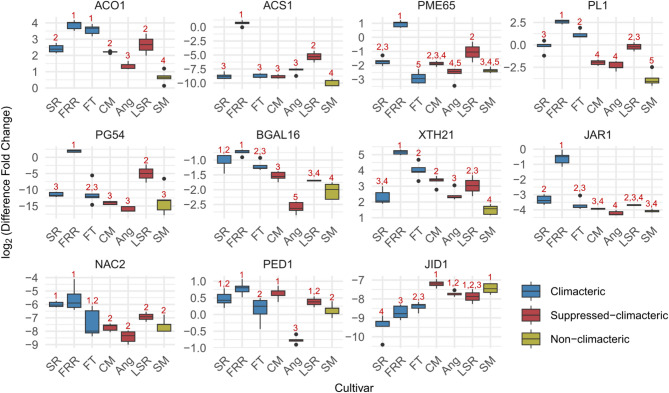
Understanding the molecular mechanisms underlying variations across climacteric categories in tree crops remains challenging, particularly due to the limitations of applying conventional genetic approaches. In this study, we examined genetically related Japanese plum (Prunus salicina Lindl.) cultivars with distinct ethylene production and responses during ripening: 'Santa Rosa' (climacteric fruit), 'Casselman' (suppressed-climacteric fruit), and 'Sweet Miriam' (non-climacteric fruit). Our primary objective was to comprehensively investigate transcriptional differences related to ethylene and fruit softening across three on-tree developmental stages: "Green" (early development), "Mature" (pre-climacteric or early climacteric), and "Ripe" (climacteric). By integrating information from Phytozome and Dicot PLAZA databases, we identified complete gene families for six ethylene-related and seven softening-related genes. Multi-developmental stage RNA-seq clustering revealed that "Late" genes, which increase in expression in ripe fruit, are associated with physiological differences among climacteric categories. We demonstrated that 'Casselman' aligns more closely with 'Sweet Miriam' than 'Santa Rosa' at the transcriptional level for these "Late" genes, consistent with their shared low ethylene production. Gene expression analyses revealed additional factors beyond ethylene, including jasmonate-related genes and NAC transcription factors as influencing climacteric ripening behavior. To extend our findings beyond the three representative cultivars, we performed qPCR on additional cultivars harvested under different field conditions and years, including 'Friar' and 'Fortune' as climacteric plums and 'Late Santa Rosa' and 'Angeleno' as suppressed-climacteric plums. PpACO1, PpPL1, PpBGAL16, PpNAC2, and PpJID1 expression patterns were conserved across cultivars and experimental conditions. Our findings provide novel insights into the transcriptional regulation of climacteric ripening and offer a strategic framework for future genetic studies in plum and other tree crops.

Keywords: Prunus salicina; Climacteric; Ethylene; Fruit softening; Non-climacteric; Suppressed climacteric; Transcriptional regulation.


Conflict of interest statement

Declarations. Ethics approval and consent to participate: Not applicable. Consent for publication: Not applicable. Competing interests: The authors declare no competing interests.

Figures

Fig. 1
Fig. 1
Ethylene-related genes are categorized by expression patterns across three developmental stages in ‘Santa Rosa’. a Hierarchical clustering reveals three groups, with Groups 1 and 3 corresponding to “Late” and “Early” genes, respectively. The dendrogram with gene names is provided in Fig. S1. b Standardized expression dynamics for each gene within the groups are shown, with the red curve indicating the median expression trend
Fig. 2
Fig. 2
Ethylene biosynthesis genes, ACS and ACO, vary in expression patterns and levels. Each facet represents the expression dynamics in flesh across the “Green”, “Mature”, and “Ripe” stages for ‘Santa Rosa’ (SR), ‘Casselman’ (CM), and ‘Sweet Miriam’ (SM). The grey ribbon around each curve indicates the 95% confidence interval. Red labels (“Late” or “Early”) indicate the expression patterns
Fig. 3
Fig. 3
Responses of ACS and ACO to 1-MCP and Ethrel reveal that not all “Early” and “Late” genes in ‘Santa Rosa’ follow System 1 and 2 regulatory patterns. The raw sequencing data from Salazar et al. (2022) were reanalyzed using our independently developed pipeline, targeting a different set of genes than the original study. The fruit were treated with gasified 0.14% 1-MCP for 20 h or dipped in 600 ppm Ethrel for 20 min. Box colors represent treatments (Control = green, 1-MCP = yellow, Ethrel = purple). Boxes display the interquartile range, with horizontal lines indicating the median. Whiskers extend to the minimum and maximum values within 1.5 times the interquartile range. Asterisks indicate significance levels (*p < 0.05, **p < 0.01) based on Dunnett’s test comparing treatments to Control
Fig. 4
Fig. 4
Examples illustrating the diverse expression patterns within positive and negative ethylene signaling regulators, which are not strictly associated with their functional roles. a, c, and e represent “Early” genes, while (b), (d), and (f) represent “Late” genes in the CTR, EIL, and ERF families, respectively. Each facet illustrates expression dynamics in flesh across the “Green”, “Mature”, and “Ripe” stages for ‘Santa Rosa’ (SR), ‘Casselman’ (CM), and ‘Sweet Miriam’ (SM). The grey ribbon around each curve indicates the 95% confidence interval, and red labels (“Late” or “Early”) denote the expression patterns. The comprehensive gene list is provided in Table S2, and the expression plots are in Fig. S2 to S6
Fig. 5
Fig. 5
Log ratios of gene expression at the “Ripe” stage relative to the “Mature” stage for “Late” genes reveal significant differences among ‘Santa Rosa’ (SR), ‘Casselman’ (CM), and ‘Sweet Miriam’ (SM). Each point represents a single “Late” gene from (a) ethylene biosynthesis, (b) ethylene signaling, (c) pectin modification, and (d) cell wall loosening. Points are colored based on the cultivars. Boxes represent the interquartile range, with horizontal lines indicating the median. Whiskers extend to the minimum and maximum values within 1.5 times the interquartile range. Numbers above the boxes were generated using the Tukey method for multiple pairwise comparisons, with different numbers indicating statistically significant differences (p < 0.05)
Fig. 6
Fig. 6
Gene Ontology (GO) (a, b) and MapMan enrichment analyses (c, d) of candidate genes exhibiting differential expression (DE) in ‘Santa Rosa’ (SR), ‘Casselman’, and ‘Sweet Miriam’. Differences between the “Mature” and “Ripe” stages, as well as distinct expression patterns across three developmental stages, were examined. Candidate genes were divided into two groups based on whether they were (a, c) upregulated or (b, d) downregulated between the “Mature” and “Ripe” stages in SR. Point size represents the number of DE genes. Color indicates p-values on a log scale, with pink and green representing smaller and higher p-values, respectively
Fig. 7
Fig. 7
Weighted gene co-expression network analysis (WGCNA) showing the correlation between gene modules and differences among ‘Santa Rosa’ (SR), ‘Casselman’ (CM), and ‘Sweet Miriam’ (SM) at the ‘Ripe’ stage. a WGCNA grouped genes into 11 modules of highly correlated expression patterns. Different colors represent distinct modules. The Grey module contains unassigned genes. b Heatmap showing correlations between modules and pairwise differences among cultivars. Row names represent modules, and column names represent pairwise comparisons. Numbers in the heatmap indicate Pearson correlation coefficients, with p-values in parentheses. Color coding reflects the direction of correlation: pink for positive and green for negative
Fig. 8
Fig. 8
Expression differences of target genes between ‘Santa Rosa’ (SR) and ‘Sweet Miriam’ (SM) in an independent dataset are consistent with our RNA-seq results. Raw sequencing data from Farcuh et al. (2017) were reanalyzed using our independently developed pipeline, targeting a different set of genes than the original study. Boxes, colored by cultivar, represent the interquartile range, with horizontal lines indicating the median. Whiskers extend to the minimum and maximum values within 1.5 times the interquartile range. Asterisks indicate significance levels (*p < 0.05, **p < 0.01) based on t-tests comparing SM to SR
Fig. 9
Fig. 9
qPCR analysis of target gene expression in additional climacteric and suppressed-climacteric plum cultivars during the 2024 season. Boxes are colored according to the climacteric ripening behaviors corresponding to ‘Santa Rosa’ (SR), ‘Casselman’ (CM), and ‘Sweet Miriam’ (SM). Each box represents the interquartile range, with horizontal lines indicating the median. Whiskers extend to the minimum and maximum values within 1.5 times the interquartile range. Numbers above the boxes were based on the Tukey method for multiple pairwise comparisons, with different numbers indicating statistically significant differences (p < 0.05)

Similar articles

References

    1. Paul V, Pandey R, Srivastava GC. The fading distinctions between classical patterns of ripening in climacteric and non-climacteric fruit and the ubiquity of ethylene—An overview. J Food Sci Technol. 2012;49:1–21. - PMC - PubMed
    1. Pech J-C, Purgatto E, Bouzayen M, Latché A. Ethylene and fruit ripening. In: Roberts J, editor. Annual Plant Reviews Online. John Wiley & Sons, Ltd; 2018. p. 275–304.
    1. Abdi N, Holford P, McGlasson WB, Mizrahi Y. Ripening behaviour and responses to propylene in four cultivars of Japanese type plums. Postharvest Biol Technol. 1997;12:21–34.
    1. Abdi N, McGlasson WB, Holford P, Williams M, Mizrahi Y. Responses of climacteric and suppressed-climacteric plums to treatment with propylene and 1-methylcyclopropene. Postharvest Biol Technol. 1998;14:29–39.
    1. Minas IS, Font i Forcada C, Dangl GS, Gradziel TM, Dandekar AM, Crisosto CH. Discovery of non-climacteric and suppressed climacteric bud sport mutations originating from a climacteric Japanese Plum cultivar (Prunus salicina Lindl). Front Plant Sci. 2015;6:316. - PMC - PubMed

MeSH terms