. 2025 Jul 12;32(1):68.
doi: 10.1186/s12929-025-01158-2.

Guilty by association: direct interaction with the tetraspanin CD63 suggests a role for organic cation transporter 3 in histamine release from granulocytes

Affiliations

Guilty by association: direct interaction with the tetraspanin CD63 suggests a role for organic cation transporter 3 in histamine release from granulocytes

Moritz Pernecker et al. J Biomed Sci. .

Abstract

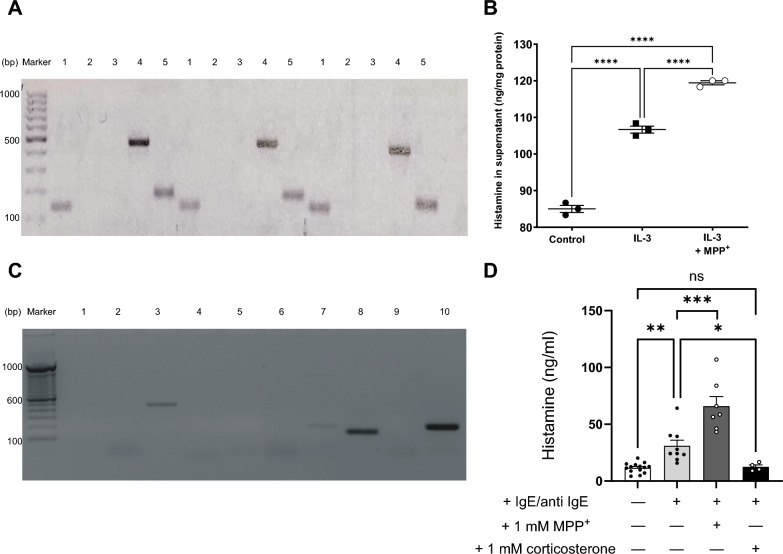
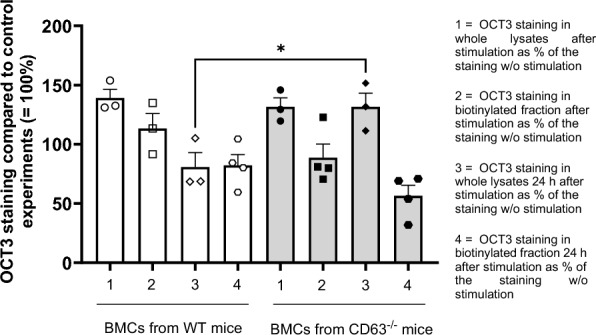
Background: The organic cation transporter 3 (OCT3) is a ubiquitous transporter that carries both endogenous and exogenous substrates, such as histamine and cisplatin. Our investigations have shown that OCT3 directly interacts with the tetraspanin CD63. CD63 is a marker for activated basophils and mast cells, which are granulocytes capable of rapidly releasing large amounts of histamine. This makes them key players in the development of allergic reactions.

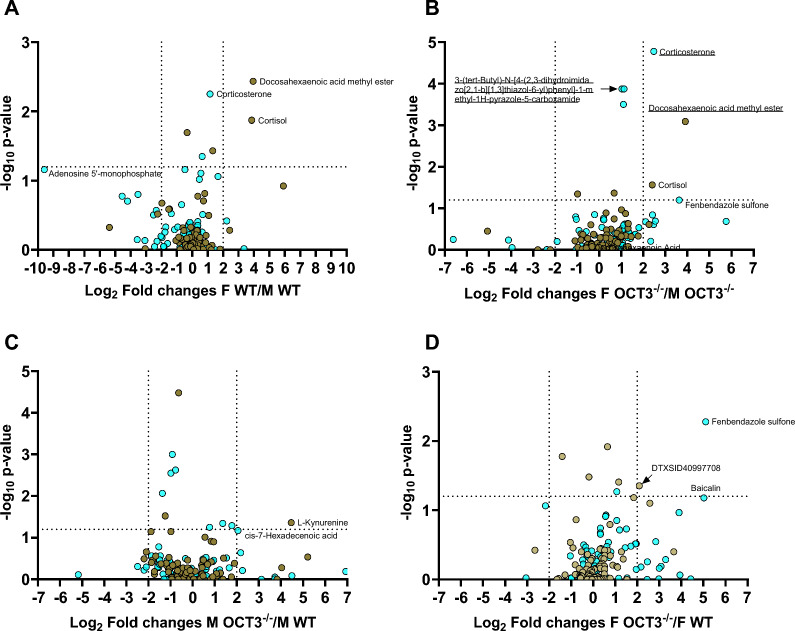
Methods and results: In this work, we demonstrated that OCT3 is present in murine and human basophils and is strongly colocalized with CD63 in a specific region of the plasma membrane, particularly after cell activation leading to histamine release. Furthermore, we confirmed that part of the histamine release from basophils is mediated by OCT3. In a mouse model of contact dermatitis, the presence of OCT3 is crucial for determining the severity of the allergic reaction. The presence of CD63 also seems to be important for regulating the allergic response, although it does not directly affect histamine secretion. RNA-Seq and metabolome analyses revealed that wild-type mice and mice with genetic deletion of OCT3 (OCT3-/-) are phenotypically very similar, and that the observed effects in OCT3-/- organisms can be attributed mainly to the genetic deletion of the OCT3 transporter.

Conclusions: In conclusion, OCT3 is a transporter for histamine in granulocytes, which plays a crucial role in determining the intensity of allergic reactions and may be a target for interventions aimed at reducing their severity.

Keywords: Allergy; CD63; Histamine; Organic cation transporter 3.


Conflict of interest statement

Declarations. Ethics approval and consent to participate: All experiments conducted in this study with animals were ethically approved by the North Rhine Westphalia State Environment Agency (LANUV, approval 81-02.04.2018.A387) and adhered strictly to national guidelines concerning animal welfare and protection. The ethics committee of the University of Münster approved all experiments performed with PBMC isolated from buffy coats (German Red Cross) (2013-286-f-S). We affirm that this manuscript has not been published elsewhere and is not under consideration by another journal. All authors have approved the manuscript and declare no conflicts of interest. Consent for publication: Not applicable. Competing interests: The authors declare that they have no competing financial interests or personal relationships that could have appeared to influence the work reported in this paper.

Figures

Fig. 1
Fig. 1
Schematic representation of contact allergy experiments with DNFB as performed in WT, CD63−/−, and OCT3−/− mice
Fig. 2
Fig. 2
Interaction of hOCT3 and CD63 in the mbSUS (panel A), in pulldown assays (panel B), and in ASP+ uptake experiments (panel C). A Example of interaction of CD63 with hOCT3 in the yeast mating assay, which demonstrates interaction between NubG-CD63 (prey) and hOCT3-Cub (bait, colony formation in 1). Lack of interaction between hOCT3-Cub and the empty Nub vector provides a negative control (no colony formation in 2), whereas Nub-WT and hOCT3-Cub mating functions as positive control (colony formation in 3). B Example of pulldown assay confirming interaction between CD63 and hOCT3. Pulldown assay of CD63 linked to talon sepharose beads via 6xHIS tag incubated with hOCT3 demonstrates physical interaction (lane 2), whereas hOCT3 alone as a negative control is not detectable in Western blot analysis (lane 1). M is the molecular weight of markers (kDa). C Effect of transfection of empty vector (EV) or of CD63 in HEK293 cells stably expressing hOCT3 on ASP+ uptake. The ASP+ uptake was expressed as % of what measured in hOCT3-HEK293 cells (Control = 100%). Transfection with EV did not change ASP+ uptake compared to what measured in hOCT3-HEK293 cells (ns). Conversely, CD63 transfection significantly decreased ASP+ uptake compared to what measured in hOCT3-HEK293 (****p < 0.0001) and in hOCT3-HEK293-EV cell (*p = 0.0141, ANOVA test). The numbers on the top of the columns indicate the replicates that were measured in at least 3 independent experiments
Fig. 3
Fig. 3
Panel A shows PCR analysis of mRNA expression of CD63 (lane 1), hOCT1 (lane 2), hOCT2 (lane 3), hOCT3 (lane 4), and GAPDH (lane 5) in three different preparations of fresh isolated human basophils. Panel B shows the effect of 24 h incubation with 20 ng/ml IL-3 in the presence or not of 1 mM MPP+, a known substrate of hOCT3, on the histamine release (ng/mg protein) into cell supernatant from fresh isolated human basophils. Panel C shows a PCR analysis of mRNA expression of hOCT1 (lane 1), hOCT2 (lane 2), hOCT3 (lane 3), MATE1 (lane 4), MATE2K (lane 5), hOCTN1 (lane 6), hOCTN2 (lane 7), CD63 (lane 8), CD9 (lane 9), and GAPDH (lane 10) in the human basophilic cell line KU812. Panel D shows histamine concentration in supernatants from KU812 cells with (grey columns) or without (open columns) stimulation with 5 µg/ml IgE and 0.2 µg/ml anti-IgE. The effects of the addition of 1 mM MPP.+ or 1 mM corticosterone to experiments with stimulation (black columns) are also shown. Histamine concentration (ng/ml) is expressed as mean ± SEM. Every single point in the figures represents the result of an independent experiment. Asterisks indicate a statistically significant difference (****p < 0.0001, ***p = 0.0001, **p = 0.0011, *p = 0.0207. ANOVA test with Dunnett’s multiple comparison test)
Fig. 4
Fig. 4
Immunofluorescence analysis of hOCT3 (green) and CD63 (red) distribution in KU812 cells without (w/o stimulation) or with stimulation (with stimulation) using 5 µg/ml IgE and 0.2 µg/ml anti-IgE (magnification 630x). Panels A and B and panels D and E show the labelling of hOCT3 and CD63 without and with stimulation, respectively. Panels C and F show the overlay of hOCT3, CD63, and DAPI labelling without and with stimulation, respectively. After stimulation, there is a clear translocation of hOCT3 and CD63 to the plasma membrane, where they co-localize. A 10 µm scale bar is also shown. Panel G shows Pearson’s coefficient for co-localization of hOCT3 and CD63 in the presence (stimulated) or absence (unstimulated) of histamine release stimulation with IgE/anti-IgE. Stimulation of histamine release significantly increased the hOCT3/CD63 co-localization coefficient measured using a Jacop plug-in in 88 and 70 unstimulated (open circles) and stimulated (closed circles) cells, respectively, from at least 3 independent experiments, each marked with different colors (****p < 0.0001, unpaired t-test)
Fig. 5
Fig. 5
Cellular distribution of CD63 (green) and hOCT3 (red) before, at the end, and 24 h after end of incubation of KU812 cells to stimulate histamine release. The immunofluorescence analysis was conducted on stack images; histamine release was stimulated by 24 h incubation with 5 µg/ml IgE followed by 20 min incubation with 0.2 µg/ml anti-IgE (magnification 630x). Upper row represents the CD63 and hOCT3 labeling before the IgE/anti-IgE incubation, middle row immediately after IgE/anti-IgE incubation and the lower row 24 h after the end of incubation. DAPI labeling of cell nuclei (blue) and merge images are also presented. A 10 µm scale bar is included for reference in the merge picture
Fig. 6
Fig. 6
Histamine concentrations in pellets (P) and supernatants (S) of bone marrow cells (BMCs) from WT, OCT3−/−, and CD63−/− male (M, blue closed and open symbols) and female (F, pink closed and open symbols) mice. Histamine concentration was measured by an Elisa method and reported to the protein concentration in the pellets. In some experiments, BMCs were incubated with 1 ng/ml recombinant murine IL-3 for 48 h, and for 24 h with 5 µg/ml monoclonal anti-dinitrophenyl (Maus IgE Isotyp) IgE, before adding 2 µg/ml (2,4-dinitrophenilated BSA) anti-IgE for 30 min, followed by separation of supernatants and pellets (stimulation experiments, indicated by +). Every single point indicates the results of experiments performed with BMCs isolated from one animal and the mean values with the SEM are also reported. Stimulation of BMCs significantly increased histamine content in supernatants and, only for WT mice, also in pellets (ANOVA)
Fig. 7
Fig. 7
Results of the Western blot analysis of OCT3 expression in whole cell lysates and biotinylated membrane fractions from BMCs of WT and CD63⁻/⁻ mice. BMCs were stimulated with IL-3, IgE, and anti-IgE to promote basophil maturation and histamine release. In a subset of experiments, cells were further incubated for 24 h in standard culture medium following stimulation. OCT3 levels are presented as percentages relative to the corresponding control whole lysate and biotinylated fraction samples, which were set to 100%. Bars represent the mean ± SEM from 3 to 4 independent experiments, with individual data points indicated by unique symbols. Stimulation led to a marked increase in OCT3 expression in whole cell lysates from both WT and CD63⁻/⁻ BMCs. However, OCT3 levels in the biotinylated membrane fractions did not differ significantly from those of control cells in either genotype. Notably, in CD63⁻/⁻ BMCs, OCT3 expression in whole lysates remained elevated 24 h post-stimulation (p = 0.032, Welch’s t-test), in contrast to the decline observed in WT cells. In both genotypes, OCT3 levels in the biotinylated fractions were significantly reduced after 24 h
Fig. 8
Fig. 8
Results of RNA-Seq analysis of unstimulated and stimulated BMCs from WT, and OCT3−/−-mice. Panel A shows the principal component (PC) analysis of the mRNA-Seq data: the BMC samples cluster in 4 groups and are distinctly separated from each other. Stimulation is responsible for the biggest changes in mRNA expression. Panels BE show Volcano plots relating the changes in expression of a mRNA (log2 fold change) depending on animal genotype (panels B and D) or treatment (panels C and E) to their statistical significance (−log10 padj). Dashed lines on the x-axis represent log2 fold change thresholds of ± 2, while the dashed line on the y-axis marks the significance threshold (p = 0.05). RNAs with p < 0.05 and log2 fold change < −2 or > 2 are labeled in green for down-regulation and in red for stimulation. The genotype is responsible for a few significant changes, while treatment strongly changes mRNA-profile
Fig. 9
Fig. 9
Analysis of pathways regulated by genetic deletion of OCT3 (columns) and by stimulation of basophil maturation and histamine release by incubation with IL-3, IgE, and anti-IgE (treated, rows) in BMCs from WT, and OCT3−/− mice. Pathways were analyzed using the Gene Ontology Annotations [54, 55]. Green arrows with arrowheads pointing down indicate downregulation, red arrows with arrowheads pointing up indicate upregulation of a specific pathway
Fig. 10
Fig. 10
Comparison of metabolomic analysis results of BMC pellets from male WT and OCT3−/− mice after stimulation with IL-3, IgE, and anti-IgE to promote basophil maturation and histamine release. Volcano plots comparing stimulated (stim.) and unstimulated (unstim.) BMCs are shown for WT mice (panel A) and OCT3−/− mice (panel B). Volcano plots comparing metabolomes from unstimulated and stimulated BMCs from OCT3−/− and WT mice are also shown in panel C and D, respectively. Histamine and N-methylhistamine are highlighted with red circles. Blue circles show members of the one carbon pool by folate metabolism (betaine, choline, folic acid), of glycerophospholipid metabolism (acetylcholine, choline), sucrose metabolism (glucose-1-phosphate), and biosynthesis of unsaturated fatty acids metabolism (stearic acid) pathways. Dashed lines on the x-axis represent log2 fold change thresholds of ± 2, while the dashed line on the y-axis marks the significance threshold (p = 0.05). Stimulation of WT-BMCs decreases histamine and N-methylhistamine amounts in pellets compared to unstimulated WT-BMCs (panel A). Conversely, after stimulation of OCT3−/−-BMCs histamine and N-methylhistamine amounts in pellets stayed higher than compared to unstimulated BMCs (panel B), suggesting that these substances do not exit the cells efficiently because of OCT3 missing. Without stimulation, OCT3−/−-BMCs showed few changes compared to unstimulated WT-BMCs, with histamine amount not significantly different and N-methylhistamine presents at lower concentration in pellets from unstimulated OCT3−/−-BMCs compared to pellets from unstimulated WT-BMCs (panel C). The comparison of histamine and N-methylhistamine amounts in pellets from stimulated BMCs shows that OCT3−/−-BMCs retain higher quantities of these substances, probably because of the missing transport out of the cells through OCT3 (panel D)
Fig. 11
Fig. 11
Comparison of metabolomic analysis results of BMC supernatants from male WT and OCT3−/− mice after stimulation with IL-3, IgE, and anti-IgE to promote basophil maturation and histamine release. Volcano plots comparing stimulated (stim.) and unstimulated (unstim.) BMCs are shown for WT mice (panel A) and OCT3−/− mice (panel B). Volcano plots comparing metabolomes from unstimulated and stimulated BMCs from OCT3−/− and WT mice are also shown in panel C and D, respectively. Histamine, N-acetylhistamine, and N-methylhistamine are highlighted with red circles. Dashed lines on the x-axis represent log2 fold change thresholds of ± 2, while the dashed line on the y-axis marks the significance threshold (p = 0.05). Stimulation of WT-BMCs slightly increases only N-acetylhistamine amounts in supernatants compared to unstimulated WT-BMCs (panel A). Conversely, after stimulation of OCT3−/−-BMCs histamine abundance did not change in supernatants, while the amount of N-acetylhistamine decreased, and that of N-methylhistamine increased, compared to what measured in unstimulated BMCs (panel B), suggesting that N- acetylhistamine does not exit the cells efficiently because of OCT3 missing. The scarce permeability of plasma membrane to histamine and N-methylhistamine in OCT3−/−-BMCs is evidentiated in panels C and D, where their amount in supernatant was lower than what measured in WT-BMCs
Fig. 12
Fig. 12
Panel A Ear swelling measured as ear thickness changes in WT, OCT3−/−, and CD63−/− mice 24 and 48 h after challenge with DNFB compared with the contralateral unchallenged ear. In WT and in CD63−/− mice a significantly higher ear swelling than in OCT3−/− mice was measured already 24 h after challenge. Every point represents an animal. Indicated are the median values together with the interquartile ranges as well as the significance levels of statistically significant differences (ANOVA). Pink and blue points indicated results obtained with female and male animals, respectively. Panel B Toluidine blue staining of mouse ear pinnae from WT, OCT3−/−, and CD63−/− mice 48 h after challenge with DFNB (“allergic” ear) compared with the contralateral unchallenged ear (“control” ear). In WT and CD63−/− mice a robust ear swelling is visible, while it is not evident in OCT3−/− animals. Scale bar = 200 µm
Fig. 13
Fig. 13
Volcano plots from serum metabolomic analysis of male (M) and female (F) WT and OCT3−/− mice. The metabolomic profiles revealed minimal differences between groups. Metabolites annotated at level 2 are highlighted in light blue, and those at level 3 in brown. Dashed lines on the x-axis represent log2 fold change thresholds of ± 2, while the dashed line on the y-axis marks the significance threshold (p = 0.05). Metabolites with p < 0.05 and log2 fold change < −2 or > 2 are labeled, alongside a few additional metabolites of interest that do not meet these criteria. Panels A and B show that female mice of both WT and OCT3−/− genotypes exhibit higher serum concentrations of corticosterone and cortisol compared to males. The genotype had no significant impact on the serum metabolome of male mice (panel C), whereas small differences were observed in females (panel D). Underlined names show substances with significantly different padj values (p < 0.05) in the statistical comparison

References

    1. Busch AE, Karbach U, Miska D, Gorboulev V, Akhoundova A, Volk C, et al. Human neurons express the polyspecific cation transporter hOCT2, which translocates monoamine neurotransmitters, amantadine, and memantine. Mol Pharmacol. 1998;54:342–52. - PubMed
    1. Duan H, Wang J. Selective transport of monoamine neurotransmitters by human plasma membrane monoamine transporter and organic cation transporter 3. J Pharmacol Exp Ther. 2010;335:743–53. - PMC - PubMed
    1. Koepsell H. Update on drug-drug interaction at organic cation transporters: mechanisms, clinical impact, and proposal for advanced in vitro testing. Expert Opin Drug Metab Toxicol. 2021;17:635–53. - PubMed
    1. Thévenod F, Ciarimboli G, Leistner M, Wolff NA, Lee W-K, Schatz I, et al. Substrate- and cell contact-dependent inhibitor affinity of human organic cation transporter 2: studies with two classical organic cation substrates and the novel substrate Cd2+. Mol Pharm. 2013;10:3045–56. - PubMed
    1. Koepsell H, Lips K, Volk C. Polyspecific organic cation transporters: structure, function, physiological roles, and biopharmaceutical implications. Pharm Res. 2007;24:1227–51. - PubMed

LinkOut - more resources