. 2025 Jul 12;23(1):787.
doi: 10.1186/s12967-025-06792-w.

Biventricular electromechanical dysfunction and molecular remodeling in a rat model of advanced pulmonary arterial hypertension

Affiliations

Biventricular electromechanical dysfunction and molecular remodeling in a rat model of advanced pulmonary arterial hypertension

Francesco Paolo Lo Muzio et al. J Transl Med. .

Abstract

Background: Pulmonary arterial hypertension (PAH) is a severe condition characterized by elevated pulmonary arterial pressure, leading to significant morbidity and mortality. Despite ongoing research, its pathophysiology remains incompletely understood. Traditionally, PAH has been regarded as predominantly affecting the right ventricle (RV), often overlooking its potential impact on the left ventricle (LV), particularly in patients with preserved LV ejection fraction (EF).

Methods: In this study, we investigate the late-stage effects of PAH on both electrical and mechanical functions, as well as their coupling, in each ventricle using the monocrotaline-treated rat model. Specifically, an integrative approach combining in-vivo epicardial potential mapping, in-situ video kinematic evaluation, and transcriptomic analysis was performed on rats injected with monocrotaline (MCT, n = 22) or saline solution (Physio, n = 16).

Results: Our findings reveal that PAH induces global increases in refractoriness from 88.8 ± 1.9 ms to 152.7 ± 3.9 ms and reductions in conduction velocity in the RV from 0.59 ± 0.01 m/s to 0.55 ± 0.01 m/s and from 0.28 ± 0.01 m/s to 0.25 ± 0.01 m/s along and across the fiber orientation, respectively. Notably, a significant increase in electromechanical delay from 24.9 ± 1.2 ms to 35.8 ± 5.2 ms was also observed in the RV. In the LV, PAH also results in increased refractoriness from 95.4 ± 3.0 ms to 140.0 ± 11.5 ms and reduced transverse conduction velocity by 14%, despite preserved EF. Transcriptomic analysis indicates that while both ventricles exhibit upregulation of extracellular matrix remodeling-related genes, the RV primarily shows downregulation of electromechanical-related genes. On the contrary, an upregulation of the inflammatory pathways was detected mainly in the LV, alongside a downregulation of mitochondrial metabolism-related genes.

Conclusions: Our findings revealed that both ventricles showed structural remodeling but only the RV underwent electromechanical alteration, while the LV displayed metabolic and inflammatory alteration. This was further validated by the preserved EF in the advanced stage of PAH. Our work highlights that a more comprehensive understanding of PAH pathophysiology can lead to targeted therapeutic strategies, challenging the conventional RV-centric perspective.

Keywords: Electromechanical coupling; Monocrotaline; Pulmonary hypertension; RNA sequencing; Refractoriness.


Conflict of interest statement

Declarations. Ethics approval and consent to participate: The study was performed following experimental protocols reviewed and approved by the Italian Ministry of Health (approved protocols: PMS53/2009, 281/2017, 989/2017, 397/2022-PR), under strict compliance with Italian (D.L.4/3/2014) and European (2010/63/UE) guidelines for ethical use of animal models in biological research. Consent for publication: Not applicable. Competing interests: GR and FPLM are the CEO and shareholder of the startup JEM Tech S.r.l., respectively.

Figures
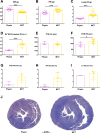
Fig. 1
Fig. 1
Anatomical and histological parameters in Physio (pink circle) and MCT (yellow square) treated animals. A Body weight (BW), Physio n = 16, MCT n = 18. B Heart weight (HW), Physio n = 16, MCT n = 18. C Lungs weight (Lungs W), Physio n = 16, MCT n = 18. D Fulton Index (RV W/LV + septum W), Physio n = 10, MCT n = 10. E Left ventricle free wall thickness (TFW LV), Physio n = 6, MCT n = 8. F Right ventricle free wall thickness (TFW RV), Physio n = 6, MCT n = 8. G Total fibrosis, Physio n = 3, MCT n = 5. H Right ventricle fibrosis (RV fibrosis), Physio n = 3, MCT n = 5. I Left ventricle fibrosis (LV fibrosis), Physio n = 3, MCT n = 5. J Trichrome staining of equatorial section of Physio (left panel) and MCT (right panel) treated animals. Normally distributed data (A, B, D, and F) were presented as mean of biological replicates ± SEM and were analyzed by Student’s unpaired t test. Not normally distributed data (C, E, G, H, and I) were presented as median of biological replicates ± interquartile range (Q1 = 25%, Q3 = 75%) and were analyzed by Mann–Whitney test. *p < 0.05 and ***p < 0.001
Fig. 2
Fig. 2
Electrophysiological and kinematic parameters in Physio (pink circle) and MCT (yellow square) treated animals. A P wave duration, Physio n = 14, MCT n = 11. B Activation Time (AT), Physio n = 14, MCT n = 11. C QRS complex duration (QRS), Physio n = 14, MCT n = 11. D QRS complex duration after epicardial point stimulation (QRSstim), Physio n = 14, MCT n = 11. E RT interval duration, Physio n = 14, MCT n = 11. F Corrected QT Interval with Bazett formula (QTc), Physio n = 14, MCT n = 11. G T wave duration, Physio n = 14, MCT n = 11. H R peak dissociation (RR dissoc), Physio n = 14, MCT n = 11. I Energy, Physio n = 7, MCT n = 8. J Force, Physio n = 7, MCT n = 8. K Maximum contraction velocity, Physio n = 7, MCT n = 8. L Perimeter, Physio n = 7, MCT n = 8. Normally distributed data (CL) were presented as mean of biological replicates ± SEM and analyzed by Student’s unpaired t test. Not normally distributed data (A and B) were presented as median of biological replicates ± Interquartile range (Q1 = 25%, Q3 = 75%) and analyzed by Mann–Whitney test. *p < 0.05, **p < 0.01, and ***p < 0.001
Fig. 3
Fig. 3
Excitability, refractoriness, conduction velocities and electromechanical delay (EMD) evaluation in Physio and MCT treated animals. A Threshold strength of a 1 ms duration stimulus, Physio n = 14, MCT n = 11. B Effective refractory period (ERP), Physio n = 14, MCT n = 11. C Epicardial conduction velocity computed longitudinally (CVl) to fiber orientation, Physio n = 14, MCT n = 11. D Epicardial conduction velocity computed transversally (CVt) to fiber orientation, Physio n = 14, MCT n = 11. E schematic representation of the experimental setup for the evaluation of the electromechanical coupling. Created with BioRender.com. F Assessment of EMD. Top graph, electrocardiogram recorded after unipolar stimulation (blue trace); middle graph, videocardiogram (brown trace); bottom graph, overlay of electrical and mechanical traces for the evaluation of EMD. EO: Electrical Onset; MO: Mechanical Onset; EMD = MO-EO. G: EMD measurement, Physio n = 8, MCT n = 6 and n = 4 for RV and LV, respectively. All parameters were recorded during epicardial right ventricular stimulation (RV, light blue) and epicardial left ventricular stimulation (LV, aquamarine) in both Physio (circle) and MCT (square) animals. Data are presented as median of biological replicates ± Interquartile range (Q1 = 25%, Q3 = 75%) or mean of biological replicates ± SEM. Two-way analysis of variance (ANOVA) followed by Tukey correction was used to analyze the differences between groups (Physio and MCT) and stimulated ventricle (RV and LV). *p < 0.05, **p < 0.01 and ***p < 0.001
Fig. 4
Fig. 4
Gene expression profiling of left and right ventricles in response to MCT treatment. A and B Principal Component Analysis (PC1 vs PC2, A) showing the clusters of heart samples belonging to rats treated with MCT (light gold, dark gold, n = 4) or physiological solution (light orchid, dark orchid, n = 5). Left (light gold) and right (dark gold) ventricles of MCT-treated rats belong to separate groups (PC1 vs PC3, B). C Pearson correlation matrix. Correlation analysis between PC1, PC2, and PC3 with the anatomical, kinematics and cardiac parameters. Only parameters with correlation < − 0.4 and > 0.4 are shown (negative correlations in cyan and positive correlations in dark pink). Significant correlations are marked with ** (BH adj. p < 0.01) or with *** (BH adj. p < 0.001) D Number of the Differentially Expressed Genes (DEG) identified by the comparative transcriptomic profiles of the different treatments (RM = Right ventricle of MCT treated animal, LM = Left ventricle of MCT treated animal, RP = Right ventricle of Physiological solution treated animal, and LP = Left ventricle of Physiological solution treated animal). The up-regulated (UP) and down-regulated (DN) genes are shown in orange and green, respectively. E Venn diagrams showing the up-regulated (left panel) and down-regulated (right panel) genes shared between the Left and Right ventricles in the two comparisons (MCT vs Physio). F and G Heatmap representing DEG (MCT vs Physio) expression levels in the Left ventricles (F) and the Right ventricles (G). z-score-normalized expression level is indicated on a low-to-high scale (dark green–white–dark orange)
Fig. 5
Fig. 5
Altered processes induced by MCT treatment in the left and right ventricles. A Enrichment map representing significantly dysregulated pathways depicted as a network. Each node represents a term, and the edges represent the connection between terms based on shared genes. The size of the nodes corresponds to the number of genes, and the color scale indicates activated (orange) or inhibited (green) pathways as -Log q-value (see also Figure S6). The thickness of the edges reflects the similarity score. B Results of pathway enrichment analysis conducted on DEGs resulting from MCT (n = 4) vs physiological solution (n = 5) comparisons in LV and RV. Enriched pathways are grouped into the four key processes depicted in (A). The color represents the enrichment significance, as in (A). C Heatmap of expression levels of genes involved in voltage-gated channel activity. The z-score-normalized expression levels are depicted on a scale from low to high (green-white-orange). Individual sample lung weights and discomfort scores are indicated on a scale from minimum to maximum values (cyan-white-dark pink). Significantly up-regulated or down-regulated genes are marked on the right with orange or green squares, respectively

References

    1. Maron BA. Inhibiting serotonin to treat pulmonary arterial hypertension: an exciting new chapter in an old story. JACC Basic Transl Sci. 2023;8:1389–91. - PMC - PubMed
    1. Guazzi M. Pulmonary hypertension in heart failure preserved ejection fraction: prevalence, pathophysiology, and clinical perspectives. Circ Heart Fail. 2014;7:367–77. - PubMed
    1. Kogler H, Hartmann O, Leineweber K, van Nguyen P, Schott P, Brodde OE, Hasenfuss G. Mechanical load-dependent regulation of gene expression in monocrotaline-induced right ventricular hypertrophy in the rat. Circ Res. 2003;93:230–7. - PubMed
    1. Benoist D, Stones R, Drinkhill M, Bernus O, White E. Arrhythmogenic substrate in hearts of rats with monocrotaline-induced pulmonary hypertension and right ventricular hypertrophy. Am J Physiol Heart Circ Physiol. 2011;300:H2230-2237. - PMC - PubMed
    1. Hardziyenka M, Campian ME, de Bruin-Bon HA, Michel MC, Tan HL. Sequence of echocardiographic changes during development of right ventricular failure in rat. J Am Soc Echocardiogr. 2006;19:1272–9. - PubMed

LinkOut - more resources