. 2025 Jul 12;32(1):67.
doi: 10.1186/s12929-025-01163-5.

Obesity induces phenotypic switching of gastric smooth muscle cells through the activation of the PPARD/PDK4/ANGPTL4 pathway

Affiliations

Obesity induces phenotypic switching of gastric smooth muscle cells through the activation of the PPARD/PDK4/ANGPTL4 pathway

Sanaa Dekkar et al. J Biomed Sci. .

Abstract

Background: Clinical research has identified stomach dysmotility as a common feature of obesity. However, the specific mechanisms driving gastric emptying dysfunction in patients with obesity remain largely unknown. In this study, we investigated potential mechanisms by focusing on the homeostasis of gastric smooth muscle.

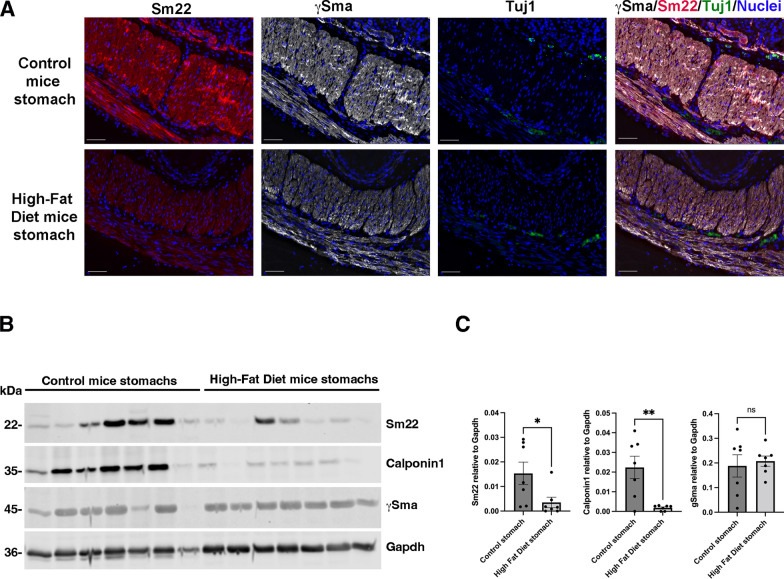
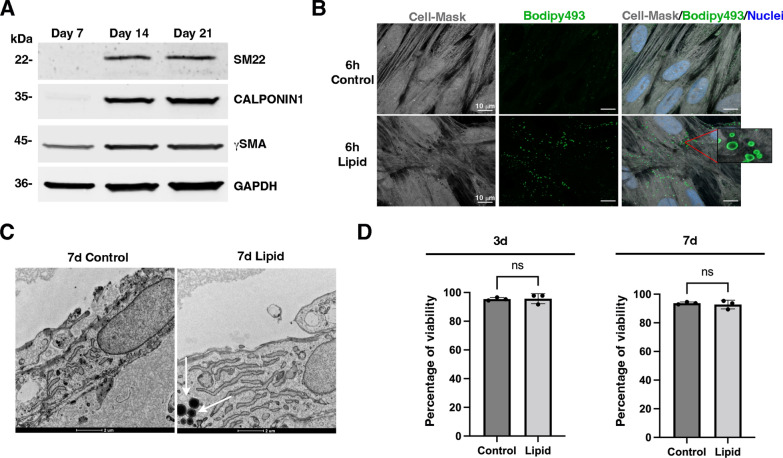
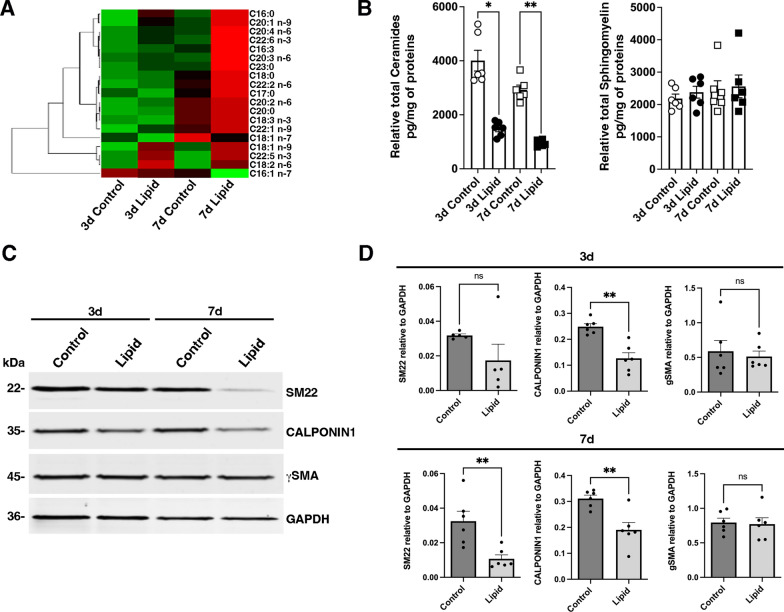
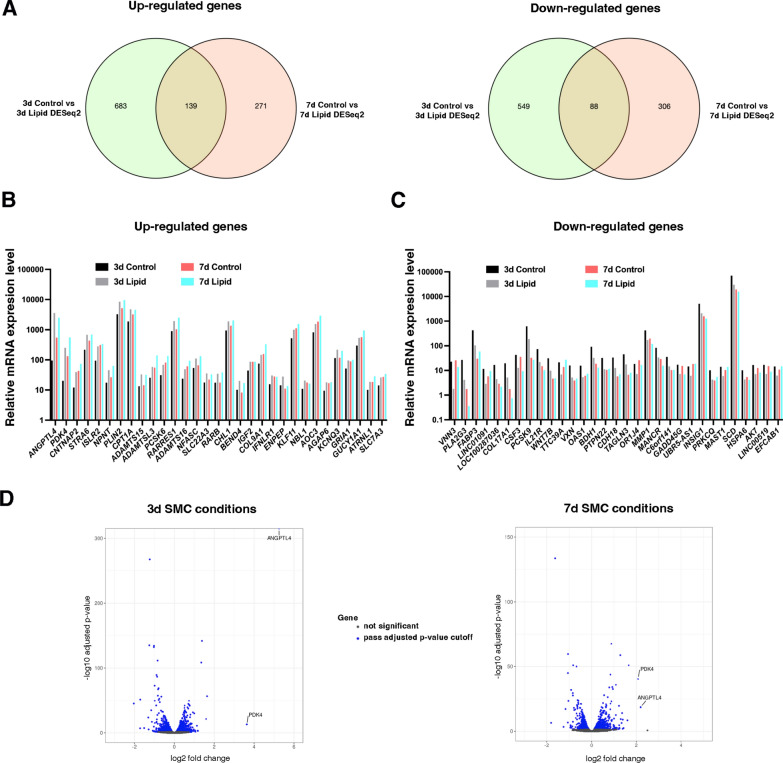
Methods: An obese mouse model was established using a high-fat diet (HFD). Immunofluorescence analysis and Western blotting were employed to assess smooth muscle status using stage-specific markers. An in vitro culture model of differentiated human gastric smooth muscle cells (SMCs) was treated with lipids, siRNA-peptide-based nanoparticles and pharmaceutical compounds. Global lipidomic and RNA sequencing analyses were performed. The findings were evaluated in patients with obesity, using gastric samples from individuals who underwent sleeve gastrectomy, to evaluate their clinical relevance.

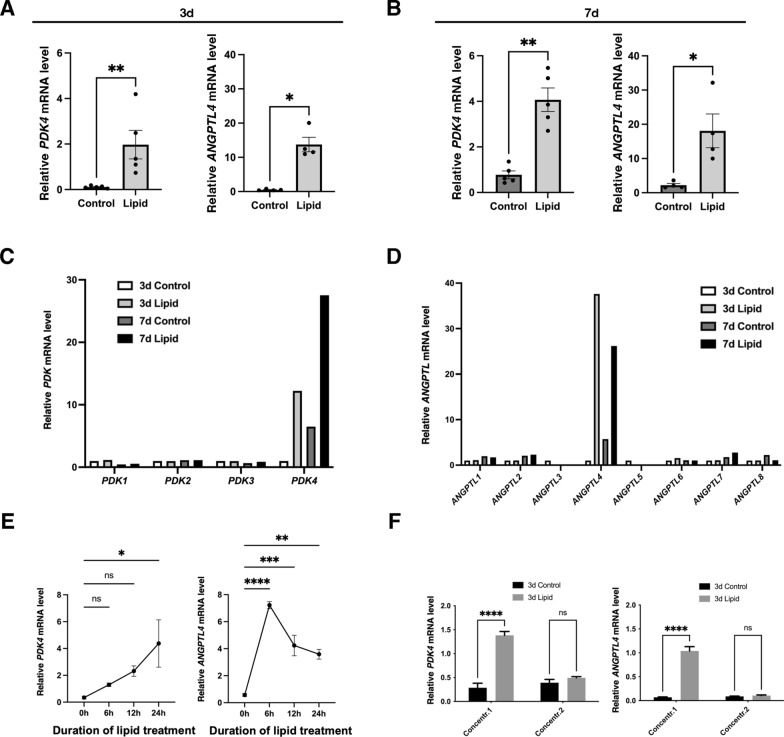
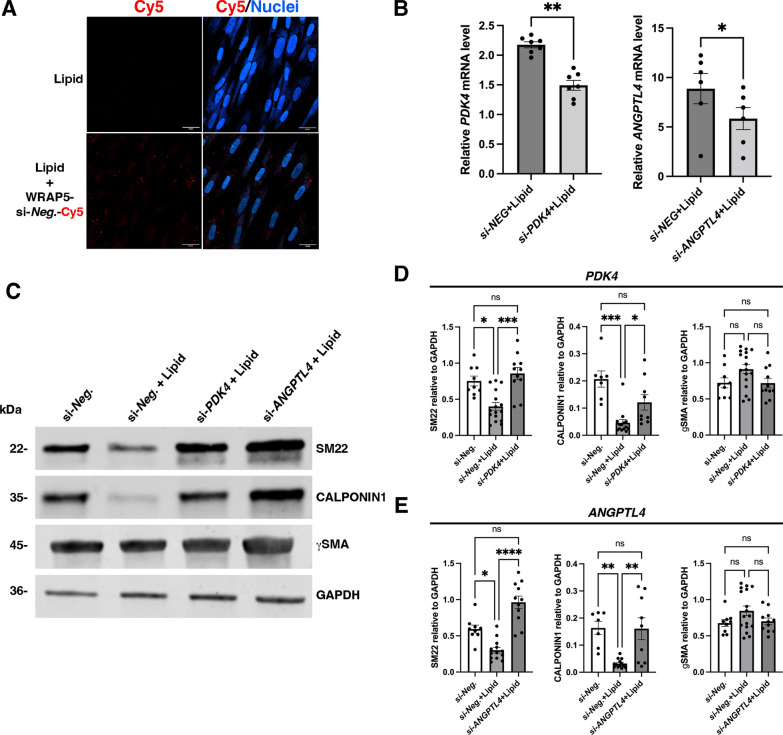
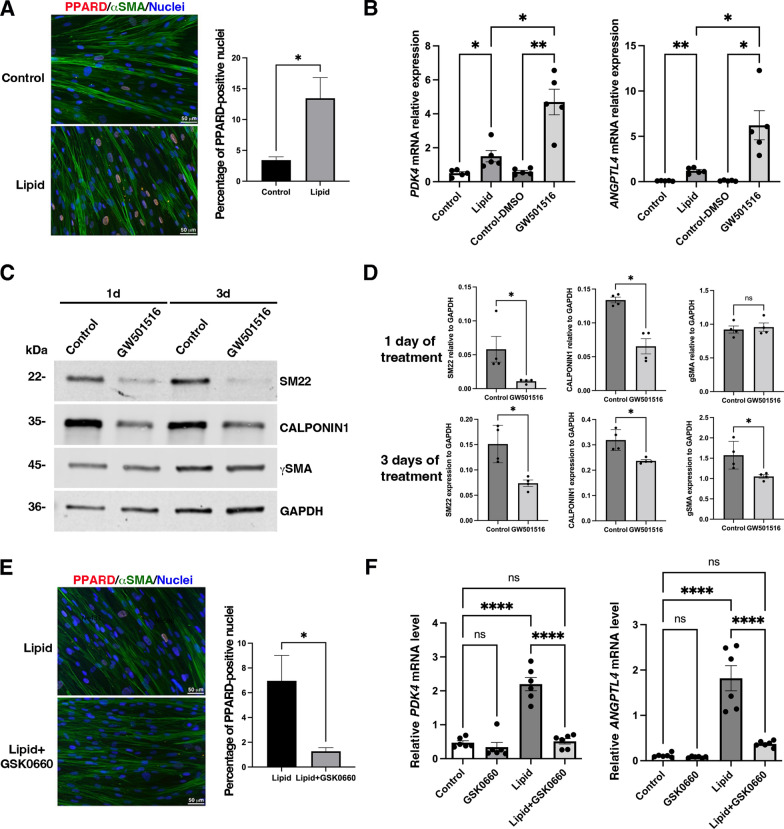
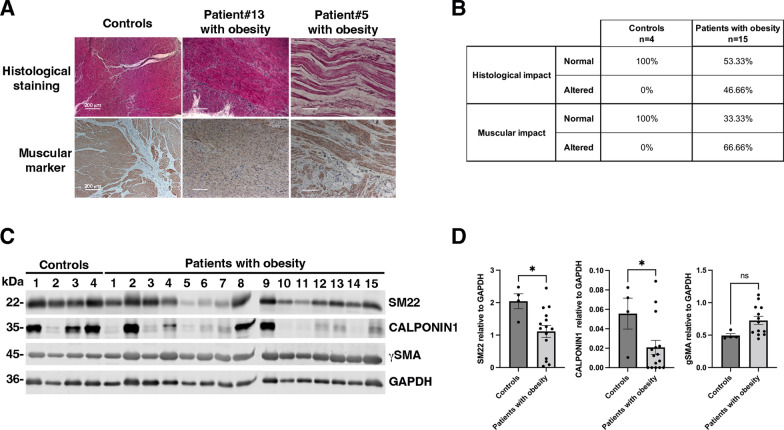
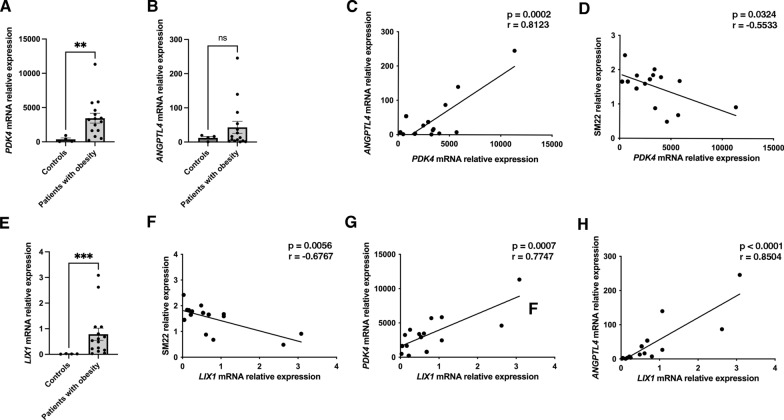
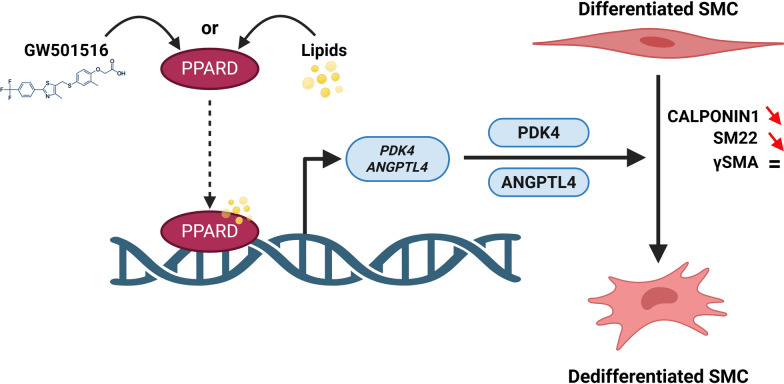
Results: The smooth muscle layers in gastric tissue from both mice fed on a HFD as well as patients with obesity exhibited altered differentiation status. Treatment of differentiated human gastric SMCs with lipids phenocopies these alterations and is associated with increased expression of PDK4 and ANGPTL4. Inhibition of PDK4 or ANGPTL4 upregulation prevents these lipid-induced modifications. PPARD activation stimulates PDK4 and ANGPTL4 upregulation, leading to SMC dedifferentiation. Notably, PDK4 and ANGPTL4 levels correlate with immaturity and alteration of gastric smooth muscle in patients with obesity.

Conclusions: Obesity triggers a phenotypic change in gastric SMCs, driven by the activation of the PPARD/PDK4/ANGPTL4 pathway. These mechanistic insights offer potential biomarkers for diagnosing stomach dysmotility in patients with obesity.

Keywords: Immaturity; Obesity; PDK4/ANGPTL4/PPARD pathway; Smooth muscle; Stomach.


Conflict of interest statement

Declarations. Ethics approval and consent to participate: This study involves human participants. The biological collection was registered with the French Ministry (numbers DC 2015–2473 and AC 2016–2760). Consent for publication: Not applicable. Competing interests: The authors declare that they have no competing interests.

Figures

Fig. 1
Fig. 1
Evaluation of the differentiation status of gastric smooth muscle in HFD-induced obese mice. A Representative immunofluorescence staining of smooth muscle (Sm22 and gSma) and enteric neuron (Tuj1) markers in control (upper panels) and HFD (lower panels) mouse stomach section. Scale bars: 50 mm. Immunofluorescence analysis highlighted a reduced level of Sm22 in the stomach musculature of HFD mice compared to controls, whereas the expression level of gSma remained unchanged. No change in smooth muscle layer organization was observed. We also found the presence of myenteric neurons (Tuj1 positive clusters) in both conditions. B Representative Western-blot image of whole stomach extracts from adult mice fed with a HFD for 12 weeks (n = 7), and from controls (n = 7) probed with antibodies directed against specific smooth muscle proteins (Sm22, Calponin1, and gSma) and against Gapdh as loading control. C Quantification of the Western-blot (B) comparing extracts from HFD stomach extracts from controls. Data are presented as the mean ± SEM (two-tailed Mann–Whitney test; *P < 0.05; **P < 0.01). The expression of Sm22 and Calponin1 was significantly lower in HFD compared to control condition (B, C)
Fig. 2
Fig. 2
Development and characterization of human gastric differentiated smooth muscle cells. Human gastric SMCs were cultured on Collagen Type I plates over time to promote their differentiation. A Representative Western blot of human gastric SMC extracts from 7-, 14- and 21-days of culture probed with antibodies directed against specific smooth muscle proteins (SM22, CALPONIN1, and gSMA) and against GAPDH as loading control. B 14-day human gastric SMCs were incubated with lipid treatment for 6 h, followed by staining with Bodipy493/503 and Cell-Mask Red stain 588/612 for 30 min, and nuclei staining with Hoechst. Scale bars: 10 mm. Numerous lipid structures within lipid-treated SMCs were detected with Bodipy staining (see zoomed insert) by confocal microscopy. C 14-day human gastric SMC cultures with or without lipid treatment for 7 days were analyzed by transmission electron microscopy. White arrows indicate the presence of lipid droplets observed only in the lipid-treated conditions. Scale bars: 2 mm. D Cell viability of human gastric SMC cultures after 14 days with or without lipid treatment for an additional 3 or 7 days was evaluated by flow cytometry following differential DNA-binding dye staining. No significant impact on cell viability was observed after 3 days or 7 days of lipid treatment. Data are presented as the mean ± SEM and Mann–Whitney was applied (ns > 0.05)
Fig. 3
Fig. 3
Impact of lipid treatment on human gastric smooth muscle cells. A Heat map of fatty acids quantified in SMCs with or without lipid treatment for an additional 3 and 7 days. The data is shown in a matrix format: each row represents a single lipid, and each column represents a SMC treatment: control day 3, lipid day 3, control day 7, and lipid day 7. Each color patch represents the normalized quantity of lipid (row) in treated SMC (column), with a gradient from bright green (lowest) to bright red (highest). The pattern and length of the branches in the left dendrogram reflect the relatedness of the lipids. All data were normalized to the quantity of protein (pg/mg of proteins). B Levels of total ceramides (left panel) and total sphingomyelins (right panel) quantified in SMCs with or without lipid treatment for an additional 3 and 7 days. All data were normalized to the quantity of protein (pg/mg of proteins). Values are the mean ± SEM of n = 6 samples. *P < 0.05 and **P < 0.01 (non-parametric Kruskall-Wallis test with Dunn’s multiple comparison test). C Representative Western blot of human gastric SMC extracts after 14 days of culture with or without lipid treatment for an additional 3 or 7 days probed with antibodies directed against specific smooth muscle proteins (SM22, CALPONIN1, and gSMA) and against GAPDH as loading control. D Quantification of Western blot assays comparing extracts from lipid-treated SMCs to extracts from control SMCs. Data are presented as the mean ± SEM and two-tailed Mann–Whitney test was applied (*P < 0.05; ns > 0.05). CALPONIN1 expression was significantly reduced after 3 days, while SM22 was significantly lower only after 7 days of treatment (C, D)
Fig. 4
Fig. 4
Identification of the molecular mechanism induced by lipid treatment in human gastric SMC. A Venn diagram depicting the number of genes up-regulated (left panel) and down-regulated (right panel) identified at 3 days and 7 days post-lipid treatment using a significance cutoff of p < 0.01. For both times, 139 genes were up-regulated, and 88 genes were down-regulated in response to lipid treatment. Relative mRNA expression of upregulated (B) and downregulated (C) genes identified by RNA sequencing using a significance cutoff of p < 0.01 in human gastric SMC cultures with or without lipid treatment for 3 and 7 days. Average of n = 3 (B, C). D Volcano plot showing differentially expressed genes between human gastric SMCs treated with lipid for 3 days (left panel) or 7 days (right panel) compared to untreated SMCs. Blue dots indicate genes with a significance cutoff of p < 0.01. Among them, upregulation of PDK4 and ANGPTL4 levels are found in both time conditions
Fig. 5
Fig. 5
PDK4 and ANGPTL4 are highly induced by lipid treatment in human gastric SMCs. A RT-qPCR of PDK4 and ANGPTL4 relative mRNA level in human gastric SMC cultures with or without lipid treatment for 3 days. Data were normalized to the house-keeping HMBS expression. Values are presented as the mean ± SEM of n = 4–5 samples. Statistically significant differences are indicated as *P < 0.05 and ***P < 0.001 (two-tailed Mann–Whitney test). After 3 days of lipid treatment, PDK4 and ANGPTL4 levels were stimulated 13-fold and 29-fold, respectively. B RT-qPCR of PDK4 and ANGPTL4 relative mRNA level in human gastric SMC cultures with or without lipid treatment for 7 days. Data were normalized to the house-keeping HMBS expression. Values are the mean ± SEM of n = 4–5 samples. Statistically significant differences are indicated as *P < 0.05 and ***P < 0.001 (two-tailed Mann–Whitney test). After 7 days of lipid treatment, PDK4 and ANGPTL4 levels were stimulated fivefold and eightfold, respectively. C Relative mRNA expression of PDK members determinates by RNA sequencing from human gastric SMC cultures with or without lipid treatment for 3 and 7 days. Average of n = 3. D Relative mRNA expression of ANGPTL members determinates by RNA sequencing from human gastric SMC cultures with or without lipid treatment for 3 and 7 days. Average of n = 3. E Time-course stimulation of PDK4 and ANGPTL4 mRNAs under lipid treatment. RT-qPCR of PDK4 (left panel), and ANGPTL4 (right panel) relative mRNA expression in human gastric SMC cultures before treatment (0 h) and after 6, 12 and 24 h with lipid treatment. Values are the mean ± SEM of n = 4 samples. ****P < 0.001; ***P < 0.001; **P < 0.01; *P < 0.05; ns > 0.05 (Ordinary one-way Anova test). PDK4 stimulation is associated with linear increase, where ANGPTL4 harbors a strong induction before a sustained statistic stimulation. F RT-qPCR of PDK4 (left panel), and ANGPTL4 (right panel) relative mRNA expression in human gastric SMC cultures treated for 3 days with lipid treatment at normal concentration (Concentr. 1), and at dilution 1/4 (Concentr. 2). Data were normalized to house-keeping HMBS expression. Values are the mean ± SEM of n = 4 samples. ****P < 0.001; *P < 0.05; ns > 0.05 (Kruskal–Wallis test followed by Dunn’s multiple comparisons test)
Fig. 6
Fig. 6
Function of the molecular mechanism induced by lipid treatment in human gastric SMCs. A 14-day human gastric SMC cultures were first incubated with WRAP-complexed Scrambled siRNA labeled with Cy5 (WRAP5 + si-Neg.-Cy5) during 2 h then cultures were treated with lipids. Following Hoechst staining, non-fixed cultures were directly analyzed using confocal microscopy. Scale bars: 24 mm. Many red dots detected with Cy5 staining were found in lipid-treated SMCs. B RT-qPCR of PDK4 and ANGPTL4 relative mRNA expression in human gastric SMC cultures under 3-day lipid treatment with Control siRNA (si-NEG) and specific siRNA directed against PDK4 (si-PDK4) and ANGPTL4 (si-ANGPTL4). Data were normalized to house-keeping HMBS expression. Values are the mean ± SEM of n = 7 samples. *P < 0.05 and **P < 0.01 (two-tailed Mann–Whitney test). PDK4 and ANGPTL4 stimulation are respectively diminished by 34% and 36% after 3 days of respective siRNAs under lipid treatment. C Representative Western blot of human gastric SMC extracts treated for 3 days with si-Neg. alone (control), si-Neg. + lipids, si-PDK4 + lipids and si-ANGPTL4 + lipids than probed with antibodies directed against specific smooth muscle proteins (SM22, CALPONIN1, and gSMA) and against GAPDH as loading control. D Quantification of Western blot assays comparing extracts treated for 3 days with si-Neg. alone (control), si-Neg. + lipids, and si-PDK4 + lipids. Data are presented as the mean ± SEM (nonparametric Kruskall-Wallis test with Dunn’s multiple comparison test: *P < 0.05, ***P < 0.001, ns > 0.05). The expression of SM22 and CALPONIN1 decreased in lipid-treated SMCs compared to the control condition; however, this decrease was abolished in the presence of si-PDK4. E Quantification of Western blot assays comparing extracts treated for 3 days with si-Neg. alone (control), si-Neg. + lipids, and si-ANGPTL4 + lipids. Data are presented as the mean ± SEM (nonparametric Kruskall-Wallis test with Dunn’s multiple comparison test: *P < 0.05, **P < 0.01, ***P < 0.001, ns > 0.05). The expression of SM22 and CALPONIN1 decreased in lipid-treated SMCs compared to the control condition; however, this decrease was abolished in the presence of si-ANGPTL4
Fig. 7
Fig. 7
Identification of PPARD activation in the regulation of the expression of PDK4 and ANGTPL4 mRNA expression under lipid treatment. A Immunofluorescence analysis of human gastric SMC cultures treated with lipid for 2 days compared to untreated controls, stained for PPARD and aSMA. Nuclei were visualized using Hoechst staining. Scale bars: 50 mM. The right panel shows a fourfold increase in the percentage of nuclear PPARD-positive SMCs following lipid treatment. B RT-qPCR of PDK4 (left panel) and ANGPTL4 (right panel) relative mRNA expression in human gastric SMC cultures treated for 3 days with or without lipid treatment, and with GW501516 (PPARD agonist, 1 mM) or DMSO as Control. Data were normalized to house-keeping HMBS expression. Values are the mean ± SEM of n = 5 samples. **P < 0.01; *P < 0.05; ns > 0.05 (One way ANOVA, multiple comparison test). PDK4 and ANGPTL4 levels were respectively threefold and fivefold more stimulated in GW501516 condition compared to lipid conditions. C Representative Western blot of human gastric SMC extracts from 14 days of culture with or without GW501516 treatment for additive 1 day or 3 days probed with antibodies directed against SM22, CALPONIN1, and gSMA and GAPDH as loading control. D Quantification of Western blot assays (n = 6) comparing extracts from GW501516-treated SMCs to extracts from control SMCs. Data are presented as the mean ± SEM and two-tailed Mann–Whitney test was applied (**P < 0.01, *P < 0.05, ns > 0.05). Significant reductions in SM22 and CALPONIN1 protein levels were observed after 1 and 3 days of treatment, with γSMA significantly lower only after 3 days. E Immunofluorescence analysis of human gastric SMC cultures treated for 1 day with lipids alone or in combination with GSK0660 (5 mM), stained for PPARD and aSMA. Nuclei were visualized using Hoechst staining. Scale bars: 50 mM. The right panel shows that lipid + GSK0660 treatment reduced the percentage of nuclear PPARD-positive SMCs by sixfold. F RT-qPCR of PDK4 (left panel) and ANGPTL4 (right panel) relative mRNA levels in human gastric SMC cultures treated for 3 days with GSK0660 (PPARD antagonist, 5 mM), with lipid, and with lipid + GSK0660 compared to untreated SMC (Control). Data were normalized to the house-keeping HMBS expression. Values are the mean ± SEM of n = 6 samples. ****P < 0.0001, ns > 0.05 (One way ANOVA, multiple comparison test). PDK4 and ANGPTL4 stimulation induced by lipid treatment were significantly reduced when combined with GSK0660, approaching control level
Fig. 8
Fig. 8
Evaluation of the differentiation status of human gastric smooth muscle in patients with obesity. A) Representative Hematoxylin and Eosin staining (upper panels), immunohistochemical staining of smooth muscle marker CALPONIN1 (lower panels) of stomach sections from adult patients with obesity (n = 15), and from lean adults with gastric epithelial cancer (controls; n = 4). 10 of 15 patients with obesity exhibited alteration in the expression and organization of gastric smooth muscle. B Summary of the histological evaluation of stomach sections from adult patients with obesity (n = 15) and adult controls (n = 4) using Hematoxylin and Eosin staining, along with immunohistochemical staining for the smooth muscle marker CALPONIN1. After staining, gastric smooth muscle was evaluated and scored independently for their organization into normal, and affected regions by three pathologists and consensus was reported. C Western-blotting of gastric smooth muscle fiber extracts from adult patients with obesity (n = 15), and from controls (n = 4) probed with antibodies directed against specific smooth muscle proteins (SM22, CALPONIN1, and gSMA) and against GAPDH as loading control. D Quantification of Western-blot assays (C) comparing extracts from adult patients with obesity (n = 15) to extracts from controls (n = 4). Data are presented as the mean ± SEM (two-tailed Mann–Whitney test; *P < 0.05). Notably, the expression of SM22 and CALPONIN1 were found significantly lower in patients with obesity compared to controls
Fig. 9
Fig. 9
Evaluation of the expression of PDK4, ANGPTL4 and LIX1 expression and their correlation in patients with obesity. A Relative mRNA level of PDK4 in gastric smooth muscle fiber extracts from adult patients with obesity (n = 15) compared to controls (n = 4) was assessed by RT-qPCR. Data were normalized to the levels of the housekeeping gene HMBS. Values are presented as mean ± SEM, and statistical analysis was performed using a two-tailed Mann–Whitney test (**P < 0.01). PDK4 level was found to be 13-fold upregulated in patients with obesity. B Relative mRNA expression of ANGPTL4 in gastric smooth muscle fiber extracts from adult patients with obesity (n = 15) and controls (n = 4) was evaluated by RT-qPCR. Data were normalized to HMBS level, presented as mean ± SEM, and analyzed using a two-tailed Mann–Whitney test (ns > 0.05). ANGPTL4 level showed a 3.5-fold increase in patients with obesity. C, D The correlation between PDK4 and ANGPTL4 levels (C), as well as between PDK4 level and SM22 expression D, was analyzed using Pearson’s correlation test. P and R values are indicated on each graph. Positive correlation was observed between PDK4 and ANGPTL4, while a negative correlation was identified between PDK4 and SM22. E Relative mRNA level of LIX1 in gastric smooth muscle fiber extracts from adult patients with obesity (n = 15) and controls (n = 4) was assessed by RT-qPCR. Data were normalized to HMBS level, presented as mean ± SEM, and analyzed using a two-tailed Mann–Whitney test (***P < 0.001). LIX1 level was found to be 22-fold upregulated in patients with obesity. (F–H) The correlation between LIX1 and SM22 expression (F), or PDK4 (G) and ANGPTL4 (H) levels were calculated by Pearson’s correlation test. P and R values are indicated on each graph. A negative correlation was observed between LIX1 and SM22 expression, while positive correlations were observed between LIX1 and both PDK4 and ANGPTL4
Fig. 10
Fig. 10
Schematic model of the pathway leading to alterations in gastric smooth muscle in patients with obesity. Upon lipid exposure or specific agonist (GW501516), the ligand-activated transcription factor PPARD becomes active. These regulations correlate with the nuclear translocation shuttling of the PPARD protein, supporting a potential transcriptional control at the peroxisome proliferator response elements (PPREs) of PDK4 and ANGPTL4 promoter, which still needs to be validated in our model. Upregulation of PDK4 and ANGPTL4 is crucial for initiating the dedifferentiation process of gastric SMCs observed in patients with obesity

Similar articles

References

    1. NCD Risk Factor Collaboration (NCD-RisC). Worldwide trends in underweight and obesity from 1990 to 2022: a pooled analysis of 3663 population-representative studies with 222 million children, adolescents, and adults. Lancet. 2024;403:1027–50. - PMC - PubMed
    1. Afshin A, Reitsma MB, Murray CJL. Health Effects of Overweight and Obesity in 195 Countries. N Engl J Med. 2017;377:1496–7. - PubMed
    1. Acosta A, Abu Dayyeh BK, Port JD, Camilleri M. Recent advances in clinical practice challenges and opportunities in the management of obesity. Gut. 2014;63:687–95. - PMC - PubMed
    1. Acosta A, Camilleri M. Gastrointestinal morbidity in obesity. Ann N Y Acad Sci. 2014;1311:42–56. - PMC - PubMed
    1. Delgado-Aros S, Locke GR, Camilleri M, Talley NJ, Fett S, Zinsmeister AR, et al. Obesity is associated with increased risk of gastrointestinal symptoms: a population-based study. Am J Gastroenterol. 2004;99:1801–6. - PubMed

Substances