Randomized Controlled Trial
. 2025 Oct 1:209:112831.
doi: 10.1016/j.exger.2025.112831. Epub 2025 Jul 11.

Sustaining neuromuscular activation after total knee arthroplasty preserves skeletal muscle fiber size, contractility, and innervation in older adults

Affiliations
Randomized Controlled Trial

Sustaining neuromuscular activation after total knee arthroplasty preserves skeletal muscle fiber size, contractility, and innervation in older adults

Michael J Toth et al. Exp Gerontol. .

Abstract

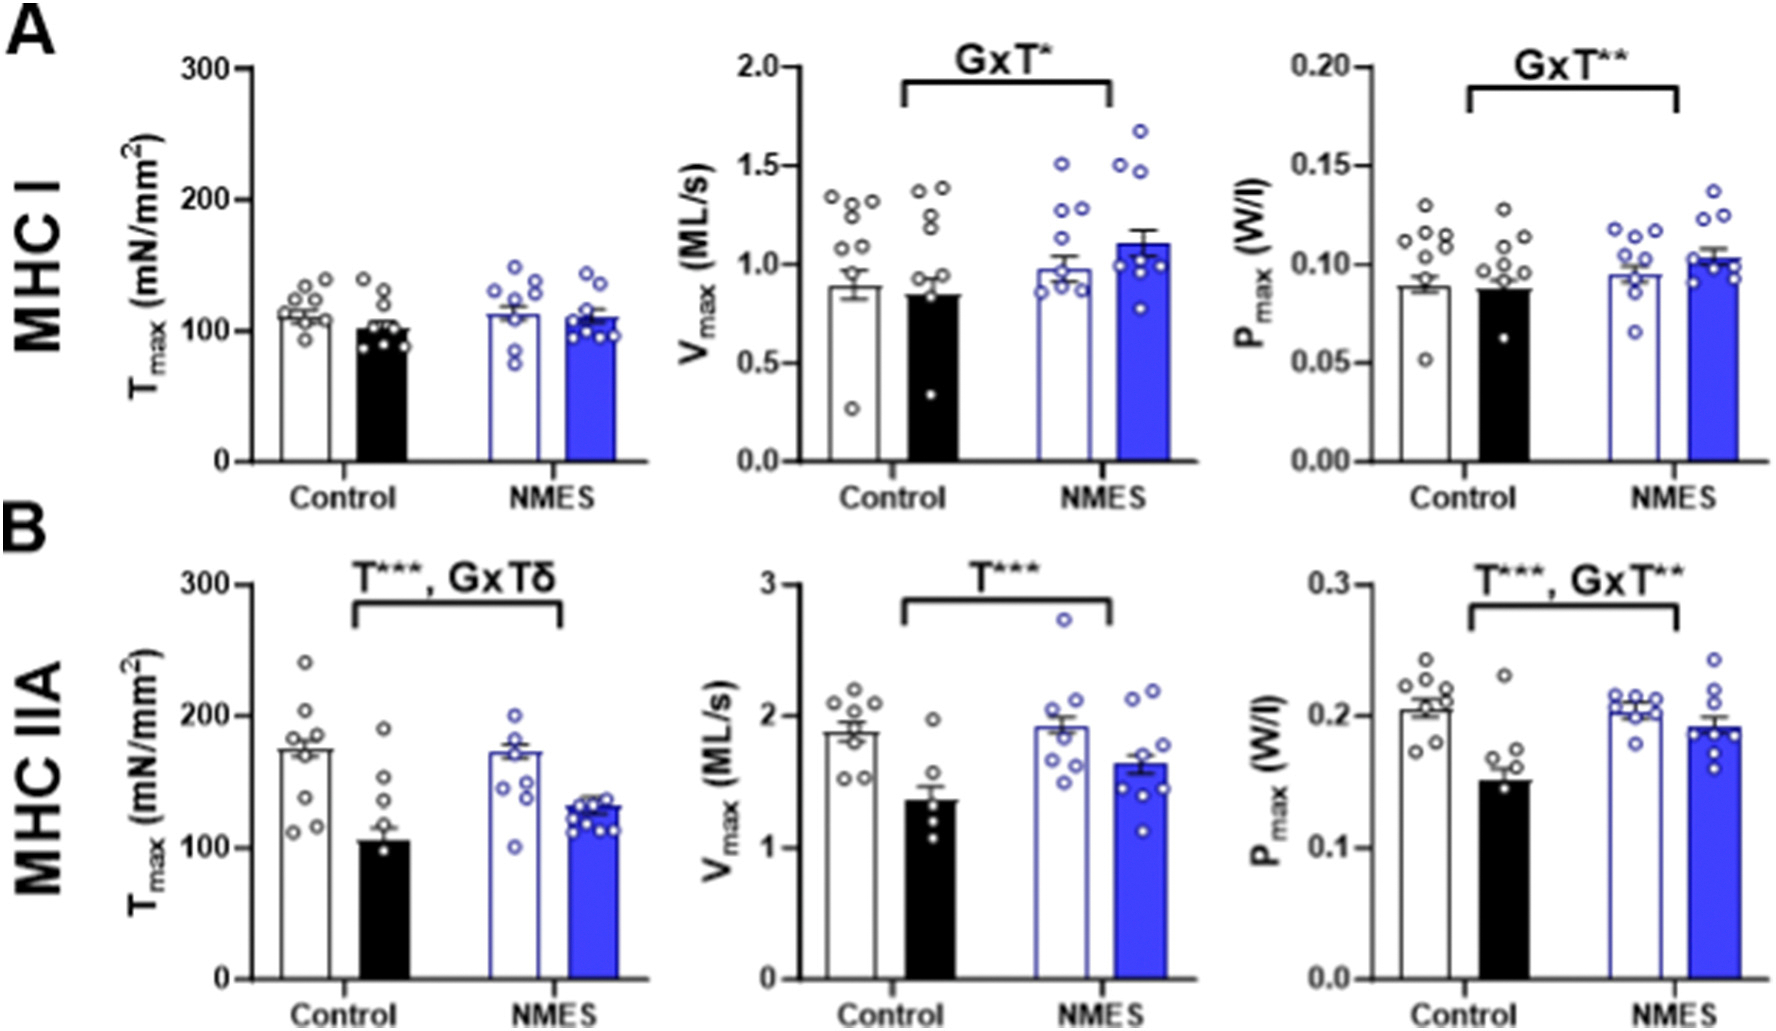
Knee osteoarthritis (OA) is the leading cause of physical disability in older adults. Total knee arthroplasty (TKA) is a common treatment for advanced stage knee OA that alleviates knee pain, but it is associated with precipitous reductions in physical function early after surgery that can take months or years to recover. Sustaining neuromuscular activation after surgery with neuromuscular electrical stimulation (NMES) can improve recovery of physical function, but the mechanisms underlying its benefits are unclear. To examine the unique effects of NMES on skeletal muscle, we randomized older adult patients (70 % female) to early NMES (n = 11) or no intervention (n = 12) for 5 weeks after surgery. We measured skeletal muscle (vastus lateralis) fiber size, contractility, mitochondrial content, and mRNA abundance pre-surgery and 5 weeks post-surgery. NMES diminished TKA-induced muscle fiber atrophy in fast-twitch, myosin heavy chain (MHC) IIA fibers and improved or preserved single muscle fiber contractility in MHC I and MHC IIA fibers, respectively. In MHC IIA fibers, the beneficial effects of NMES to sustain fiber force production were explained at the molecular level by preservation of strongly bound, myosin-actin crossbridges. Additionally, TKA-induced increases in markers of denervation (CHRNA1 and MYOG) in controls were prevented by NMES. Our results identify beneficial effects of sustaining neuromuscular activation early, post-TKA with NMES on skeletal muscle fiber size and function and potential molecular mechanisms underlying these effects.

Keywords: Denervation; Disablement; Myosin; Rehabilitation.


Conflict of interest statement

Declaration of competing interest The authors declare no conflicts of interest.

Figures

Fig. 1.
Fig. 1.
Effect of NMES on the response of muscle fiber size to total knee arthroplasty (TKA). Representative immunohistochemistry images for pre-surgery and 5-wk post-surgery Control (A and B, respectively) and NMES (C and D, respectively) groups. Tissue sections treated with antibodies recognizing myosin heavy chain (MHC) I (green), MHC IIA (red), and MHC IIX (blue) isoforms are shown. As fibers expressing only MHC IIX are rare, the large majority of MHC IIX expression occurs in MHC IIAX hybrid fibers (purple). Scale bar = 50 um. Skeletal muscle fiber cross-sectional area (CSA) calculated from minimal Feret diameter (E) for all fiber types pooled together (All Fibers) and MHC I, IIA, and IIAX fibers are shown at pre-surgery (open bar) and post-surgery (filled bar) for patients in control (black) and NMES (blue) groups. Analyses were limited to fibers expressing MHC I, IIA, and IIAX isoforms because other MHC isotype fibers (MHC I/IIA, IIX, and I/IIA/IIX) were too few to permit analyses. Bars represent mean and SE from parameter estimates from the linear mixed model analysis for n = 10 patients for each time point derived, except for n = 9 patients for MHC IIAX post-surgery because one patient did not have any MHC IIAX fibers at one time point. Data points represent individual volunteer average values for single fibers clustered within each volunteer for baseline and 5-week post-surgery evaluations. Please note that these individual average data are presented for data transparency purposes only and are not utilized in the statistical analytical model. Bar graphs represent least squared means and standard error values derived from the mixed model analysis. Deviation of individual values from bars graph data are due to the fact model-derived values reflect adjustment for the effects of sex, as well as other factors. In addition, many of the measures were log transformed for analysis, and as such the least squared means and standard errors plotted were back transformed into original units. Thus, these values can be somewhat offset from those of the raw data. P values indicate time (T) and group X time (GxT) effects (atop brackets) or within group comparisons over time (over lines). *P < 0.05, ***P < 0.001. (For interpretation of the references to colour in this figure legend, the reader is referred to the web version of this article.)
Fig. 2.
Fig. 2.
Effect of NMES on the response of skeletal muscle fiber contractility at the cellular level in myosin heavy chain (MHC) I and IIA fibers (A and B, respectively) to total knee arthroplasty (TKA). Data are shown for maximal Ca2+-activated isometric tension (Tmax, or force/cross-sectional area (CSA)) and maximal velocity (Vmax) and maximal power output (Pmax) derived from isotonic load clamps at pre-surgery (open bars) and 5-wk post-surgery (filled bars) for patients randomized to control (black) and NMES (blue) groups. Analyses were limited to these fiber types because other MHC isotype fibers were too few to permit analyses. Data represent mean and SE for parameter estimates from the linear mixed model analysis for n = 8/group, except n = 7 for NMES MHC IIA data because one patient did not have any MHC IIA fibers at one time point. Data points represent individual volunteer average values for single fibers clustered within each volunteer for baseline and 5-week post-surgery evaluations. Please note that these individual average data are presented for data transparency purposes only and are not utilized in the statistical analytical model. Bar graphs represent least squared means and standard error values derived from the mixed model analysis. Deviation of individual values from bars graph data are due to the fact model-derived values reflect adjustment for the effects of sex, as well as other factors. In addition, many of the measures were log transformed for analysis, and as such the least squared means and standard errors plotted were back transformed into original units. Thus, these values can be somewhat offset from those of the raw data. P values indicate time (T) and group X time (GxT) effects (atop brackets) or within group comparisons over time (over lines). *P < 0.05, ΔP = 0.06, **P < 0.01, ***P < 0.001. (For interpretation of the references to colour in this figure legend, the reader is referred to the web version of this article.)
Fig. 3.
Fig. 3.
Effect of NMES on the response of skeletal muscle mitochondrial content and structure to total knee arthroplasty (TKA). Representative subsarcolemmal (A, B, E, F) and intermyofibrillar (C, D, G, H) images for pre-surgery (A, C, E, G) and 5-wk post-surgery (B, D, F, H) muscle sections for Control (AD) and NMES (E-H) groups are shown. Scale bars = 1 um. Data derived from electron microscopy images of muscle tissue sections include fractional area, average mitochondrion area, and number per area for subsarcolemmal (SS) and intermyofibrillar (IMF) subcellular depots (I and J, respectively). Data represent least squares mean and SE for n = 10 Control patients (black) and n = 10 NMES patients (blue) derived from the linear mixed model analysis (open and filled bars for pre-surgery and 5-wk post-surgery, respectively). Data points represent individual volunteer average values for single fibers clustered within each volunteer for baseline and 5-week post-surgery evaluations. Please note that these individual average data are presented for data transparency purposes only and are not utilized in the statistical analytical model. Bar graphs represent least squared means and standard error values derived from the mixed model analysis. Deviation of individual values from bars graph data are due to the fact model-derived values reflect adjustment for the effects of sex, as well as other factors. In addition, many of the measures were log transformed for analysis, and as such the least squared means and standard errors plotted were back transformed into original units. Thus, these values can be somewhat offset from those of the raw data. P values denote time (T) and group X time (GxT) effects (atop brackets) or within group comparisons over time (over lines). *P < 0.05, **P < 0.01, ***P < 0.001. (For interpretation of the references to colour in this figure legend, the reader is referred to the web version of this article.)
Fig. 4.
Fig. 4.
Effect of NMES on the response to total knee arthroplasty (TKA) of skeletal muscle expression of genes activated upon skeletal muscle denervation via RNA fluorescent in situ hybridization (RNA-FISH), including the acetylcholine receptor sub-unit α1 (CHRNA1) and myogenin (MYOG). Representative images for CHRNA1 (A) and MYOG (C) are shown using antibodies for laminin (green), fluorescently labeled in situ hybridization probes (red) and DAPI (blue), along with mean myonuclear intensity data for each analyte (B and D, respectively). Scale bar = 100 μm. Data represent mean and SE for n = 8 controls and n = 7 NMES patients. Data points represent individual values for volunteers for baseline and 5-week post-surgery evaluations. P value notations indicate time (T) and group X time (GxT) effects (atop brackets) or within group comparisons over time (over lines). * P < 0.05, ** P < 0.01, *** P < 0.001. (For interpretation of the references to colour in this figure legend, the reader is referred to the web version of this article.)

References

    1. Anonymous, 2009. Prevalence and most common causes of disability among adults–United States, 2005. MMWR Morb. Mortal. Wkly. Rep. 58, 421–426. - PubMed
    1. Arentson-Lantz EJ, English KL, Paddon-Jones D, Fry CS, 2016. Fourteen days of bed rest induces a decline in satellite cell content and robust atrophy of skeletal muscle fibers in middle-aged adults. J. Appl. Physiol. 120 (8), 965–975. - PMC - PubMed
    1. Avramidis K, Strike PW, Taylor PN, Swain ID, 2003. Effectiveness of electric stimulation of the vastus medialis muscle in the rehabilitation of patients after total knee arthroplasty. Arch. Phys. Med. Rehabil. 84 (12), 1850–1853. - PubMed
    1. Bade MJ, Kohrt WM, Stevens-Lapsley JE, 2010. Outcomes before and after total knee arthroplasty compared to healthy adults. J. Orthop. Sports Phys. Ther. 40, 559–567. - PMC - PubMed
    1. Bateman BT, Schmidt U, Berman MF, Bitnner EA, 2010. Temporal trends in the epidemiology of severe postoperative sepsis after elective surgery: a large, nationwide sample. Anesthesiology 112 (4), 917–925. - PubMed

Publication types

MeSH terms

Substances