. 2025 Jul 14;26(1):662.
doi: 10.1186/s12864-025-11838-w.

Expression pattern changes of three homeologs in chemokine activity enhance antiviral response to herpesvirus infection in a newly synthesized alloheptaploid

Affiliations

Expression pattern changes of three homeologs in chemokine activity enhance antiviral response to herpesvirus infection in a newly synthesized alloheptaploid

Xiao-Li Yang et al. BMC Genomics. .

Abstract

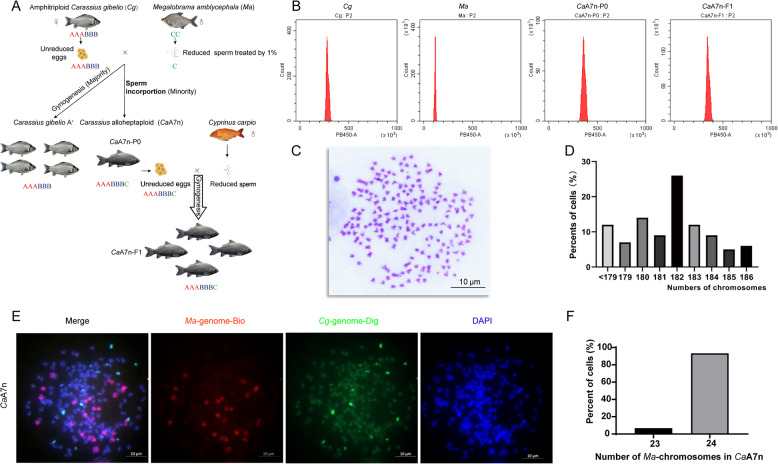
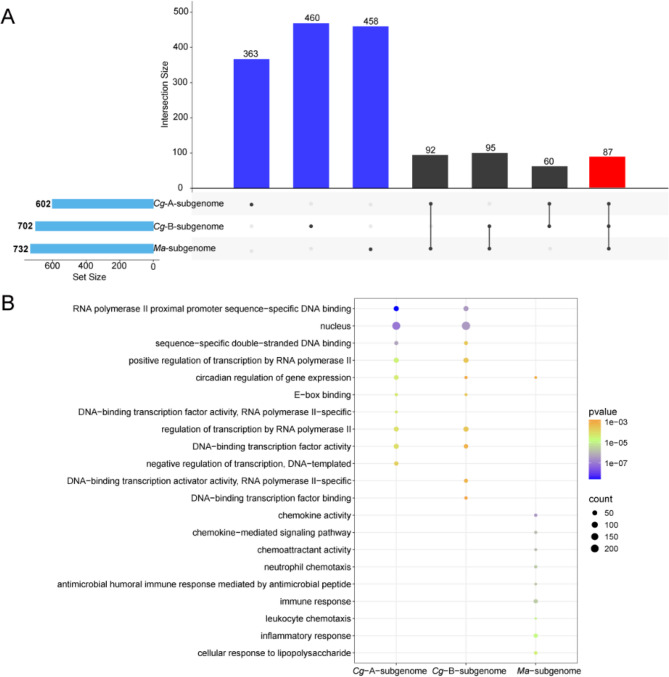
Allopolyploids often exhibit enhanced resistance to pathogen stresses. However, our understanding about the patterns that allopolyploids modify homeolog expression upon pathogen invasion remains limited. Since 2012, a disease caused by herpesvirus (CaHV) has posed a severe threat to Carassius auratus aquaculture. Therefore, the synthesis of novel allopolyploids with enhanced resistance has become one of significant priorities for its aquaculture. In this study, we first synthesized and then established a gynogenetic Carassius alloheptaploid clone (CaA7n). It possesses approximately 158 chromosomes of C. gibelio and 24 haploid chromosomes of M. amblycephala. CaHV challenge experiments showed that CaA7n inherited high resistance from its paternal M. amblycephalus, exhibiting a 100% survival rate after CaHV infection. Subsequently, we revealed distinct transcriptional responses among CaA7n and its parents to CaHV infection and identified two key modules. The egiengenes in the module that positively correlated with CaA7n resistance were mainly enriched in chemokine activity GO terms. Finally, we described a profound expression alteration of three homeologs in CaA7n, including additive and non-additive expression patterns. After CaHV infection, three homeologs mainly involved in chemokine activity changed their expression patterns in CaA7n. Moreover, homeologs derived from M. amblycephala associated with chemokine activity, which showed altered expression levels, may enhance the antiviral immune response of CaA7n. This study not only establishes CaA7n as a promising CaHV-resistant candidate for aquaculture but also elucidates how allopolyploids reconfigure parental homeolog expression networks to enhance antiviral defenses, advancing our understanding of allopolyploid adaptation mechanisms under pathogenic pressure.

Keywords: Carassius; Allopolyploid; Antiviral response; Chemokine; Herpesvirus; Homeologs.


Conflict of interest statement

Declarations. Consent for publication: Not applicable. Competing interests: The authors declare no competing interests.

Figures

Fig. 1
Fig. 1
Establishment and genetic identification of the novel gynogenetic Carassius alloheptaploid clone (CaA7n). A Flowchart of generation process. B DNA content histograms of C. gibelio (Cg), M. amblycephala (Ma), and CaA7n (P0 and F1 generation) via flow cytometry. C Metaphase of CaA7n containing 182 chromosomes. D Chromosome number distribution in the 100 metaphases from CaA7n (n = 3). E GISH analysis of chromosomes in CaA7n. The blue fluorescence represents chromosomes stained with DAPI; the green fluorescence corresponds to the hybridization signals detected with a C. gibelio genomic probe labeled with digoxigenin, captured through a FITC filter; and the red fluorescence indicates the hybridization signals from an M. amblycephala genomic probe labeled with biotin, detected by CY3 filter. Scale bar, 10 μm. F Distribution of parental M. amblycephala chromosomes in CaA7n
Fig. 2
Fig. 2
Evaluation of resistance to CaHV infection among CaA7n and its parents. A Survival rate curve after CaHV challenge. B CaHV viral load in the head-kidney tissues. The data are presented as means ± SEM (n = 3), reflecting the CaHV copy number per nanogram of head-kidney DNA. Different letters show a significant difference among three fish types at each dpi (p < 0.05). C Microscopy of H&E-stained head-kidney sections. Blood cell and lymphocyte are indicated by red and blue arrows, respectively. Black pentagram stars and black rectangles are used to indicate nuclear rupture and tissue dissolution in Cg, respectively. Scale bar, 20 μm
Fig. 3
Fig. 3
Distinct transcriptional responses to CaHV among CaA7n and its parents. A The number of DEGs. B The union of top 10 non-redundant KEGG pathways enriched by DEGs from i-Ma vs. c-Ma, i-Cg vs. c-Cg, and i-CaA7n vs. c-CaA7n. The color intensity in panels stands for the p-value, and the size of node represents the gene count in this item. C-E The positive (up-regulated) and negative (down-regulated) pathways identified from the infected groups of Ma C, Cg D, and CaA7n E in comparison with their respective controls, which were ranked by GSEA-derived normalized enrichment scores (NES) (gene set enrichment with p < 0.05) for pathways in B. F GSEA plot for “porphyrin metabolism” in log2fold change for whole transcriptome from i-Ma vs. c-Ma, i-Cg vs. c-Cg and i-CaA7n vs. c- CaA7n
Fig. 4
Fig. 4
WGCNA analysis identified core modules associated with resistance in CaA7n. A Clustering dendrogram of DEGs. Branches represent the co-expressed genes in modules, shown in the colorbar below the dendrogram. B Correlation matrix of module eigengene values and traits (resistance or fish type). The number within each box denotes correlation coefficient between trait and module, with corresponding p-value indicated in parentheses. A blue or red box signifies a negative or positive correlation between the trait and the module, respectively. A module is considered to have a significant positive or negative correlation if the absolute value of the correlation coefficient exceeds 0.8 and the p < 0.05. C-D Cluster map of eigengenes in the blue module C and black module D. Expression levels are represented by a color gradient ranging from blue (low) to red (high). E GO enrichment analysis of the eigengenes in black and blue modules. The bubble chart shows the enrichment of different GO terms, where the size of the bubbles indicates the number of genes (count) and the color represents the significance of the p-value
Fig. 5
Fig. 5
Expression pattern changes of three homeologs in CaA7n after CaHV infection. A Classifications of gene expression profiles. The Roman numerals correspond to the classifications utilized by Rapp [40, 62]. The schematic illustrations depict the gene expression levels in CaA7n in comparison with its parents. B Distribution of each category in control and infected groups. C UpSet plot that presents the transitions in categories from control to infected group. Horizontal bar plot situated at the bottom left corner displays the sum number of three homeologs for each category. Upper bar plot represents the number of each intersecting combination of category shifts from control to infected state, with connecting circles indicating these overlaps. Black and red bar plots denote the numbers of three homeologs that experienced or did not experience category alterations upon CaHV infection, respectively. c, control; Cg, C. gibelio; Ma, M. amblycephalus; ELD, expression level dominance; i, infected; No, No change; Trans-down, transgressive down-regulation; Trans-up, transgressive up-regulation. D The union of top 10 non-redundant GO terms enriched by unchanged or changed three homeologs in CaA7n after CaHV infection
Fig. 6
Fig. 6
Characterization of three different subgenome-derived homeologs that altered expression levels in response to CaHV infection in CaA7n. A UpSet plot of the numbers for expression level changed homeologs in Cg-A, Cg-B, and Ma subgenomes. The numbers represent Cg-A derived, Cg-B derived, or Ma-derived homeologs, where one (no intersection, blue column), two (intersection of two circles, black column), or all three (intersection of three circles, red column) homeologs were differentially expressed between the control and infected CaA7n individuals. B The union of top 10 non-redundant GO terms enriched by Cg-A derived, Cg-B derived, and Ma-derived homeologs that showed differential expression between the control and infected CaA7n individuals

Similar articles

References

    1. Gui JF, Zhou L, Li XY. Rethinking fish biology and biotechnologies in the challenge era for burgeoning genome resources and strengthening food security. Water Biol Secur. 2022;1(1):100002. 10.1016/j.watbs.2021.11.001.
    1. Gui JF. Chinese wisdom and modern innovation of aquaculture. Water Biol Secur. 2024;3(3):100271. 10.1016/j.watbs.2024.100271.
    1. Salman-Minkov A, Sabath N, Mayrose I. Whole-genome duplication as a key factor in crop domestication. Nat Plants. 2016;2:16115. 10.1038/nplants.2016.115. - PubMed
    1. Zhou L, Gui JF. Natural and artificial polyploids in aquaculture. Aquacult Fish. 2017;2(3):103–11. 10.1016/j.aaf.2017.04.003.
    1. Zhou L, Gui JF. Epigenetics in hybridization and polyploidization of aquatic animals. In: Piferrer F, Wang HP, eds. Epigenetics in Aquaculture. Wiley. 2023;287–99.

LinkOut - more resources