. 2025 Jul 14;10(1):222.
doi: 10.1038/s41392-025-02303-x.

High mtDNA content identifies oxidative phosphorylation-driven acute myeloid leukemias and represents a therapeutic vulnerability

Affiliations

High mtDNA content identifies oxidative phosphorylation-driven acute myeloid leukemias and represents a therapeutic vulnerability

Diego A Pereira-Martins et al. Signal Transduct Target Ther. .

Abstract

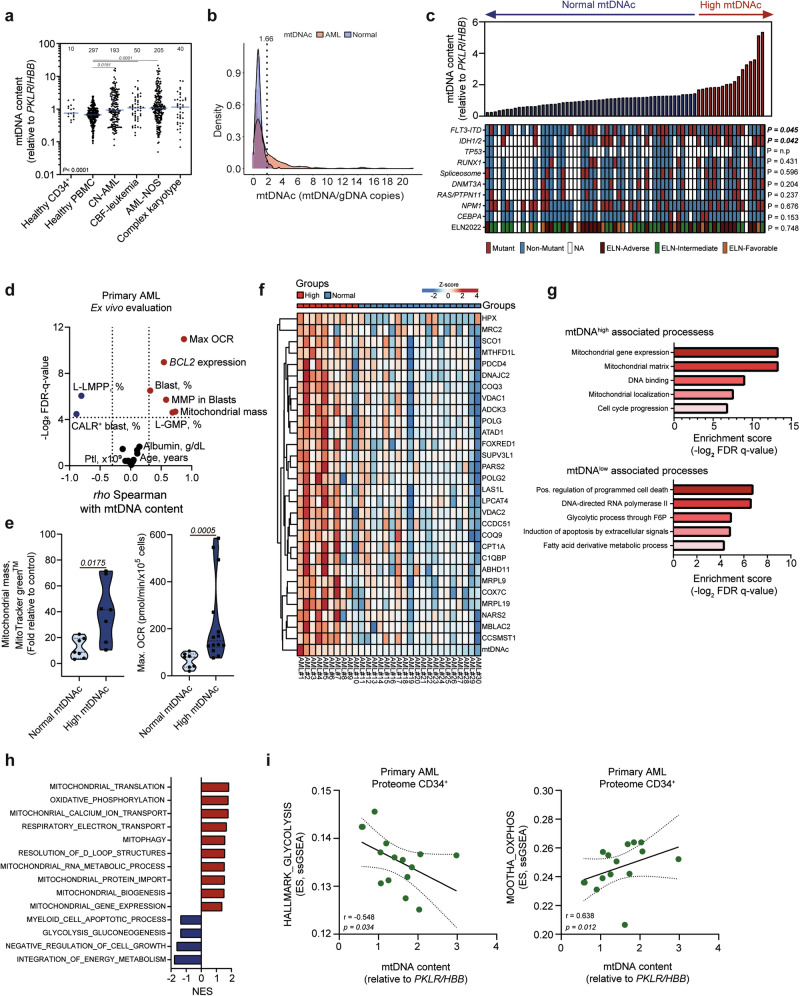
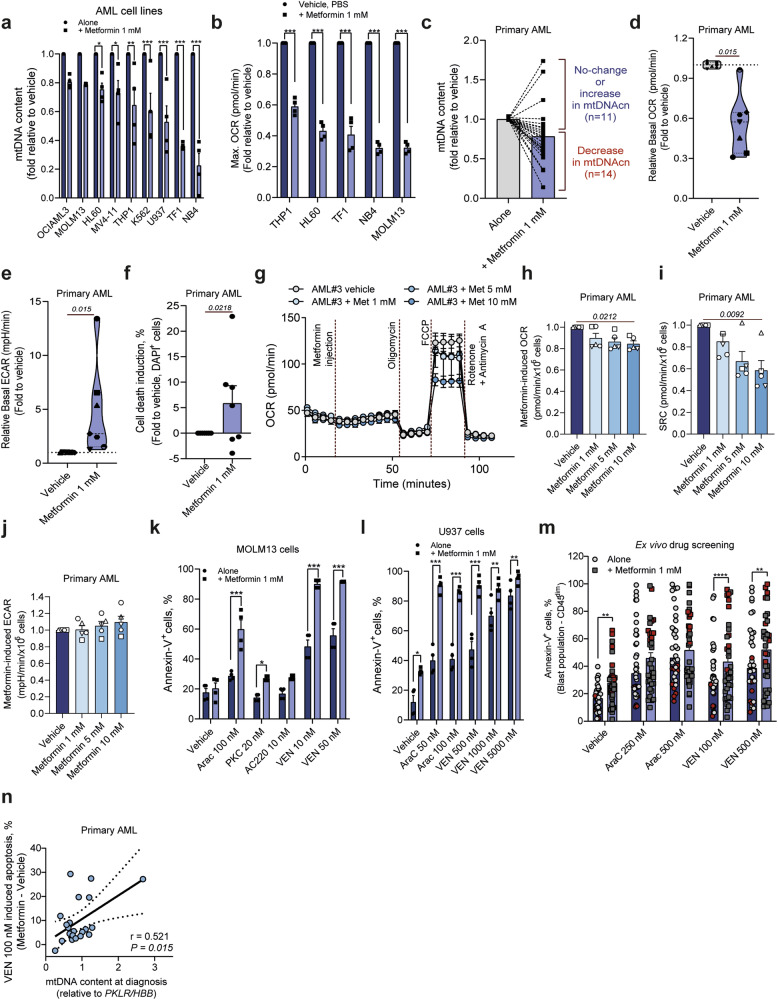
Metabolic reprogramming is a hallmark of cancer, with acute myeloid leukemia (AML) being no exception. Mitochondrial function, particularly its role in protecting tumor cells against chemotherapy, is of significant interest in AML chemoresistance. In this study, we identified mitochondrial DNA content (mtDNAc), measured by quantitative PCR, as a simple and precise marker to stratify the metabolic states of AML patients. We show that patients with high mtDNAc are associated with increased mitochondrial metabolism and a higher dependency on oxidative phosphorylation (OXPHOS), often correlating with chemoresistance. Clinically, patients receiving cytarabine and an anthracycline-based regimen (7 + 3 regimen) experienced inferior relapse-free survival and a higher overall rate of leukemia recurrence. Ex vivo experiments using primary AML samples confirmed cytarabine resistance in high mtDNAc patients, which could be overcome by inhibiting mitochondrial complex I. The FDA-approved drug metformin, which targets mitochondrial metabolism, significantly enhanced apoptosis in response to chemotherapy or targeted agents, such as venetoclax, in AML models. However, metformin-treated cells adapted by increasing glycolysis and NAD+ production, a resistance mechanism that could be bypassed by targeting the nicotinamide phosphoribosyltransferase (NAMPT) enzyme. In summary, we demonstrated that mtDNAc is an effective tool for assessing the metabolic state of AML cells. This method can be easily implemented in clinical practice to identify chemoresistant patients and guide personalized treatment strategies, including novel combination therapies for those with a high reliance on mitochondrial metabolism.


Conflict of interest statement

Competing interests: The authors declare no competing interests.

Figures

Fig. 1
Fig. 1
mitochondrial DNA content (mtDNAc) identifies patients with increased mitochondrial metabolism in AML. a Relative quantification of mtDNAc was conducted using quantitative real-time PCR, normalized to the single-copy nuclear genes (PKLR and HBB), in the training cohort (n = 482 AML samples, n = 297 healthy PBMCs, and n = 10 healthy CD34+). Horizontal bars indicate the median mtDNAc value. Numbers at the top represent the number of patients per group. Groups were compared using a Kruskal-Wallis H test with Dunn’s multiple comparison test. b Overlapped distribution of mtDNAc in healthy controls (displayed in blue, healthy CD34+ cells, n = 10 and healthy PBMCs, n = 297) and de novo AML patients (diagnosis samples) from the training cohort (red, n = 482). Y-axis displays the percentage of individuals included and X-axis the absolute mtDNAc quantification (mtDNA/gDNA copies). Dashed line represents the 95th percentile of mtDNAc in the healthy controls, which was used as a cut point to identify AML patients with high mtDNAc. c Bar plot displaying the relative mtDNAc in primary AML cells included in the validation cohort (n = 70). Oncoprint displaying the baseline mutations and ELN2022-risk stratification of the patients with AML. NA, not available. For comparisons between two groups, the Mann–Whitney U test was used, while comparisons involving more than two groups were analyzed using the Kruskal–Wallis H test followed by Dunn’s multiple comparison post hoc test. d Spearman correlation of mtDNAc and ex vivo functionally evaluated parameters in primary AML samples (n = 67). Values were normalized by interexperimental control, and fold-relative to control values were inputted for correlation analysis. Blue and red dots indicate significant negative and positive correlations, respectively. L-LMPP, Lympho-myeloid primed progenitor; L-GMP, Granulocyte-Macrophage Progenitor; CALR, Calreticulin; OCR, oxygen consumption rate; MMP, mitochondrial membrane potential; Plt, Platelets. The comparison with blast percentage was based on the proportion of blasts assessed by the pathologist in bone marrow aspirates. e Violin plots illustrating the ex vivo assessment of mitochondrial mass (measured by MitoTracker Green™ staining) and maximum OCR (evaluated using the Seahorse XF96 Pro) in primary AML samples (n = 20), stratified based on their mtDNAc levels. Groups were compared using a Mann–Whitney U test. Proteomic landscape in AML patients regarding their mtDNAc: f Heatmap of the top 30 differentially expressed proteins between mtDNAclow and mtDNAchigh patients analyzed by label-free quantitative proteome on sorted CD34+ AML cells (CD117+ for CD34- samples, n = 30). Gene ontology (GO) g and gene set enrichment analysis (GSEA) (h) of mtDNAclow and mtDNAchigh patients analyzed on the proteome of CD34+-sorted AML cells. NES, normalized enrichment score; FDR, false discovery rate. i Spearman correlation between mtDNAc and single sample GSEA (ssGSEA) enrichment scores (ES) obtained from proteome on sorted CD34+ AML cells
Fig. 2
Fig. 2
AML cells with high mtDNAc display resistance to cytarabine-induced apoptosis. a Disease-free survival (DFS) was assessed in AML patients with high mtDNAc (n = 90) versus those with normal mtDNAc, (n = 179), all treated with 3 + 7 based protocols (training cohort). DFS curves were generated using the Kaplan–Meier method, and differences were evaluated with the log-rank test. b Cumulative incidence of relapse (CIR) was analyzed considering relapse and non-relapse mortality as competing events. Time to relapse and non-relapse death was calculated from the date of complete remission. c CIR was further evaluated based on mtDNAc levels within the Adapted genetic risk (AGR) categories. Patients in each risk group (favorable, intermediate, and adverse) were stratified by mtDNAc status (normal and high mtDNAc). For ac the numbers under the X-axis indicate the number of patients included in each comparison. d Spearman correlation between the ex vivo cytarabine (AraC) induced apoptosis (100 nM, 48 h) and the mtDNAc measured on AML blast population (training cohort, n = 44, SSClowCD45dimCD33+ population). Logarithmic values of the mtDNAc and apoptosis rate were used in the correlations analyses to better fit the data. Delta apoptosis rate was calculated by subtracting the AraC-induced apoptosis to the respective vehicle control. Dot plot panels displaying the mtDNAc (e) and the AraC-induced apoptosis (100 nM, 48 h) f in primary AML blasts transduced with shPOLG (using a single construct with five independent shRNAs targeting the POLG gene) and shCTRL as a control (training cohort, n = 11). Cells were cultured in liquid culture conditions for apoptosis assays. Groups were compared using a Mann–Whitney U test. Flow cytometry panels displaying the efficiency of transduction for shCTRL and shPOLG#1 in primary AML cells (AML#4) pre- and post-cellular sorting (g). Bar plot displaying the mtDNAc h in an independent cohort of primary AML blasts transduced with shPOLG#1 and shPOLG#2 (sequences indicated in the Supplemental methods) and shCTRL as a control (validation cohort, n = 6). Groups were compared using a Kruskal–Wallis H test with Dunn’s multiple comparison test. i Cumulative cell count of transduced primary AML cells (shPOLG#1 and shPOLG#2/shCTRL) cultured for 21 days (n = 3 patient samples for the AMLs with normal and n = 3 for the AMLs with high mtDNAc). Representative pictures from the culture conditions for AML#6 are displayed on the right side. OCR, oxygen consumption rate; ECAR, extracellular acidification rate. j Viable cell counts of primary AML cells transduced with shPOLG#1, shPOLG#2, and shCTRL treated with alovudine (2 µM) for 72 h. Plots display the mean ± standard error of the mean (SEM). Groups were compared using Mixed-effect analysis with Dunn’s multiple comparison test
Fig. 3
Fig. 3
Metformin treatment reduces mtDNAc and mitochondrial metabolism, increasing venetoclax-induced apoptosis in AML cells. Comparison of mtDNA content (a) and maximum oxygen consumption rate (max OCR, b) between AML cell lines treated with metformin (1 mM, 48 h) or vehicle control. Bar graphs display values normalized to vehicle-treated controls, expressed as percentages for each sample. Data are shown as the mean ± standard error of the mean (SEM) from a minimum of three independent experiments. Groups were compared using Mixed-effect analysis with Dunn’s multiple comparison test. Comparison in ex vivo treated primary AML samples of mtDNA content (c), basal OCR (d), basal extracellular acidification rate (ECAR) (e) and cell death induction (f) upon metformin treatment (1 mM, 48 h) or vehicle control. Bar graphs and violin plots represent normalized values expressed as a fold for each sample (represented by a different symbol), normalized to vehicle-treated controls. Data are shown as the mean ± SEM from a minimum of four technical measurements. Groups were compared using a Mann–Whitney U test. g Real-time functional respiration analysis of primary AML samples (n = 5) following metformin injection (1, 5, and 10 mM) and vehicle control (PBS), with subsequent addition of compounds to assess mitochondrial respiration under various stress conditions (indicated in the Figure). Bar plots show metformin-induced changes in OCR (difference between measurement 12 and measurement 4, h and spare reserve capacity (SRC, i) in primary AML samples treated with 1, 5, and 10 mM metformin. Data are presented as mean ± SEM from at least four technical replicates. j Metformin-induced ECAR changes (difference between measurement 12 and measurement 4) were analyzed in primary AML samples using the same experimental setup as in panel g. Groups were compared using Kruskal–Wallis H test with Dunn’s multiple comparison test. Drug-induced apoptosis in MOLM13 (k) and U937 (l), treated with several AML-related drugs (VEN, venetoclax; AraC, cytarabine; PKC, midostaurin and AC220, quizartinib) in the presence or absence of metformin (1 mM, 72 h) detected by flow cytometry using an APC-annexin V/DAPI staining method. (m) Apoptosis was assessed by flow cytometry in gated human CD45dimCD34+ (or CD117+ cells for CD34- AML samples) following ex vivo treatment in a co-culture system, using FITC-annexin V/DAPI staining. Cells were treated for 72 h with vehicle, AraC (250 and 500 nM), VEN (100 and 500 nM), with or without metformin (1 mM). Patients displaying high mtDNAc levels (>1.66) are marked in red. Bar graphs show the mean ± SEM from all independently tested patients, with each dot representing an individual patient sample. Statistical significance and cell lines are indicated on the graphs; *p < 0.05; **p < 0.01; ***p < 0.001. Groups were compared using Mixed-effect analysis with Dunn’s multiple comparison test. n Spearman correlation between mtDNAc and VEN 100 nM + Metformin induced apoptosis (relative to metformin monotherapy control) on primary CD34+ AML cells. The number of biological replicates is indicated by the dots on the plots. Each biological replicate is an average of at least two independent technical replicates
Fig. 4
Fig. 4
Metformin-induced metabolic rewiring can be overcome by NAMPT inhibition with KPT-9274 in primary AML blasts. Glucose consumption (a) and lactate secretion (b) rate at of primary AML cells after treatment with metformin (1 mM) and vehicle control for 48 h. Each dot represents an average of four technical replicates of an individual patient sample. Groups were compared using Mixed-effect analysis with Dunn’s multiple comparison test. c RNA-sequencing experiment showing NAMPT levels (CPM) on TF1 cells treated with metformin (5 mM, 48 h). Groups were compared using a Mann–Whitney U test. d Total NAD+ levels in OCI-AML3 cells treated with metformin (5 mM), KPT-9274 (150 nM), or daporinad (100 nM) alone or in combination for 48 h. Bars represent the average of 4 independent measurements. Neonatal cord blood (CB) CD34+ cells were treated ex vivo for 72 h with described drugs and concentrations, and apoptosis induction (e) and clonogenic (CFU-assay) capacity (f) were evaluated. For CFU-assay, cells were cultured in cytokine-enriched methylcellulose with either vehicle or the indicated drugs. Colonies were counted after 8–14 days, and results are expressed as a percentage relative to vehicle-treated controls. Bars represent the mean ± SD from a minimum of three assays. g Dose-response cytotoxicity was evaluated by Annexin-V/DAPI staining and flow cytometry in a set of myeloid leukemia cell lines (OCI-AML2, NB4, U937, and K562) after 72 h of treatment with specified drugs and concentrations. Results are presented as the percentage of viable cells (Annexin-V⁻/DAPI⁻) relative to vehicle-treated controls. A positive control (pos. ctrl) was included for each cell line (boiled cells up to 95 ˚°C for 30 minutes). Groups were compared using Mixed-effect analysis with Dunn’s multiple comparison test. h Oxygen consumption rate (OCR, left panel) was measured in vehicle- or metformin- (1 mM), KPT-9274- (1.5 μM) or combination treatment in primary blasts isolated from AML#2 (ELN2022-adverse with multiple mutations) using an extracellular flux analysis. A representative line graph showing oxygen consumption rate (OCR) following the sequential addition of oligomycin (Oligo A), carbonyl cyanide-p-trifluoromethoxyphenylhydrazone (FCCP), and rotenone combined with antimycin A (Rot + Anti A) is presented; OCR was recorded continuously over time. The extracellular acidification rate (ECAR, right panel) was assessed in the same samples used for OCR analysis using the Seahorse XF96 analyzer. A representative line graph depicts ECAR following the sequential addition of glucose, oligomycin (Oligo A), and 2-deoxy-D-glucose (2-DG); measurements were taken continuously over time. Data was displayed as mean ±95% confidence interval (CI) of three independent biological replicates plated in four independent technical replicates. Combination therapy between NAMPT inhibitors and metformin: (i) Bar plot illustrating apoptosis induction following treatment with metformin (1 mM), KPT-9274 (1.5 µM), and their combination. j Bar plot showing apoptosis induction upon treatment with metformin (1 mM), daporinad (2 and 5 µM), and their combination. Each dot represents an individual patient sample. TMRE staining was used to assess mitochondrial membrane potential in the samples analyzed in (i, j). k Apoptosis levels in ex vivo treated primary AML samples with KPT-9274 (3 µM, left panel) and KPT-9274 (1.5 µM) + metformin (1 mM, right panel) according to mtDNAc levels (normal mtDNAc = 5 patients and high mtDNAc = 9 patients). The number of biological replicates is indicated by the dots on the plots. Each biological replicate is an average of at least two independent technical replicates. For comparisons between two groups, the Mann–Whitney U test was used, while comparisons involving more than two groups were analyzed using the Kruskal–Wallis H test followed by Dunn’s multiple comparison post hoc test

References

    1. Short, N. J., Rytting, M. E. & Cortes, J. E. Acute myeloid leukaemia. Lancet392, 593–606 (2018). - PMC - PubMed
    1. Döhner, H., Weisdorf, D. J. & Bloomfield, C. D. Acute myeloid leukemia. N. Engl. J. Med.373, 1136–1152 (2015). - PubMed
    1. Thol, F. & Ganser, A. Treatment of relapsed acute myeloid leukemia. Curr. Treat. Options Oncol.21, 66 (2020). - PMC - PubMed
    1. Baccelli, I. et al. Mubritinib targets the electron transport chain complex I and reveals the landscape of OXPHOS dependency in acute myeloid leukemia. Cancer Cell36, 84–99.e8 (2019). - PubMed
    1. Shallis, R. M. et al. Standardising acute myeloid leukaemia classification systems: a perspective from a panel of international experts. Lancet Haematol.10, e767–e776 (2023). - PubMed

MeSH terms