. 2025 Jul;62(1):e70176.
doi: 10.1111/ejn.70176.

Differential Modulation of Dopamine D2 Receptor on Somatostatin and Parvalbumin Interneurons in the CA1 Area of the Dorsal Hippocampus

Affiliations

Differential Modulation of Dopamine D2 Receptor on Somatostatin and Parvalbumin Interneurons in the CA1 Area of the Dorsal Hippocampus

Pola Tuduri et al. Eur J Neurosci. 2025 Jul.

Abstract

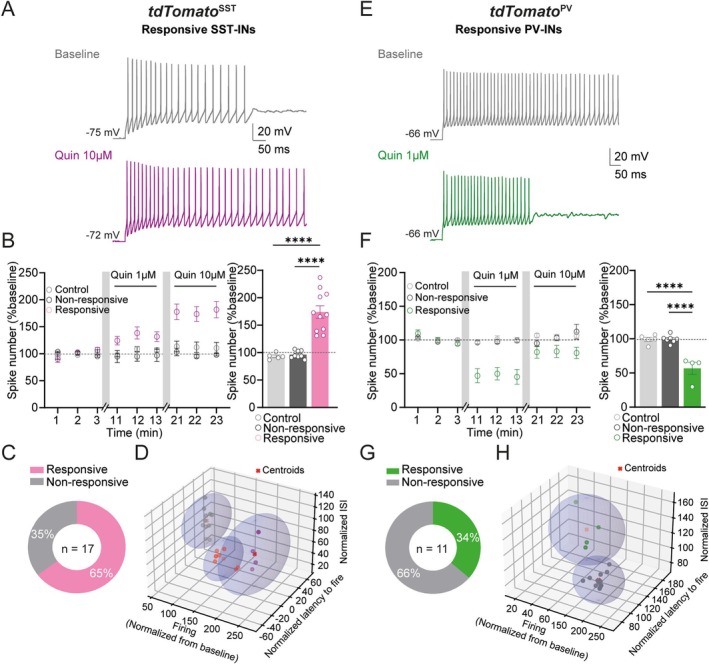
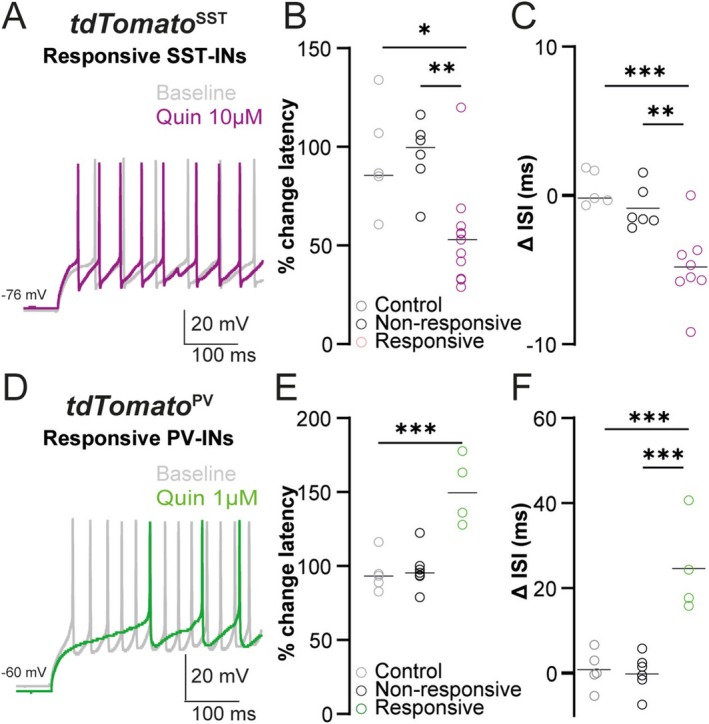
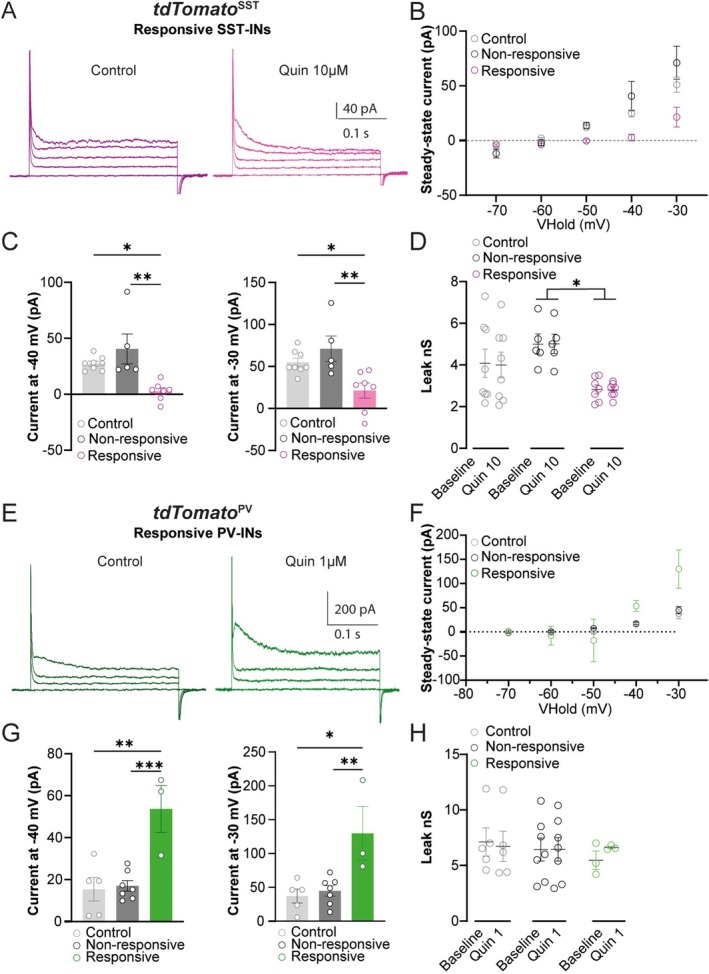
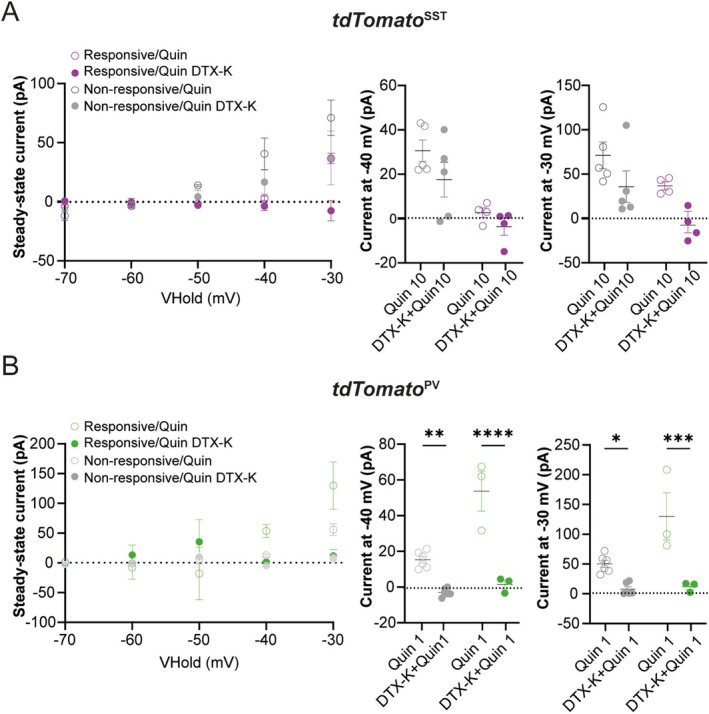
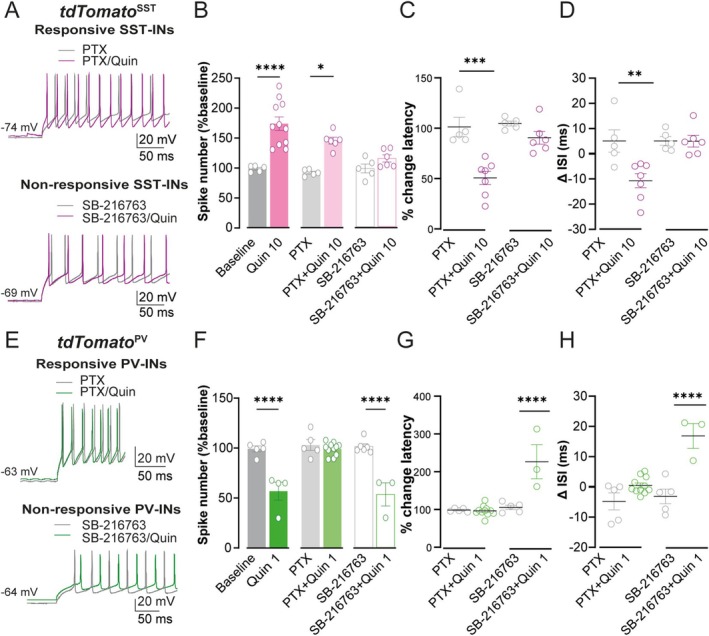
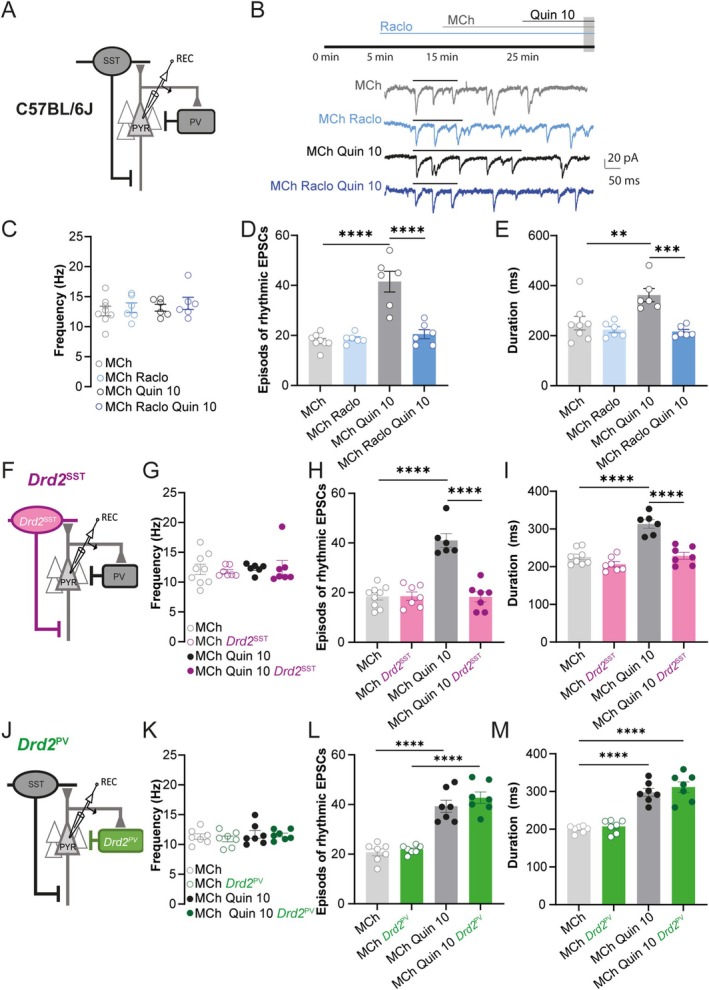
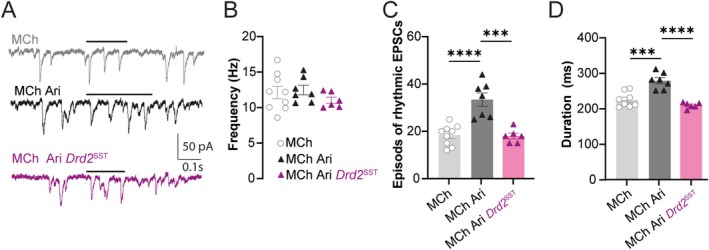
Spatiomolecular mapping of hippocampal dopamine D2 receptor neurons revealed that in addition to hilar mossy cells, hippocampal somatostatin interneurons and, to a lesser extent, parvalbumin interneurons expressed dopamine D2 receptor. However, the consequence of dopamine D2 receptor activation on hippocampal somatostatin interneurons and parvalbumin interneurons is unknown. By combining pharmacological approaches and patch-clamp recordings in organotypic hippocampal slices from control mice or mice lacking Drd2 selectively in somatostatin or parvalbumin interneurons, we found that dopamine D2 receptor activation increases excitability in somatostatin interneurons while it decreases it in parvalbumin interneurons in the CA1 area. These changes depend on voltage-gated K channels and rely on distinct intracellular pathways, involving the non-canonical β-arrestin-dependent pathway in somatostatin interneurons and the G protein-dependent pathway in parvalbumin interneurons. Finally, our study unveils that activation of dopamine D2 receptor in somatostatin interneurons modulates methacholine-induced rhythmic synaptic activity at 4-15 Hz.

Keywords: GABAergic cells; dopamine D2 receptor; hippocampus; intracellular signaling pathway; intrinsic excitability.


Conflict of interest statement

The authors declare no conflicts of interest.

Figures

FIGURE 1
FIGURE 1
Opposing intrinsic electrophysiological responses in hippocampal CA1 somatostatin‐ and parvalbumin‐expressing GABAergic neurons in response to D2R activation. (A) Example of quinpirole‐responsive SST firing traces from the organotypic tdTomato SST slice in the absence or presence of quinpirole (10 μM). (B) Left part: Time course of responses to depolarizing current steps prior and in response to quinpirole 1 and 10 μM of SST‐INs. In the right part: Mean responses corresponding to the last 3 min epoch of quinpirole 10 μM. (C) Pie chart depicting proportions of non‐responsive and responsive SST‐INs to quinpirole (n = 17 cells). (D) K‐mean clustering of SST cells in response to quinpirole within X axis, the number of AP, in Y, the latency to fire, and in Z, the interval inter‐spike (ISI) at quinpirole 10 μM. (E as in A) Example of quinpirole‐responsive PV firing traces from the organotypic tdTomato PV slice in the absence or presence of quinpirole (1 μM). (F as in B, respectively) for PV‐INs from tdTomato PV (G) Right, pie chart depicting proportions of non‐responsive and responsive PV‐INs to quinpirole (n = 11 cells). (H as in D) K‐mean clustering for tdTomato PV slice. Data are represented as mean ± SEM. One‐way ANOVA followed by the Tukey test. **p < 0.01, ****p < 0.0001.
FIGURE 2
FIGURE 2
Consequence of D2R activation on active membrane properties of SST‐INs and PV‐INs. (A–C) tdTomato SST mouse line (quinpirole 10 μM). (A) Example trace showing a decrease of spike latency and ISI after quinpirole application in a responsive SST‐INs. (B) Comparison of quinpirole‐mediated latency change, (C) of quinpirole‐mediated variability of ITI between control, non‐responsive, and responsive groups. (D–F as in A–C, respectively), for tdTomato PV mouse line (quinpirole 1 μM). Data are represented as mean ± SEM. One‐way ANOVA followed by Tukey test. *p < 0.05, **p < 0.01, ***p < 0.001.
FIGURE 3
FIGURE 3
Changes in active membrane properties mediated by D2R activation are underpinned by K+ currents in SST‐INs and PV‐INS. (A–D) Whole‐cell patch clamp recording from tdTomato SST cells. (A) Voltage‐clamp protocol to measure delayed rectifier K currents, and example trace currents from one responsive SST‐INs. (B) I–V curve of leak‐subtracted current for SST‐ from −70 to −30 mV. (C) Mean of leak‐subtracted steady state at −40 mV or −0 mV in SST‐INs. (D) Leak conductance prior to and after quinpirole 10 μM between responsive, non‐responsive, and control groups. (E–H) Whole‐cell patch‐clamp recording from tdTomato PV cells. (E–H as in A–D, respectively), respectively, for tdTomato PV cells. Data are represented as mean ± SEM. One‐way ANOVA or two‐way repeated measure ANOVA followed by Tukey test. *p < 0.05, **p < 0.01.
FIGURE 4
FIGURE 4
Implication of Kv1.1 channel in D2R activation‐mediated changes in active membrane properties in SST‐INs and PV‐INs. (A) Left, I–V curve of leak‐subtracted current for tdTomato SST cells from −70 to −30 mV after application of quinpirole or quinpirole/DTX‐K. Mean of leak‐subtracted steady state at −40 mV in SST‐INs after application of quinpirole 10 μM with or without DTX‐ or at −30 mV. Left part: Ratio of decrease for SST‐INs at −30 mV after DTX‐K application. (B as in A) for tdTomato PV neurons after quinpirole 1 μM application with or without DTX‐K at −30 mV. Data are represented as mean ± SEM. Unpaired t‐test and two‐way repeated measure ANOVA followed by Tukey test. *p < 0.05, **p < 0.01, ***p < 0.001, ****p < 0.0001.
FIGURE 5
FIGURE 5
D2R activation signals through different intracellular pathways depending on the SST‐INs or PV‐INs. (A) Example traces of SST‐INs showing the firing traces prior to and after quinpirole (10 μM) with PTX treatment (upper) or SB‐216763 in the patch pipette (lower). (B) Mean responses corresponding to the last 3 min epoch of quinpirole 10 μM after different conditions. (C) Comparison of quinpirole‐mediated latency change in presence of PTX or SB‐216763. (D) Comparison of quinpirole‐mediated variability of ISI in presence of PTX or SB‐216763. (E–H as in A–D, respectively) for PV‐INs. Data are represented as mean ± SEM. One‐way ANOVA followed by Tukey test. *p < 0.05, **p < 0.01, ***p < 0.001, ****p < 0.0001.
FIGURE 6
FIGURE 6
Modulation of rhythmic synaptic activity in the hippocampal CA1 area by D2R activation is mediated by SST‐INs but is not by PV‐INs. (A) Schematic representation of CA1 network in C57BL/6J. (B) Representative traces of MCh‐induced rhythmic synaptic activity recorded in CA1 PC in different conditions. Black lines represent rhythmic synaptic activity. (C) Comparison of the frequency of each period of rhythmic synaptic activity, (D) of the number of episode/min, and (E) of the duration of each period of rhythmic synaptic activity in MCh (grey), MCh/raclopride (blue), MCh/quinpirole (dark grey) and MCh/raclopride/quinpirole conditions (dark blue). (F) Schematic representation of CA1 network in the Drd2 SST mouse line. (G–I as in C–E, respectively) from control and Drd2 SST organotypic slices. (J) Schematic representation of CA1 network in the Drd2 PV mouse line. (K–M as in C–E, respectively) from control and Drd2 PV organotypic slices. Data are represented as mean ± SEM. One‐way ANOVA followed by Tukey test. **p < 0.01, ***p < 0.001, ****p < 0.0001.
FIGURE 7
FIGURE 7
Aripiprazole mimics the quinpirole effect on hippocampal network rhythmic synaptic activity. (A) Example traces of MCh‐induced rhythmic synaptic activity prior to and after aripiprazole in control and Drd2 SST organotypic slices. Black lines represent periods of rhythmic synaptic activity. (B) Comparison of the frequency of each period of rhythmic synaptic activity, (C) of the number of episode/min, and (D) of the duration of each period of rhythmic synaptic activity in MCh (grey), MCh/aripiprazole (dark grey), and MCh/aripiprazole in the Drd2 SST mouse line (pink). Data are represented as mean ± SEM. One‐way ANOVA followed by Tukey test. ***p < 0.001, ****p < 0.0001.

Similar articles

References

    1. Abbas, A. I. , Sundiang M. J. M., Henoch B., et al. 2018. “Somatostatin Interneurons Facilitate Hippocampal‐Prefrontal Synchrony and Prefrontal Spatial Encoding.” Neuron 100, no. 4: e3. - PMC - PubMed
    1. Ambrée, O. , Richter H., Sachser N., et al. 2009. “Levodopa Ameliorates Learning and Memory Deficits in a Murine Model of Alzheimer's Disease.” Neurobiology of Aging 30, no. 8: 1192–1204. 10.1016/j.neurobiolaging.2007.11.010. - DOI - PubMed
    1. Beaulieu, J.‐M. , and Gainetdinov R. R.. 2011. “The Physiology, Signaling, and Pharmacology of Dopamine Receptors.” Pharmacological Reviews 50, no. 2: 143–160. 10.1124/pr.110.002642.182. - DOI - PubMed
    1. Berry, S. , Weinmann O., Fritz A.‐K., et al. 2018. “Loss of Nogo‐A, Encoded by the Schizophrenia Risk Gene Rtn4, Reduces mGlu3 Expression and Causes Hyperexcitability in Hippocampal CA3 Circuits.” PLoS ONE 13, no. 7: e0200896. 10.1371/journal.pone.0200896. - DOI - PMC - PubMed
    1. Bonci, A. , and Hopf F. W.. 2005. “The Dopamine D2 Receptor: New Surprises From an Old Friend.” Neuron 47, no. 3: 335–338. 10.1016/j.neuron.2005.07.015. - DOI - PubMed

LinkOut - more resources