. 2025 Aug;17(4):e70126.
doi: 10.1111/1758-2229.70126.

Seasonal Transition in the Dominance of Photoautotrophic and Heterotrophic Protists in the Photic Layer of a Subtropical Marine Ecosystem

Affiliations

Seasonal Transition in the Dominance of Photoautotrophic and Heterotrophic Protists in the Photic Layer of a Subtropical Marine Ecosystem

Yoav Avrahami et al. Environ Microbiol Rep. 2025 Aug.

Abstract

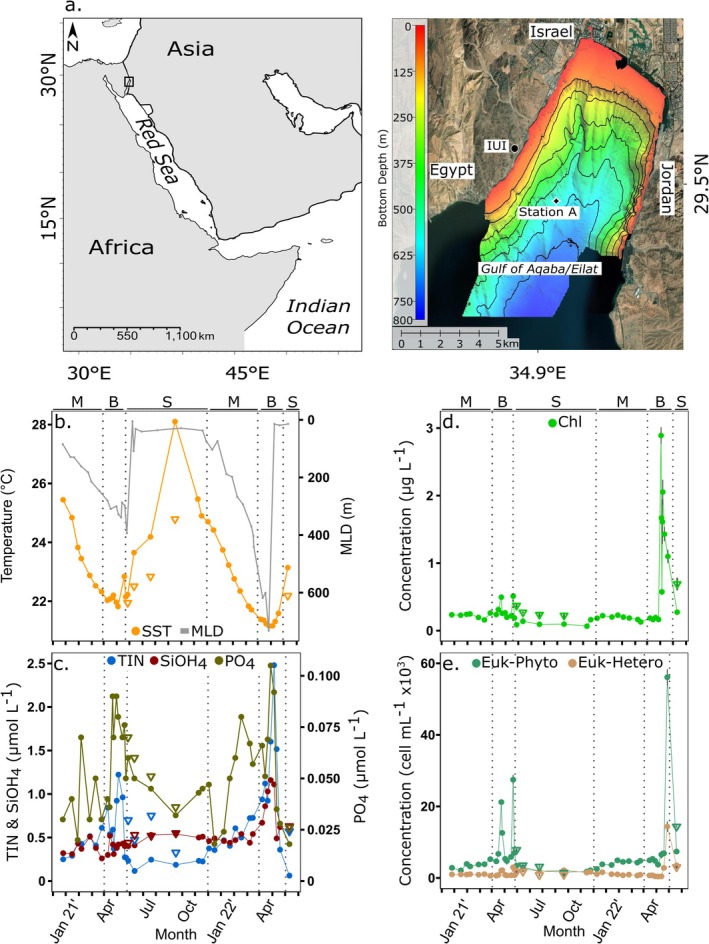
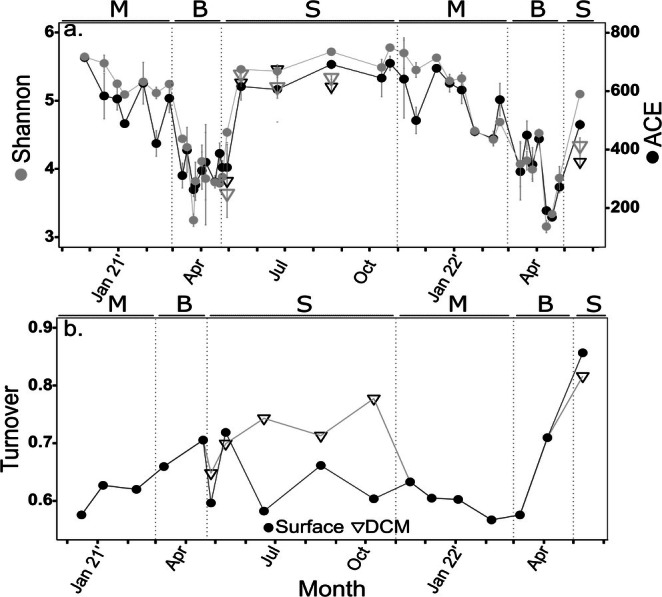
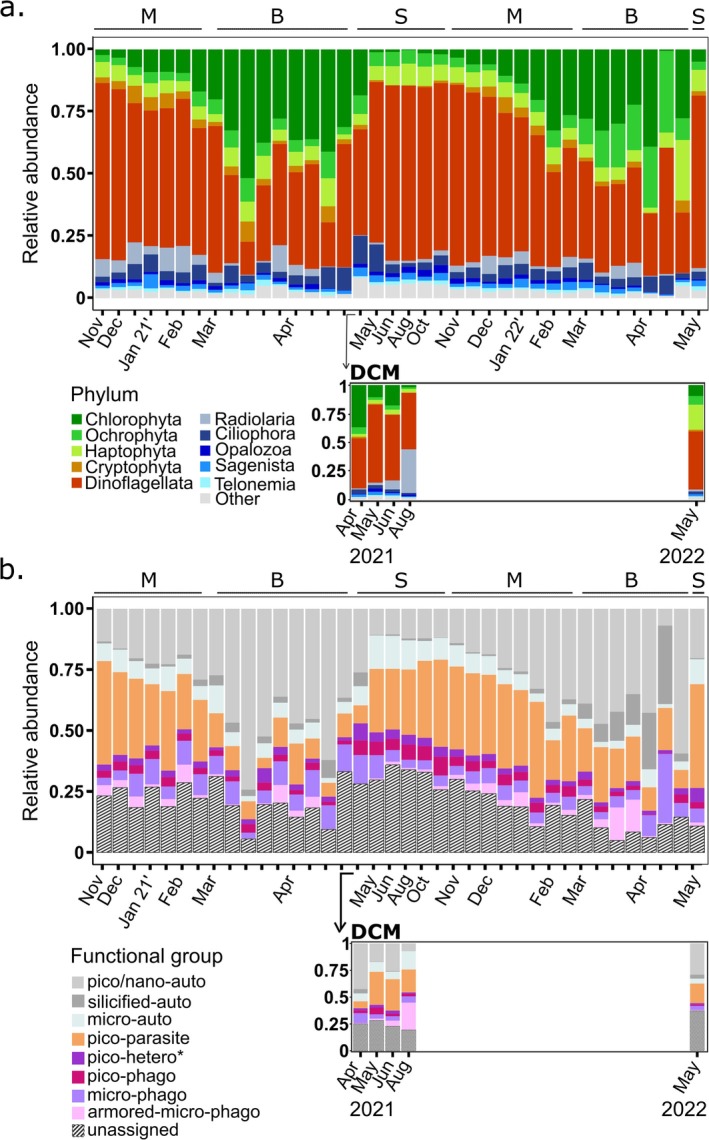
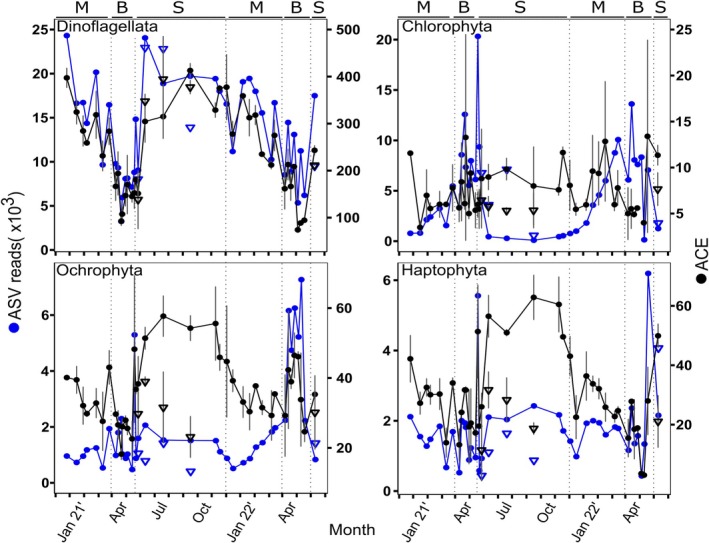
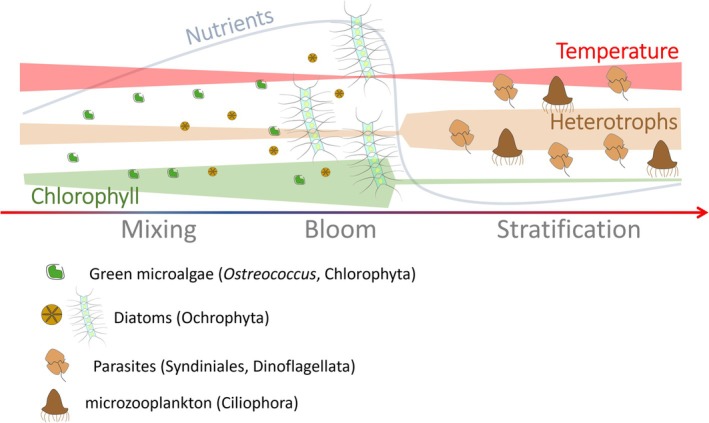
Protists are major functional players in the oceans. Time-resolved protist diversity and succession patterns remain poorly described in subtropical ecosystems, limiting current understanding of food web dynamics and responses to environmental changes in these major world-ocean regions. We used amplicon sequencing data and trait-based annotation to examine the seasonality of planktonic protists in the subtropical Gulf of Aqaba (Red Sea). Temperature and nutrients were the major drivers of succession. We detected marked seasonal shifts in protists. Heterotrophs, including diverse parasitic functional groups, dominated the warm, stratified oligotrophic period spanning spring and summer. By contrast, nutrient influx during deep convective mixing in winter triggered a shift to photoautotrophic communities dominated by a few genera of chlorophytes. Deeper winter mixing resulted in larger blooms at the onset of stratification dominated by diatoms, relative to chlorophytes that prevailed during shallower blooms. This result illustrates the impact of mixing depth on bloom formation and composition. Comparisons with oceanwide rDNA datasets indicate that the oligotrophic protist assemblages from the Gulf resemble those from warm, open oceans. This work provides a detailed assessment of the seasonal switch in dominant trophic functions in protists in phase with nutrient levels in a subtropical planktonic ecosystem.

Keywords: Red Sea; diversity; ecology; functional traits; photic layer; protists; subtropical.


Conflict of interest statement

The authors declare no conflicts of interest.

Figures

FIGURE 1
FIGURE 1
Location and hydrographic variables in the Gulf of Aqaba. (a) Map of the Red Sea and Gulf of Aqaba (GoA). The GoA is located in the northern‐Eastern tip of the Red Sea (indicated in square in the left panel). Sampling in this study was collected at the ‘Station A’, in the northern GoA as depicted in the right‐side panel. The map of the GoA was modified from Israel Oceanographic and Limnological Research and Geological Survey Israel. (b) Temperature at the Sea surface (SST) and DCM, and mixed layer depth (MLD). (c) Macronutrients: Total Inorganic Nitrogen (TIN), Silica and Phosphate. (d) Chlorophyll a. (e) Total eukaryotic phytoplankton (Euk‐Phyto) and eukaryotic heterotrophs (Euk‐Hetero) as determined by flow cytometry. Grey bars in C and D represent the standard deviation (n = 3, n = 2, respectively). Measurements at the Deep chlorophyll maximum (DCM) during the stratified season are represented as triangles. The seasons are separated by dashed lines and noted by letters in the top of each panel: M = mixing, B = bloom, S = summer stratification.
FIGURE 2
FIGURE 2
Protist diversity indices. (a) Diversity (Shannon index) and richness (ACE index) of total ASV reads. Grey bars represent standard deviation (n = 2). (b) Temporal turnover index. This index detects differences between time points in appearance and disappearance of ASV's. Circles represent samples from sub‐surface waters (2 m depth), while triangles represent samples from the deep chlorophyll maximum (DCM). The seasons are separated by dashed lines and noted by letters in the top of each panel: M = mixing, B = bloom, S = summer stratification.
FIGURE 3
FIGURE 3
(a) Main Protist phyla in the Gulf of Aqaba. Averaged (duplicates) relative abundance of the top 10 most abundant phyla in surface waters (upper panel) and the corresponding main phyla at the DCM during summer (lower panel), based on ASV's average reads (duplicates). (b) Composition of protistan functional groups over seasonal gradients in the Gulf of Aqaba. Grey‐shaded bars represent autotrophic groups, and coloured bars represent heterotrophic groups. Averaged (duplicates) relative abundance of functional groups at surface waters (upper panel) and the corresponding functional groups at the DCM during summer (lower panel), based on 243 most abundant genera in the GoA. Letters in the top panels represent seasonal periods: M = mixing, B = bloom, S = summer stratification.
FIGURE 4
FIGURE 4
Total ASV reads (blue) and richness (ACE index, black) for main autotrophic phyla: Dinoflagellata, Chlorophyta, Ochrophyta and Haptophyta. Grey bars represent standard deviation (n = 2). Circles represent samples from sub‐surface waters (2 m depth), while triangles represent samples from the deep chlorophyll maximum (DCM). The seasons are separated by dashed lines and noted by letters in the top of each panel: M = mixing, B = bloom, S = summer stratification.
FIGURE 5
FIGURE 5
Patterns of taxonomic versus functional richness. Each sampling point was measured for taxonomic richness (x‐axis) and functional richness (Fric, y‐axis), based on an analysis performed at the genus taxonomic level and including the 243 top protist genera in the GoA. Shapes represent different seasonal periods: Square = bloom, Circle = mixing, Plus = summer‐surface, Triangle = summer‐DCM. Colours represent sampling years: Blue = 2020–2021, cyan = 2021–2022. R 2 was calculated by a linear model of the 2 variables.
FIGURE 6
FIGURE 6
Global‐scale community composition of the GoA and Tara Oceans samples. (a) Geographical location of the GoA and Tara stations that were examined. RDA analysis was based on the average (duplicates) relative abundance of (b) genera (or lower taxonomic resolution when genus was not assigned) and (c) functional groups at each sampling point. Shapes correspond to the GoA's seasonal period: B = bloom, M = mixing, S‐srf = summer‐surface, S‐dcm = summer‐DCM. Filled circles represent different oceanic basins and seas covered by the Tara Oceans cruise: Arctic = Arctic Ocean, N‐Atl = North Atlantic, N‐Pac = North Pacific, Red = Red Sea, S‐Atl = South Atlantic, S‐Pac = South Pacific, South = Southern Ocean. Grey arrows show influential environmental variables (p value < 0.05): TIN = total inorganic nitrogen, SiOH4 = silica, PO4 = phosphate, Temp = temperature. Percentage in parenthesis refers to the explained variability of environmental parameters by each axis.
FIGURE 7
FIGURE 7
Diagrammatic portrayal of the changes to the planktonic Protits assemblages over a year in the GoA. It shows changing patterns of inorganic nutrients, temperature and the relative proportion of photoautotrophs and heterotrophs over the main seasons: The cold, mesotrophic winter‐mixing, the bloom at the onset of stratification and the warmer, stratified and oligotrophic summer. Some of the main taxa are depicted, particularly chlorophytes, diatoms as main phytoplankton more abundant during the winter and bloom, and dinoflagellates, parasitic Syndiniales and ciliates more common during the stratified season.

Similar articles

References

    1. Alberti, A. , Poulain J., Engelen S., et al. 2017. “Viral to Metazoan Marine Plankton Nucleotide Sequences From the Tara Oceans Expedition.” Scientific Data 4, no. 1: 1–20. 10.1038/sdata.2017.93. - DOI - PMC - PubMed
    1. Al‐Najjar, T. , Badran M. I., Richter C., Meyerhoefer M., and Sommer U.. 2007. “Seasonal Dynamics of Phytoplankton in the Gulf of Aqaba, Red Sea.” Hydrobiologia 579, no. 1: 69–83. 10.1007/s10750-006-0365-z. - DOI
    1. Anderson, S. R. , Blanco‐Bercial L., Carlson C. A., and Harvey E. L.. 2024. “Role of Syndiniales Parasites in Depth‐Specific Networks and Carbon Flux in the Oligotrophic Ocean.” ISME Communications 4, no. 1: 14. 10.1093/ismeco/ycae014. - DOI - PMC - PubMed
    1. Anderson, S. R. , and Harvey E. L.. 2020. “Temporal Variability and Ecological Interactions of Parasitic Marine Syndiniales in Coastal Protist Communities.” mSphere 5, no. 3: 10–1128. 10.1128/msphere.00209-20. - DOI - PMC - PubMed
    1. Avrahami, Y. , and Frada M. J.. 2020. “Detection of Phagotrophy in the Marine Phytoplankton Group of the Coccolithophores (Calcihaptophycidae, Haptophyta) During Nutrient‐Replete and Phosphate‐Limited Growth.” Journal of Phycology 56, no. 4: 1103–1108. 10.1111/jpy.12997. - DOI - PubMed

LinkOut - more resources