. 2025 Oct;12(37):e08822.
doi: 10.1002/advs.202508822. Epub 2025 Jul 14.

Inhibition of FOXM1 Synergizes with BH3 Mimetics Venetoclax and Sonrotoclax in Killing Multiple Myeloma Cells through Repressing MYC Pathway

Affiliations

Inhibition of FOXM1 Synergizes with BH3 Mimetics Venetoclax and Sonrotoclax in Killing Multiple Myeloma Cells through Repressing MYC Pathway

Zhi Wen et al. Adv Sci (Weinh). 2025 Oct.

Abstract

Relapsed and refractory multiple myeloma (RRMM) remains the leading cause of MM mortality. FOXM1 is strongly associated with RRMM, making it a compelling therapeutic target. Through three low-throughput screenings, we have identified nine FDA-approved drugs, including the BH3 mimetic Venetoclax, that synergize with FOXM1 inhibitor NB73 in killing MM cells. Venetoclax has shown effects in 6% of non-t(11;14) and 27% of t(11;14) MM cases. The NB73-Venetoclax combination barely induces acute toxicity in vivo and represses MM cells in vivo and ex vivo. NB73 enhances the ubiquitination and proteasomal degradation of FOXM1, an effect further amplified by Venetoclax. The NB73-Venetoclax combination abolishes FOXM1's binding to promoters of key MYC pathway genes, such as PLK1, leading to significant downregulation of their expression. Furthermore, the PLK1-specific inhibitor GSK461364 synergizes with NB73 to inhibit MM cell growth. Interestingly, NB73 does not sensitize U266 cells, a Venetoclax-resistant t(11;14) MM cell line expressing high FOXM1, to Venetoclax treatment, which is corrected by a new-generation BH3 mimetic Sonrotoclax and ALK inhibitor Ceritinib. Collectively, targeting FOXM1 demonstrates significant potential for enhancing the efficacy of FDA-approved drugs in RRMM. These findings shed new light on the discouraging outcomes of the Phase-III CANOVA study centering Venetoclax with an encouraging molecular clue.

Keywords: drug resistance; foxm1 inhibitors; multiple myeloma; myc pathway; venetoclax and sonrotoclax.


Conflict of interest statement

B.S.K., J.A.K. and S.H.K. are co‐inventors on patents filed by the University of Illinois to cover the FOXM1 inhibitor compounds described in this paper. B.S.K. and J.A.K, are members of the Scientific Advisory Board of Celcuity. The other authors declare no competing interests.

Figures

Figure 1
Figure 1
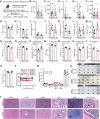
Identify FDA‐approved drugs synergizing with FOXM1 inhibitor NB73 in suppressing myeloma cells. OPM2 and ∆47 cells, exhibiting the highest FOXM1 levels among 11 myeloma cell lines[ 9 ] were treated with the specified drugs for 1–2 days. Cell viabilities were assessed after two‐day treatment using the CellTiter‐Glo assay and normalized to DMSO controls in 96‐well and 384‐well plates. The Annexin V‐binding based cell apoptosis assay was conducted after one‐day treatment in 6‐cm dishes. A) Outline of prioritizing Venetoclax which synergized with NB73 in killing MM cells in vitro, in vivo, and ex vivo. Three tools were employed to conduct low‐throughput screens of FDA‐approved drugs to identify 9 combinations. B) The ZIP drug synergy scores of NB73 and each of the six anti‐MM drugs in OPM2 cells. The average ZIP drug synergy score > 10 indicates an overall synergy. C) The image presentation of the ZIP drug synergy assay of NB73 and Venetoclax in OPM2 cells (left) and the validation of drug synergy using the Annexin V‐binding assay (middle and right). D) The validation of the synergy of NB73 and Venetoclax in ∆47 cells using the ZIP drug synergy assay (left) and Annexin V‐binding assay (middle and right). E) Repurposing screens of 166 FDA‐approved anti‐cancer drugs in the NCI AOD X library were conducted in FOXM1+/+ versus FOXM1−/− OPM2 cell lines.[ 9 ] Four concentrations of each drug were achieved in 50 µL of cell suspension in 384‐well plates. The outliers were selected by naked eye. F) The validation of the synergy of NB73 and Panobinostat in OPM2 FOXM1+/+ cells using ZIP drug synergy assay (left) and Annexin V‐binding assay (middle and right). G) Repurposing screens of 166 FDA‐approved anti‐cancer drugs in NCI AOD X library were conducted in FOXM1+/+ versus FOXM1−/− ∆47 cell lines[ 9 ] as (E). H) The validation of the synergy of NB73 and Vinorelbine in FOXM1+/+ ∆47 cells using ZIP drug synergy assay (left) and Annexin V‐binding assay (middle and right). I) Computationally predict drug synergy with the CMap program upon the transcriptome data in OPM2 cells whose FOXM1 expression was disrupted by gene deletion and overexpression. The CMap program connects genes, drugs, and disease states by virtue of common gene‐expression signatures.[ 58 ] J) The validation of the synergy of NB73 and Thapsigargin in OPM2 cells using the ZIP drug synergy assay (left) and the Annexin V‐binding assay (middle and right). In this figure, p‐values were calculated by Student's t‐test with two tails. * < 0.05; ** < 0.01; *** < 0.001. Data are presented as mean ± standard deviation (n ≥ 3).
Figure 2
Figure 2
In vivo evaluation of the acute toxicity of the NB73–Venetoclax combination. A) Male B6 mice (7–8 weeks old) were treated with NB73 (10 mg kg−1, subcutaneous injection, twice weekly) and Venetoclax (100 mg kg−1, oral gavage, three times weekly) for two weeks. Mice were sacrificed on Day 14, and blood and organ samples were collected for toxicity assessment. B–I) Serum levels of B) ALT (alanine transaminase), C) AST (aspartate aminotransferase), D) GGT (gamma‐glutamyl transferase), E) ALP (alkaline phosphatase), F) CK (creatine kinase), G) BUN (blood urea nitrogen), H) creatinine, and I) total bilirubin were measured on Day 14. J–Q) Peripheral blood was analyzed for J) WBC (white blood cells), K) lymphocytes, L) neutrophils, M) platelets, N) RBC (red blood cells), O) hemoglobin, P) reticulocytes, and Q) MCH (mean corpuscular hemoglobin) on Day 14. R–U) Serum concentrations of R) albumin, S) globulin, T) albumin/globulin ratio, and U) total protein were also measured on Day 14. V) Body weight remained stable from Day 0 to Day 14. W) The weights of the heart, spleen, right kidney, right lung, and liver were comparable between the control and treated groups on Day 14. X) Representative images of the heart, spleen, and right kidneys from control and treated groups on Day 14. Y) Representative H&E‐stained images of the heart, liver, right kidney, right lung, spleen, and bone marrow on Day 14. In this figure, p‐values were calculated using a two‐tailed Student's t‐test. * < 0.05; ** < 0.01; *** < 0.001. Data are presented as mean ± standard deviation (n = 5/group).
Figure 3
Figure 3
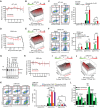
Sonrotoclax, a second‐generation BH3 mimetic, synergizes with NB73 in killing MM cells. A) Sonrotoclax and Venetoclax were similarly toxic to ∆47 cells when used alone. B) ZIP drug synergy assay of ∆47 cells treated with NB73 and Sonrotoclax for 48 h. C) Assessment of cell apoptosis with Annexin V‐binding assay in ∆47 cells treated with NB73 and Sonrotoclax for 24 h. A histogram of cell apoptosis assays was shown. D) Sonrotoclax and Venetoclax were similarly toxic to OPM2 cells when used alone. E) ZIP drug synergy assay of OPM2 cells treated with NB73 and Sonrotoclax for 48 h. F) Assessment of cell apoptosis with Annexin V‐binding assay in OPM2 cells treated with NB73 and Sonrotoclax for 24 h. A histogram of cell apoptosis assays was shown. G) U266 cells expressed FOXM1 at a medium level between OPM2 and ∆47 cells in the immunoblotting assay. U266 cells are t(11;14)‐positive and Venetoclax‐resistant. H) Sonrotoclax and Venetoclax were similarly toxic to U266 cells when used alone. I) ZIP drug synergy assay of U266 cells treated with NB73 and Sonrotoclax for 48 h. J) ZIP drug synergy assay of U266 cells treated with NB73 and Venetoclax for 48 h. The average ZIP drug synergy score was <10, suggesting an overall additive effect. K) Assessment of cell apoptosis with Annexin V‐binding assay in U266 cells treated with NB73 and Sonrotoclax or Venetoclax for 24 h. A histogram of cell apoptosis assays was shown. L) Comparisons of the Average and Peak ZIP drug synergy scores between the NB73‐Venetoclax combination and the NB73‐Sonrotoclax combination in ∆47, OPM2, and U266 cells. In this figure, p‐values were calculated by Student's t‐test with two tails. * < 0.05; ** < 0.01; *** < 0.001. Data are presented as mean ± standard deviation (n ≥ 3).
Figure 4
Figure 4
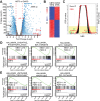
Decipher transcriptomic changes induced by NB73 in OPM2 cells. OPM2 cells were treated with NB73 or DMSO for 24 h for RNA‐seq study. A) Volcano plot representing all transcripts, with red dots indicating growth‐suppressing genes and black dots representing growth‐promoting genes. B) Heat map depicting the expression profiles of the most differentially expressed genes between NB73‐treated and control groups. C) Overview of GSEA results, highlighting significant pathway alterations induced by NB73 treatment. D) GSEA showing enrichment of pathways related to oxidative phosphorylation, MYC, and E2F signaling in the control group. E) GSEA showing enrichment of pathways associated with unfolded protein response, p53, and apoptosis in the NB73 group.
Figure 5
Figure 5
Transcriptomics study reveals drug synergy modes in OPM2 cells. OPM2 cells were treated with DMSO, NB73, Venetoclax, or the combination for 24 h for RNA‐seq analysis. A) Principal component analysis (PCA) of 12 samples representing distinct clustering based on treatment conditions. B) Heat map depicting the expression levels of the most differentially expressed genes in the combination versus DMSO group, highlighting treatment‐induced transcriptional changes. C) Volcano plot illustrating differential gene expression between the combination and DMSO groups, with red dots indicating growth‐suppressing genes and black dots representing growth‐promoting genes. D) Representative RNA levels of growth‐suppressing genes were shown to elucidate treatment effects. P‐values were calculated by Student's t‐test with two tails. * < 0.05; ** < 0.01; *** < 0.001. Data are presented as mean ± standard deviation (n = 3). E) Overview of GSEA results revealed pathway alterations induced by treatment. F) Multiple comparisons of the Apoptosis pathway among DMSO, NB73, Venetoclax, or the combination groups showed the drug synergy. G) Drug synergy modes were visualized using the GSEA tool, with red indicating sum‐up mode, black representing de novo mode, and green indicating helper mode. Hallmark gene sets (FDR < 0.25) were analyzed.
Figure 6
Figure 6
Venetoclax promotes NB73 to degrade FOXM1, leading to the transcriptional repression of the MYC pathway. OPM2 and ∆47 cells were treated with DMSO, NB73, Venetoclax, or their combination for 24 h for the indicated analysis. A) Immunoblotting assay showed representative analysis of FOXM1 levels in OPM2 and ∆47 cells without MG132 addition. B) Immunoblotting assay demonstrated FOXM1 levels in total cell lysates and immunoprecipitates with anti‐Ubiquitin antibody in OPM2 and ∆47 cells with MG132 addition. The immunoprecipitate bands were normalized to their input bands, respectively, and the DMSO group was normalized to 1. C) ChIP‐Seq with anti‐FOXM1 antibody revealed the DNA consensus of FOXM1 in myeloma cells. D) Integrative Genomics Viewer images depicted FOXM1‐binding sites in the promoters of PLK1, CDC20, CCNA2, and MYC in OPM2 and ∆47 cells treated with DMSO or the NB73‐Venetoclax combination, compared to the Input. E) ChIP‐qPCR analyzed FOXM1's binding to these gene promoters in OPM2 (left) and ∆47 (right) cells. F) Heatmap depicting all genes in the Hallmark_MYC_Targets_V1 and _V2 gene sets regulated by the specified drugs in OPM2 cells. G) Validation of these four down‐regulated genes in the MYC pathway through qRT‐PCR in OPM2 cells. H) Representative immunoblotting analysis of these four genes in OPM2 cells. I) Validation of these four genes through qRT‐PCR in ∆47 cells. J) Representative immunoblotting analysis of these four genes in ∆47 cells. In this figure, p‐values were calculated by Student's t‐test with two tails. * < 0.05; ** < 0.01; *** < 0.001. Data are presented as mean ± standard deviation (n ≥ 3).
Figure 7
Figure 7
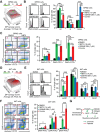
PLK1 inhibitor synergizes with NB73 in suppressing the MYC pathway to kill MM cells. OPM2 and ∆47 cells were treated with DMSO, NB73, PLK1‐specific inhibitor GSK461364, or their combination for the indicated analysis. A) ZIP drug synergy assay of OPM2 cells treated with NB73 and GSK461364 for 48 h. B) Assessment of cell cycle progression with DAPI‐staining in OPM2 cells treated with the indicated drugs for 24 h. A histogram of cell cycle assays was shown. C) Assessment of cell apoptosis with Annexin V‐binding assay in OPM2 cells treated with the indicated drugs for 24 h. A histogram of cell apoptosis assays was shown. D) ZIP drug synergy assay of ∆47 cells treated with NB73 and GSK461364 for 48 h. E) Assessment of cell cycle progression with DAPI‐staining in ∆47 cells treated with the indicated drugs for 24 h. A histogram of cell cycle assays was shown. F) Assessment of cell apoptosis with Annexin V‐binding assay in ∆47 cells treated with the indicated drugs for 24 h. A histogram of cell apoptosis assays was shown. G) A proposed molecular model elucidated the NB73‐Venetoclax/Sonrotoclax synergies. In this figure, p‐values were calculated by Student's t‐test with two tails. * < 0.05; ** < 0.01; *** < 0.001. Data are presented as mean ± standard deviation (n ≥ 3).

References

    1. ACS , Cancer Facts and Figures, American Cancer Society, Atlanta, Georgia, 2025.
    1. ACS , Cancer Facts and Figures, American Cancer Society, Atlanta, Georgia, 2020.
    1. Van Oekelen O., Nath K., Mouhieddine T. H., Farzana T., Aleman A., Melnekoff D. T., Ghodke‐Puranik Y., Shah G. L., Lesokhin A., Giralt S., Thibaud S., Rossi A., Rodriguez C., Sanchez L., Richter J., Richard S., Cho H. J., Chari A., Usmani S. Z., Jagannath S., Shah U. A., Mailankody S., Parekh S., Blood 2023, 141, 756. - PMC - PubMed
    1. Gartel A. L., Cancer Res. 2017, 77, 3135. - PMC - PubMed
    1. Gu C., Yang Y., Sompallae R., Xu H., Tompkins V. S., Holman C., Hose D., Goldschmidt H., Tricot G., Zhan F., Janz S., Leukemia 2016, 30, 873. - PMC - PubMed

MeSH terms

LinkOut - more resources