

Q-score as a reliability measure for protein, nucleic acid and small-molecule atomic coordinate models derived from 3DEM maps
- PMID: 40654171
- PMCID: PMC12315582
- DOI: 10.1107/S2059798325005923
Q-score as a reliability measure for protein, nucleic acid and small-molecule atomic coordinate models derived from 3DEM maps
Abstract
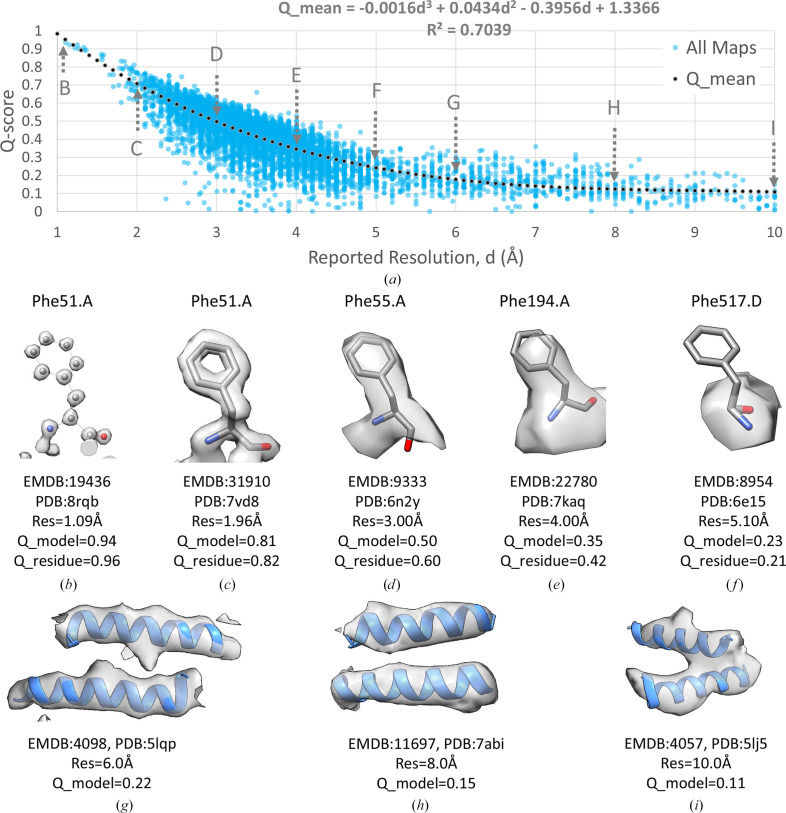
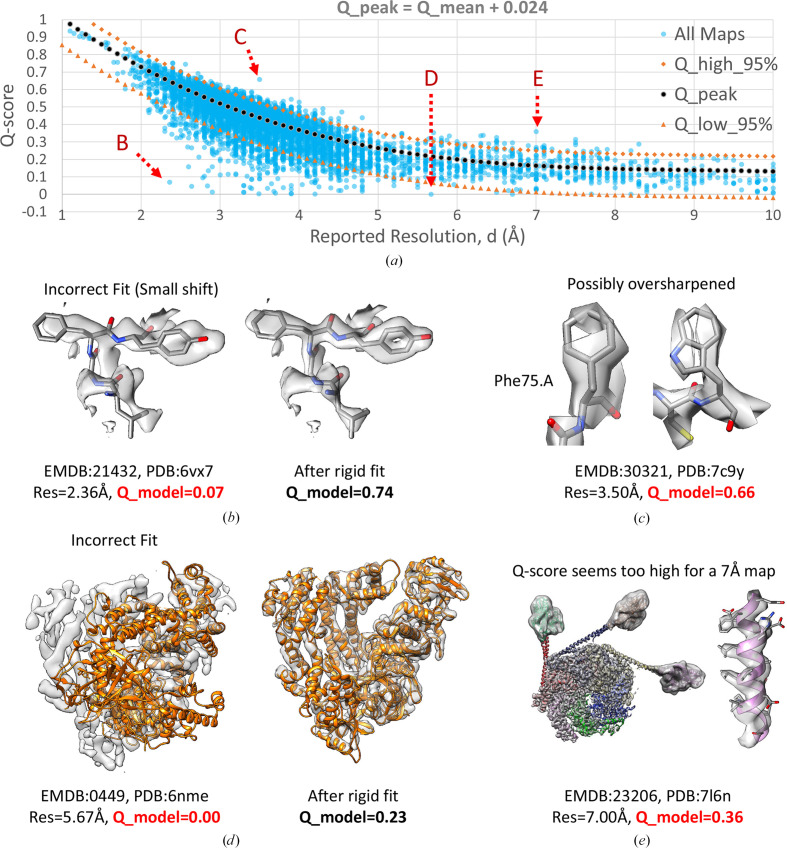
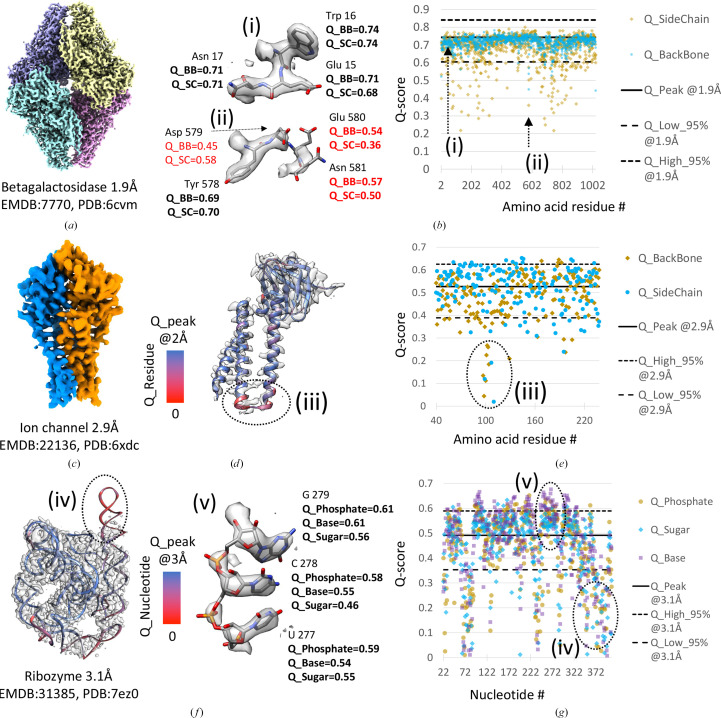
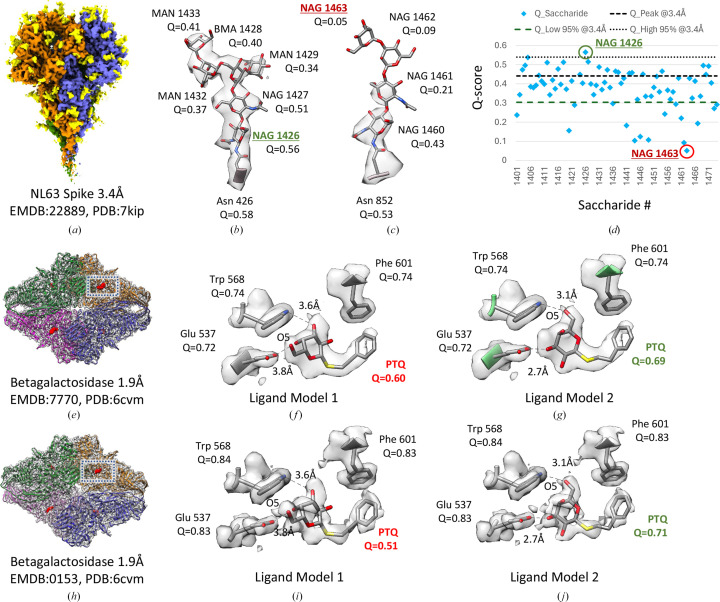
Atomic coordinate models are important for the interpretation of 3D maps produced with cryoEM and cryoET (3D electron microscopy; 3DEM). In addition to visual inspection of such maps and models, quantitative metrics can inform about the reliability of the atomic coordinates, in particular how well the model is supported by the experimentally determined 3DEM map. A recently introduced metric, Q-score, was shown to correlate well with the reported resolution of the map for well fitted models. Here, we present new statistical analyses of Q-score based on its application to ∼10 000 maps and models archived in the EMDB (Electron Microscopy Data Bank) and PDB (Protein Data Bank). Further, we introduce two new metrics based on Q-score to represent each map and model relative to all entries in the EMDB and those with similar resolution. We explore through illustrative examples of proteins, nucleic acids and small molecules how Q-scores can indicate whether the atomic coordinates are well fitted to 3DEM maps and also whether some parts of a map may be poorly resolved due to factors such as molecular flexibility, radiation damage and/or conformational heterogeneity. These examples and statistical analyses provide a basis for how Q-scores can be interpreted effectively in order to evaluate 3DEM maps and atomic coordinate models prior to publication and archiving.
Keywords: B factors; Q-scores; cryoEM; structure; validation.
open access.
Conflict of interest statement
The authors declare no conflicts of interest.
Figures
Update of
-
as a reliability measure for protein, nucleic acid, and small molecule atomic coordinate models derived from 3DEM density maps.bioRxiv [Preprint]. 2025 Jan 15:2025.01.14.633006. doi: 10.1101/2025.01.14.633006. bioRxiv. 2025. Update in: Acta Crystallogr D Struct Biol. 2025 Aug 1;81(Pt 8):410-422. doi: 10.1107/S2059798325005923. PMID: 39868161 Free PMC article. Updated. Preprint.
Similar articles
-
as a reliability measure for protein, nucleic acid, and small molecule atomic coordinate models derived from 3DEM density maps.bioRxiv [Preprint]. 2025 Jan 15:2025.01.14.633006. doi: 10.1101/2025.01.14.633006. bioRxiv. 2025. Update in: Acta Crystallogr D Struct Biol. 2025 Aug 1;81(Pt 8):410-422. doi: 10.1107/S2059798325005923. PMID: 39868161 Free PMC article. Updated. Preprint.
-
Electron microscopy holdings of the Protein Data Bank: the impact of the resolution revolution, new validation tools, and implications for the future.Biophys Rev. 2022 Dec 2;14(6):1281-1301. doi: 10.1007/s12551-022-01013-w. eCollection 2022 Dec. Biophys Rev. 2022. PMID: 36474933 Free PMC article. Review.
-
Management of urinary stones by experts in stone disease (ESD 2025).Arch Ital Urol Androl. 2025 Jun 30;97(2):14085. doi: 10.4081/aiua.2025.14085. Epub 2025 Jun 30. Arch Ital Urol Androl. 2025. PMID: 40583613 Review.
-
Recognizing amino acid sidechains in a medium-resolution cryo-electron density map.Protein Sci. 2025 Aug;34(8):e70217. doi: 10.1002/pro.70217. Protein Sci. 2025. PMID: 40719420
-
The Lived Experience of Autistic Adults in Employment: A Systematic Search and Synthesis.Autism Adulthood. 2024 Dec 2;6(4):495-509. doi: 10.1089/aut.2022.0114. eCollection 2024 Dec. Autism Adulthood. 2024. PMID: 40018061 Review.
References
MeSH terms
Substances
Grants and funding
- R01GM129325/National Institutes of Health, National Institute of General Medical Sciences
- 212977/Z/18/Z/WT_/Wellcome Trust/United Kingdom
- R24GM154186/National Institutes of Health, National Institute of General Medical Sciences
- R01 GM129325/GM/NIGMS NIH HHS/United States
- R01GM157729/National Institutes of Health, National Institute of General Medical Sciences
- DBI-2321666/National Science Foundation, Directorate for Biological Sciences
- DE-SC0019749/U.S. Department of Energy, Office of Science
- R24 GM154186/GM/NIGMS NIH HHS/United States
- P41 GM103311/GM/NIGMS NIH HHS/United States
- P41GM103311/National Institutes of Health, National Institute of General Medical Sciences
- WT_/Wellcome Trust/United Kingdom
- R01 GM157729/GM/NIGMS NIH HHS/United States
LinkOut - more resources
Full Text Sources
