Review
. 2025 Jun 27:5:1577840.
doi: 10.3389/fradi.2025.1577840. eCollection 2025.

Spinal lesions: a comprehensive radiologic overview

Affiliations
Review

Spinal lesions: a comprehensive radiologic overview

Zahin Alam et al. Front Radiol. .

Abstract

Spinal lesions encompass a diverse range of pathologies, including primary and secondary tumors, infectious processes, vascular malformations, traumatic injuries, and degenerative conditions, each with distinct imaging characteristics crucial for accurate diagnosis and management. Imaging plays vital roles in assessing lesion morphology, anatomical localization, and neurological impact, guiding clinical decision-making and therapeutic planning. This review systematically explores spinal lesions based on their anatomical compartments, highlighting key radiological features and providing a comprehensive reference for radiologists.

Keywords: MRI imaging; neoplastic and infectious pathology; radiological assessment; spinal lesions; spinal tumors.


Conflict of interest statement

The authors declare that the research was conducted in the absence of any commercial or financial relationships that could be construed as a potential conflict of interest.

Figures

Figure 1
Figure 1
Spinal anatomy. The adult vertebral column (A) consists of 24 vertebrae, plus the sacrum and coccyx. It is divided into cervical (C1–C7), thoracic (T1–T12), and lumbar (L1–L5) regions. Axial view of the vertebral body (B) illustrates the arch formed by pedicles and laminae. Sagittal view of the vertebral column (C) shows the alignment of the vertebral body and intervertebral foramina for spinal nerve exit, the vertebral foramen for spinal cord passage, and intervertebral discs connecting adjacent bodies.
Figure 2
Figure 2
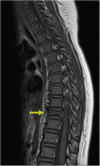
Astrocytoma. Sagittal T2 (A), axial T2 (B), axial T1 FS + C (C) MRI of the thoracic spine demonstrating an intramedullary expansile T2 hyperintense mass (yellow arrows) in the thoracic cord at the T10–T11 level without post-contrast enhancement representing biopsy-proven Grade 1 Pilocytic Astrocytoma.
Figure 3
Figure 3
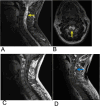
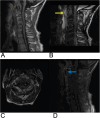
Ependymoma. Sagittal T2 (A), Axial T2 (B), Sagittal T1 FLAIR (C), and sagittal T1 FLAIR FAT + C (D) MRI of the cervical spine demonstrating intramedullary expansile multiloculated T2 hyperintense cystic lesions (yellow arrows) in the cervical cord spanning from C2–C5 with edema at the inferior aspect of the lesions. There are associated enhancing tumoral nodules in the spinal cord representing spinal ependymoma (blue arrow). No evidence of hemorrhage.
Figure 4
Figure 4
Hemangioblastoma. Axial T2 (A), sagittal T2 (B), & sagittal T1 FAT + C (C) MRI depicting a T2 hyperintense lesion (yellow arrow) at the C2 level representing a hemangioblastoma in this patient with a known history of Von Hippel Lindau Syndrome.
Figure 5
Figure 5
Spinal AVM. Axial T2 at the T4 level (A), Axial T2 at the T7 level (B), axial T1 + C at the T1/T2 level (C), sagittal T2 (D), and sagittal T1 FLAIR FAT + C (E) MRI of the thoracic spine demonstrating multifocal enhancement with associated expansion of the spinal cord (red arrow) involving the upper thoracic spine with prominent sub-adjacent flow voids (yellow arrow) within the right intradural and extradural space and dilation of the anterior spinal artery (blue arrow) representing spinal AVM.
Figure 6
Figure 6
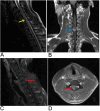
Spinal cord injury. Sagittal T2 PROP (A), coronal T1 FLAIR + C (B), sagittal T1 FLAIR FAT + C (C), and axial 3D FSPGR Fat + C (D) MRI of the cervical spine showing C5-C6 cord compression (yellow arrow) resulting from posterior disc/osteophyte complex herniation. There is associated enhancement of the right hemi-cord (blue arrow) in the “pancake configuration” (red arrows) representing compressive myelopathy
Figure 7
Figure 7
Syringomyelia. Sagittal T2 (A), axial T2 (B), axial (C), sagittal T1 + C (D) MRI of the cervical and thoracic spine demonstrating a syrinx within the cervical spinal cord presenting as a hyperintense cystic cavity extending through multiple spinal segments (yellow arrows). There is edema surrounding the dilated syrinx reflecting altered CSF dynamics and cord expansion. Axial MRI illustrates a rounded, cystic cavity in the spinal cord, appearing hyperintense. The syrinx does not significantly enhance on post-contrast T1WI (blue arrow).
Figure 8
Figure 8
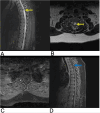
Spinal cord infarction. Sagittal T2 (A), sagittal T1 FAT + C (B), sagittal DWI (C), and sagittal ADC (D) MRI of the thoracic spine demonstrating a long segment of abnormal restricted diffusion (blue arrow) from approximately T5 to the conus medullaris with associated central cord T2 signal abnormality (yellow arrow) extending from T5 through the conus medullaris concerning for spinal cord infarct.
Figure 9
Figure 9
Transverse myelitis. Sagittal T2 (A) and sagittal T1 + C (B) MRI demonstrating a long segment of T2 (blue arrow) and T1C hyperintense signals (yellow arrow) occupying greater than two-thirds of the cross-sectional area of the cord representing transverse myelitis.
Figure 10
Figure 10
Demyelinating disease. Sagittal (A) and axial (B) T2-weighted MRI demonstrating multiple demyelinating plaques in the spinal cord (yellow arrows) consistent with multiple sclerosis.
Figure 11
Figure 11
Meningioma. Sagittal T2 STIR (A), sagittal T1 FLAIR FAT + C (B), axial T1 FAT + C (C) MRI of the thoracic spine demonstrating an intradural, extramedullary oval-shaped enhancing lesion (yellow arrow) representing a spinal canal meningioma involving the right dorsolateral aspect of the thecal sac at the T2 level with moderate narrowing of the spinal canal.
Figure 12
Figure 12
Schwannoma. Sagittal T2 (A), sagittal T1 + C (B), axial T1 + C, axial T2 (D) MRI of the lumbar spine demonstrating an intradural, extramedullary enhancing foci (yellow arrows) at the T12 level representing a biopsy-proven schwannoma causing mass effect affecting the spinal cord.
Figure 13
Figure 13
Neurofibroma. Sagittal T2 FLAIR (A), sagittal T1 FLAIR + C (B), and axial T1 FAT + C (C) MRI demonstrating numerous neurofibromas (yellow arrows) throughout the lumbosacral spine with involvement of the L3–L4 and S1–S4 levels along the greater sciatic notch with associated remodeling of the neural foramina.
Figure 14
Figure 14
Epidural abscess. Sagittal T1 + C (A), axial T2 (B), sagittal T2 (C), and axial T1 + C (D) MRI demonstrating a T2 hyperintense lesion (yellow arrow) at the epidural space encroaching on the spinal canal and causing spinal cord compression. The abscess is peripherally enhancing on post-contrast T1 weighted MRI (blue arrows) consistent with surrounding inflammatory tissue.
Figure 15
Figure 15
Epidural hematoma. Sagittal T1 (A), sagittal T1 + C (B), and sagittal T2 (C) MRI as well as an axial CT (D) of the thoracic spine demonstrating a T1 isointense, T2 hyperintense (yellow arrow), and CT isodense collection in the dorsal epidural space of the midthoracic spine representing epidural hematoma with associated mass effect on the spinal cord.
Figure 16
Figure 16
Epidural tumor. Axial T1 + C (A) and Sagittal T1 + C (B) MRI demonstrating an enhancing epidural malignant lesion (blue arrow) extending laterally through the neural foramen with infiltration of the left psoas muscle (yellow arrow) and associated spinal cord compression.
Figure 17
Figure 17
Disc degeneration. Sagittal T2 (A), sagittal T1 (B), and axial T2 (C) MRI demonstrating chronic spondylitic degenerative changes at L4/5 including diffuse disc bulge (blue arrow), loss of intervertebral disc height, and Modic Type 1 endplate degenerative changes (yellow arrow).
Figure 18
Figure 18
Disc herniation. Sagittal T2 (A) and axial T2 (B) MRI of the lumbar spine demonstrating a large right paracentral broad-based disc herniation at the L5-S1 level (yellow arrow) with the herniated disc pushing into the spinal canal. On axial MRI, the herniated disc can be seen causing effacement of the right subarticular zone with compression of the right S1 nerve root (blue arrow).
Figure 19
Figure 19
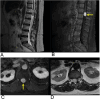
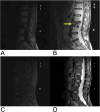
Discitis-Osteomyelitis. Sagittal T2 (A), Sagittal T1 + C (B), and axial T1 + C (C) MRI of the lumbar spine demonstrating acute discitis osteomyelitis involving the L2–L3 level with endplate erosive changes (yellow arrow), post-contrast enhancement (blue arrow), and trace fluid in the intervertebral disc space. There is posterior ventral epidural extension of the phlegmonous changes and bilateral paravertebral extension of the enhancement involving the psoas muscles bilaterally (red arrow).
Figure 20
Figure 20
Vertebral hemangioma. Sagittal T2 (A), sagittal T1 (B), sagittal T1 FAT + C (C), and axial T2 (D) MRI of the thoracic spine demonstrating a granular “salt and pepper” T1 & T2 hyperintense (yellow arrows), heterogeneously enhancing (blue arrow) lesion representing hemangioma of the T7 vertebral body.
Figure 21
Figure 21
Osteoblastoma. Sagittal T1 + C MRI (A) as well as Sagittal CT (B) and Axial CT (C) of the cervical spine demonstrating a calcified enhancing lesion (yellow arrow) in the C7 left lateral mass representing osteoblastoma (blue arrow).
Figure 22
Figure 22
Osteosarcoma. Sagittal T1 + C (A), Axial T1 + C (B) MRI as well as axial CT (C) and sagittal CT (D) of the lumbar spine demonstrating a large, destructive mass in the sacral region (yellow arrows) indicating osteosarcoma with adjacent soft tissue involvement.
Figure 23
Figure 23
Vertebral metastases. Sagittal T2 (A), sagittal T1 + C (B), axial T2 (C), and axial 3D FSPGR FAT + C (D) MRI showing destructive, enhancing lesions (yellow arrow) within the T4 vertebral body extending into the bilateral pedicles as well as an enhancing lesion (blue arrow) in the anterior aspect of the T11 vertebral body. There are also several smaller foci of enhancement scattered throughout the thoracic spine suspicious for smaller metastases.
Figure 24
Figure 24
Multiple myeloma. Sagittal T1 (A), sagittal T2 (B), sagittal T1 + C (C), and sagittal STIR (D) MRI of the lumbar spine demonstrating diffuse T1 hypointense, heterogenous T2 hyperintense, and T1 + C enhancing lesions representing vertebral manifestations of multiple myeloma. There is a chronic L3 superior endplate pathologic fracture with approximately 30% loss of vertebral body height (yellow arrow) and retropulsion of posterior vertebral body cortex.
Figure 25
Figure 25
Spinal lymphoma. Sagittal T1 + C (A), sagittal T2 (B), and sagittal STIR (C) MRI demonstrating heterogeneous, intermediate T2 signal intensity changes, contrast enhancement (yellow arrows), and STIR hyperintensity (blue arrow) in the involved vertebrae indicative of lymphomatous infiltration.
Figure 26
Figure 26
Vertebral compression fractures. Sagittal T1 (A) and sagittal STIR (B) MRI of the thoracic spine demonstrating osteoporotic compression fracture of upper thoracic vertebrae (yellow arrow) with height loss.
Figure 27
Figure 27
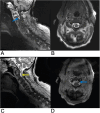
Retropharyngeal abscess. Sagittal T1 (A), sagittal T2 (B), axial T1 (C), and sagittal T1 + C (D) MRI of the cervical spine demonstrating a retropharyngeal abscess appearing as a T2 hyperintense fluid collection (yellow arrow), with peripheral enhancement (blue arrow) located posterior to the pharynx and anterior to the cervical spine with significant prevertebral soft tissue swelling causing displacement of the spinal cord at the C3–C4 level.
Figure 28
Figure 28
Block vertebra. Sagittal T1 (A) and sagittal T2 (B) MRI demonstrate absent intervertebral disc space due to congenital block vertebra resulting from failed vertebral segmentation. There is T1 hypointensity (yellow arrow) and T2 hyperintensity in adjacent soft tissues suggesting secondary changes or abnormal spinal curvature.
Figure 29
Figure 29
Congenital butterfly vertebra. Sagittal T2 MRI of the lumbar spine demonstrating a congenital T9 thoracic butterfly vertebra.
Figure 30
Figure 30
Enostosis. Sagittal T2 (A), sagittal T1 FLAIR FAT + C (B), and axial T2 (C) MRI as well as a sagittal CT (D) of the lumbar spine demonstrating a T1/T2 hypointense, sclerotic (yellow arrow) and CT hyperdense (blue arrow) lesion within the left anterior aspect of the L4 vertebral body representing enostosis.

References

    1. Kumar N, Tan WLB, Wei W, Vellayappan BA. An overview of the tumors affecting the spine—inside to out. Neurooncol Pract. (2020) 7(1):i10–7. 10.1093/nop/npaa049 - DOI - PMC - PubMed
    1. Van Goethem JWM, van den Hauwe L, Özsarlak Ö, De Schepper AMA, Parizel PM. Spinal tumors. Eur J Radiol. (2004) 50(2):159–76. 10.1016/j.ejrad.2003.10.021 - DOI - PubMed
    1. Tomura N. Imaging of tumors of the spine and spinal cord. Nihon Igaku Hoshasen Gakkai Zasshi. (2000) 60(6):302–11. - PubMed
    1. Hussain O, Kaushal M, Agarwal N, Kurpad S, Shabani S. The role of magnetic resonance imaging and computed tomography in spinal cord injury. Life. (2023) 13(8):1680. 10.3390/Life13081680 - DOI - PMC - PubMed
    1. Bogduk N. Functional anatomy of the spine. Handb Clin Neurol. (2016) 136:675–88. 10.1016/B978-0-444-53486-6.00032-6 - DOI - PubMed

LinkOut - more resources