[Preprint]. 2025 May 10:2025.05.06.652454.
doi: 10.1101/2025.05.06.652454.

Chromosomal instability shapes the tumor microenvironment of esophageal adenocarcinoma via a cGAS-chemokine-myeloid axis

Affiliations

Chromosomal instability shapes the tumor microenvironment of esophageal adenocarcinoma via a cGAS-chemokine-myeloid axis

Bruno Beernaert et al. bioRxiv. .

Abstract

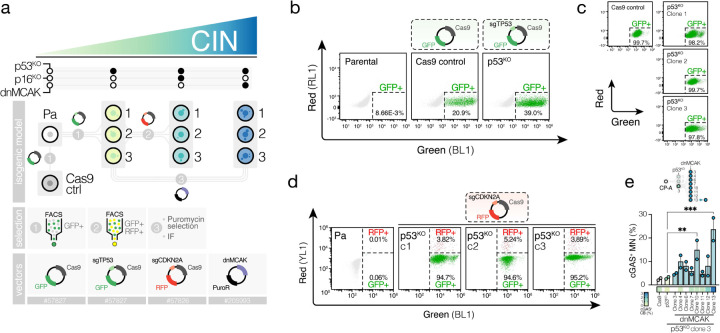
Chromosomal instability (CIN), a characteristic feature of esophageal adenocarcinoma (EAC), drives tumor aggressiveness and therapy resistance, presenting an intractable problem in cancer treatment. CIN leads to constitutive stimulation of the innate immune cGAS-STING pathway, which has been typically linked to anti-tumor immunity. However, despite the high CIN burden in EAC, the cGAS-STING pathway remains largely intact. To address this paradox, we developed novel esophageal cancer models, including a CIN-isogenic model, discovering myeloid-attracting chemokines - with the chemokine CXCL8 (IL-8) as a prominent hit - as conserved CIN-driven targets in EAC. Using high-resolution multiplexed immunofluorescence microscopy, we quantified the extent of ongoing cGAS-activating CIN in human EAC tumors by measuring cGAS-positive micronuclei in tumor cells, validated by orthogonal whole-genome sequencing-based CIN metrics. By coupling in situ CIN assessment with single-nucleus RNA sequencing and multiplex immunophenotypic profiling, we found tumor cell-intrinsic innate immune activation and intratumoral myeloid cell inflammation as phenotypic consequences of CIN in EAC. Additionally, we identified increased tumor cell-intrinsic CXCL8 expression in CINhigh EAC, accounting for the inflammatory tumor microenvironment. Using a novel signature of CIN, termed CINMN, which captures ongoing CIN-associated gene expression, we confirm poor patient outcomes in CINhigh tumors with signs of aberrantly rewired cGAS-STING pathway signaling. Together, our findings help explain the counterintuitive maintenance and expression of cGAS-STING pathway components in aggressive, CINhigh tumors and emphasize the need to understand the contribution of CIN to the shaping of a pro-tumor immune landscape. Therapeutic strategies aimed at disrupting the cGAS-driven inflammation axis may be instrumental in improving patient outcomes in this aggressive cancer.

Keywords: Chromosomal instability; cGAS; chemokine; esophagogastric cancer; myeloid; tumor microenvironment.


Figures

Extended Data Figure 1.
Extended Data Figure 1.. cGAS–STING expression across esophageal cancers and cell lines.
(a) Pie chart showing the mutations and copy-number alterations in the genes encoding cGAS and STING across 182 surveyed esophageal tumors comprised in the TCGA database. (b) Violin plots of mean CpG-aggregated promoter methylation β-values levels in esophageal primary tumor samples (ESCA) and putatively normal adjacent tissue (NAT) samples (i.e. ’solid tissue normal’) from the TCGA for genes encoding cGAS and STING. Significance was determined by Mann-Whitney U test. (c) Heatmap of log2(fold-change) differences between primary tumor and putatively healthy adjacent tissue sample mRNA abundance (TPM-normalized) of cGAS and STING for select solid tumor types comprised within the TCGA. Significance was determined by Mann-Whitney U test. (d) Tukey box plots of log2-normalized cGAS (left panel) and STING (right panel) mRNA expression (RPKM+1) levels for Cancer Cell Line Encyclopedia (CCLE) cell lines grouped by cell line origin. Box plots are plotted in descending order based on median expression values. Box plots for esophagus-derived cancer cell lines are highlighted in purple. (e) Quantitative reverse transcription (RT-qPCR) analysis of steady-state cGAS and STING mRNA expression levels across BE and EAC cell lines, normalized to the 18S housekeeping gene. Average cGAS–STING expression represents the average of min-max-normalized -ΔCt values. Data from Barrett’s esophagus (BE) cell lines are shown in light blue, data from EAC lines are shown in purple. Bars are shown as the mean ± SEM from n=3 independent experiments and were analyzed by one-way ANOVA with FDR-based correction. **** p ≤0.0001, *** p ≤0.001, ** p ≤0.01.
Extended Data Figure 2.
Extended Data Figure 2.. Chromosomal instability features in esophageal adenocarcinoma cell lines.
(a) Representative confocal microscopy image of SK-GT-4 cells following treatment with the MPS1 inhibitor reversine (0.5 μM) for 48h, comprising examples of scored CIN features, including cGAS and cGAS+ micronuclei, as well as cGAS+ chromatin bridges. Cells were stained with anti-cGAS and Hoechst (DNA). The image represents a maximum-intensity projection of a Z-stack taken at 1 μm intervals. Scale bar corresponds to 20 μm. (b) Difference in frequency (number of features / 100 cells) of scored CIN features between MPS1 inhibitor-(0.5 μM, 48h) and DMSO-treated cells. Barrett’s esophagus (BE). Bars represent the mean ± SEM of n=2 (CP-A) or n=3 (all other lines) independent experiments, with ~≥100 cells counted per experiment. Data analyzed by two-sided unpaired t-test. (c) Scatter plots of baseline cGAS+ chromosomal instability-associated feature (cGAS+ micronuclei and cGAS+ chromatin bridges) frequencies versus baseline micronuclei frequencies across BE and EAC cell lines. Dots represent the mean ± SEM of n=3 independent experiments, with ~≥100 cells counted per experiment. Shown are estimated simple linear regression lines, 95% confidence intervals, Pearson correlation coefficients (Rp) and p-values from Pearson correlation analyses. **** p ≤0.0001, *** p ≤0.001, ** p ≤0.01, * p ≤0.05.
Extended Data Figure 3.
Extended Data Figure 3.. cGAS knockout and CIN-driven cGAS-dependent target validation in esophageal adenocarcinoma cells.
(a) Representative immunoblot of OE33, SK-GT-4 and FLO-1 cells showing depletion of cGAS protein expression in cGASKO clones compared to parental and Cas9 (empty-vector) control cells and Cas9 expression in Cas9 control and cGASKO clones, but not parental cell lines. β-actin is used as a loading control. Data are representative of n=2 independent experiments. (b) Densitometry analysis of cGAS protein levels in OE33, SK-GT-4 and FLO-1 cells, showing suppression of cGAS protein in cGASKO clones, but not Cas9 control and parental cells. Band intensities have been normalized to loading controls and parental cell cGAS protein intensity for each experiment. Bars are shown as the mean ± SEM from n=2 independent experiments and were analyzed by ANOVA with FDR correction for each cell line. (c) Quantitative reverse transcription (RT-qPCR) analysis of baseline cGAS mRNA expression levels across OE33, SK-GT-4 and FLO-1 Cas9 and cGASKO clones. CGAS Ct values are normalized to the 18S housekeeping gene using the ΔCT method and are expressed relative to normalized Cas9 control cGAS expression levels. Bars are shown as the mean ± SEM from n=3 independent experiments and were analyzed by ANOVA with FDR correction for each cell line. (d) Relative extracellular concentrations of 2’3’-cGAMP (determined through 2’3’-cGAMP ELISA) across OE33, SK-GT-4 and FLO-1 cGASKO (clone #1 for each) and Cas9 control clones, showing enhanced cGAMP production in cGAS-proficient (Cas9 control) clones upon CIN induction (MPS1i) and DNA transfection (G3-YSD), but not in cGASKO clones (clone #1 used for each line). Cells have either been pulse-treated with DMSO or 1 μM MPS1i (reversine) for 24h, 48h prior to media collection, or transfected with 2.5 μg/mL Y-form DNA (G3-YSD) 24h prior to collection. 2’3’-cGAMP concentrations have been normalized to absolute cell counts ([cGAMP] / 106 cells) at treatment endpoint and are expressed relative to concentrations in DMSO-treated Cas9 control cells for each cell line. Bars are shown as the mean ± SEM from n=3 independent experiments and were analyzed by ANOVA with FDR correction for each cell line. (e, f) Principal component analysis of transcriptomes of DMSO and MPS1i (0.5 μM, 48h)-treated Cas9 and cGASKO clones of the (e) OE33 cell line and (f) SK-GT-4 line. (g, h) Volcano plots of differential gene expression analysis in (g) OE33 and (h) SK-GT-4 cGAS-proficient Cas9 control cells between MPS1i (reversine)-treated (0.5 μM, 48h) and control (DMSO)-treated cells. Genes highlighted in dark blue or dark grey are significantly more upregulated or downregulated (paired t-test p ≤0.05) in Cas9 versus cGASKO cells (i.e. ‘cGAS-dependent’) upon treatment. Genes related to the immune system (’Immune System Process’-annotated) are highlighted with a border; genes with known cytokine activity (mapping to ’Cytokine activity’ GO term, GO:0005125) are highlighted with a central dot. (i) Heatmap of quantitative reverse transcription (RT-qPCR) analysis of the immune targets IL6, CXCL8, CXCL2 and IFIT2 in OE33 and SK-GT-4 Cas9 and cGASKO clones treated for 48h with DMSO or 0.5 μM reversine (MPS1i). Fold-changes were derived using the 2−ΔΔCt method, normalizing expression values to 18S expression and corresponding DMSO control treatment gene expression. Color maps to log2-transformed fold-changes (FC) between MPS1i-treated cells and DMSO-treated cells. Boxes with solid borders correspond to clones with a significantly different log2(FC) for that gene compared to its corresponding Cas9 control FC value. Values inside heatmaps represent the mean log2(FC) for a gene across n=3 or n=6 independent experiments and were analyzed independently by ANOVA with FDR correction, comparing log2(FC) induction of each gene in cGASKO clones to that of its respective Cas9 control clone. (j) IL-8 concentrations (determined by ELISA) in conditioned media of cells pulse-treated with DMSO or 1 μM reversine (MPS1i) for 24h, followed by 48h media conditioning in the absence of treatment. IL-8 concentrations have been normalized to respective DMSO-treatment concentrations for each genotype. Grey and blue shades correspond to Cas9 and cGASKO genotypes, respectively. Darker shades correspond to MPS1i-treatment, whereas lighter shades correspond to DMSO treatment. Bars represent the mean ± SEM from n=3 independent experiments and were analyzed by ANOVA with FDR correction for each cell line. (k) Quantitative reverse transcription (RT-qPCR) analysis of IL6 and CXCL8 mRNA fold-inductions upon MPS1i versus DMSO control treatment in Cas9 and cGASKO FLO-1 cells. Fold-changes were derived using the 2−ΔΔCt method, normalizing expression values to 18S expression and DMSO control treatment gene expression levels. Bars are shown as the mean ± SEM from n=3 independent experiments and were analyzed by ANOVA with FDR correction for each gene. **** p ≤0.0001; *** p ≤0.001; ** p ≤0.01; * p ≤0.05; ns, not significant.
Extended Data Figure 4.
Extended Data Figure 4.. Generation of an isogenic non-dysplastic Barrett’s esophagus cell line model of variable chromosomal instability.
(a) Schematic of the experimental strategy used to generate an isogenic cell line model with varying levels of CIN, starting with an hTERT-immortalized, non-dysplastic BE-derived CP-A founder. Parental (Pa) CP-A cells were sequentially altered to disrupt intrinsic barriers to chromosomal instability, through CRISPR-Cas9-mediated targeting of TP53 (encoding p53) and CDKN2A (encoding p16) and disruption of mitotic checkpoints through overexpression of a dominant-negative mutant form of the mitotic regulator MCAK (dnMCAK). A Cas9 control (Cas9 ctrl) clone, expressing the pL-CRISPR.SFFV.eGFP, was generated to control for confounding effects associated with Cas9 overexpression. Clonal selections were performed through single-cell sorting, sorting GFP+ cells (p53KO) and GFP+RFP+ cells (p53p16DKOs), as well as through puromycin selection (p53KOdnMCAKs, expressing the puromycin resistance [PuroR] gene) and limiting dilution, followed by immunofluorescence-based screening of micronucleation rates. Cloning was performed in triplicate, with three independent clones for every altered genotype (aside from Cas9 control cells) to avoid clone-specific confounding effects. Vector codes correspond to Addgene plasmid numers. (b) Flow cytometric profiling of untransduced parental CP-A cells and CP-A cells transduced with CRISPR.SFFV.eGFP (Cas9 mixed population) and CRISPR.SFFV.eGFP.sgTP53 (p53KO mixed population) lentiviral vectors. Cells were gated on the GFP+ population for single-cell sorting. (c) Flow cytometric profiling of expanded Cas9 and p53KO single-cell clones, gated on GFP+ as in (a), showing a universal uptake of CRISPR.SFFV.eGFP vectors among selected clones. (d) Flow cytometric profiling of untransduced parental CP-A cells and p53KO clones transduced with CRISPR.SFFV.tRFP (p53p16DKO mixed population) lentiviral vectors. Cells were gated on the indicated GFP+RFP+ population for single-cell sorting. (e) Example of IF-based screening of candidate p53KOdnMCAK single-cell clones (derived from p53KO clone 3) for CINhigh clones, showing quantifications of cGAS+ chromatin bridges (heatmap) and cGAS+ micronuclei. Bars represent the mean of cGAS+ MN frequencies ± SEM of n=2 technical replicates (two independent slides per clone, seeded in parallel), with ~≥100 cells counted per experiment. Data were analyzed by ANOVA with FDR correction, comparing all candidate clones to the Cas9 control clone. *** p ≤0.001, ** p ≤0.01.
Extended Data Figure 5.
Extended Data Figure 5.. Validation of an isogenic non-dysplastic Barrett’s esophagus model founder line and derived genotypes.
(a) Relative extracellular concentrations of 2’3’-cGAMP (determined by ELISA) in CP-A cells that were mock transfected or transfected with 2.5 μg/mL G3-YSD 24h prior to sample collection. 2’3’-cGAMP concentrations have been normalized to absolute cell counts ([cGAMP] / 106 cells) at treatment endpoint and are expressed relative to concentrations in mock-transfected CP-A cells. Bars are shown as the mean ± SEM from n=3 independent experiments and were analyzed by two-sided unpaired t-test. (b) Immunoblot of CP-A cells mock transfected or transfected with 10 μg/mL exogenous 2’3’-cGAMP, showing increased activating phosphorylation of IRF3 at Ser396 upon cGAMP treatment. Data are representative of n=2 independent experiments. CYPB is used as a loading control (c) Densitometric quantification of (b), showing the ratio between phosphorylated IRF3 (Ser396) and total IRF3 protein abundance. Band intensities have been normalized to CYPB abundance and are expressed relative to normalized mock transfection band intensities. Bars are shown as the mean ± SEM of n=2 independent experiments and were analyzed by two-sided unpaired t-test. (d) Immunoblot of CP-A cells treated with diluent (DMSO) or 10 μm Nutlin-3 for 24h, showing p53 and p21 accumulation in CP-A cells, indicative of a proficient p53 pathway. Vinculin (VCL) is used as a loading control. Data are representative of n=2 independent experiments. (e) Densitometric quantification of (d), showing p53 and p21 accumulation in CP-A cells upon Nutlin-3 treatment. Band intensities have been normalized to loading control abundance, expressed relative to normalized DMSO band intensities. Bars are shown as the mean ± SEM of n=2 independent experiments and were analyzed by two-sided unpaired t-test. (f) Heatmap of TP53 and CDKN2A sgRNA target site knockout scores (Synthego ICE tool) for Cas9, p53KO, p53p16DKO and p53KOdnMCAK CP-A clones. Parental sequences have been used as a reference. Target sites are shown. (g) Titration of Nutlin-3 in a 5-day viability (WST-8) assay for parental, Cas9 control, p53KO and p53KOdnMCAK CP-A cells. Data are from n=3 independent experiments, with n=3 technical replicates per experiment. Data are represented as mean ± SEM. Genotype-level averages have been pooled for visualization purposes. (h) Quantification of Nutlin-3 IC50 values from IC50 dose-response curves in (g). Bars represent the mean ± SEM of indicated genotypes. Datapoints represent the mean of n=3 independent experiments, with n=3 technical replicates per experiment. Datapoint shapes represent clone numbers. Significance was tested by one-way ANOVA with Tukey’s HSD. (i) Immunoblot of parental, Cas9 control and p53KO CP-A cells, showing depletion of p53 in p53KO clones and Cas9 expression in Cas9 control and p53KO cells. Data are representative of n=2 independent experiments. β-actin is used as a loading control. (j) Densitometry analysis of (i). Band intensities are normalized to the loading control and parental cell band intensities. Bars represent the mean ± SEM. Significance was tested by one-way ANOVA with Tukey’s HSD. (k) Titration of puromycin in a 3-day viability (WST-8) assay for p53KO and p53KOdnMCAK CP-A cells. Data are from n=3 independent experiments, with n=3 technical replicates per experiment. Data are represented as mean ± SEM. Genotype-level averages have been pooled for visualization purposes. (l) Quantification of puromycin IC50 values from IC50 dose-response curves in (k). Bars represent the mean ± SEM of indicated genotypes. Datapoints represent the mean of n=3 independent experiments, with n=3 technical replicates per experiment. Datapoint shapes represent clone numbers. Significance was tested by two-tailed ratio paired t-test. (m) Immunoblot of parental, p53KO and p53KOdnMCAK CP-A cells, showing elevated MCAK expression in p53KOdnMCAK clones. Data are representative of n=3 independent experiments. CYPB is used as a loading control. (n) Densitometry analysis of (m). Band intensities were normalized to the loading control and parental cell band intensities. Bars represent the mean ± SEM. Significance was tested by two-tailed paired t-test. **** p ≤0.0001; *** p ≤0.001; ** p ≤0.01; * p ≤0.05.
Extended Data Figure 6.
Extended Data Figure 6.. Validation of CIN-associated immune targets in an isogenic non-dysplastic Barrett’s esophagus cell line model.
(a, b) Quantitative reverse transcription (RT-qPCR) analysis of baseline expression of the immune targets IL6, CXCL8, and CXCL1 among CP-A cell model lines. Fold-changes were derived using the 2−ΔΔCt method, normalizing expression values to 18S expression and expression values in Cas9 control cells. (a) Bars for p53KO, p53p16DKO, p53KOdnMCAK genotypes represent the mean of n=3 independent clones ± SEM, where each point represents the mean of n=3 independent experiments for a given clone. Bars for Cas9 cells represent the mean ± SEM of n=3 independent experiments. Data were analyzed by ANOVA with FDR correction, comparing fold-changes in p53KO, p53p16DKO and p53KOdnMCAK genotypes to Cas9. Statistical analysis was performed on log2-transfomed data. (b) Linear relationship between baseline cGAS+ MN burden for CP-A-derived cell lines and qPCR-derived relative expression levels of immune targets. Each point and its associated error bars represent the mean ± SEM of n=3 independent qPCR experiments (y-axis) and n=3 independent IF experiment (x-axis). Clone numbers are indicated. Pearson correlation analysis coefficients (Rp) and p-values are shown. Statistical analysis was performed on log2-transfomed data. (c) IL-8 concentrations (determined by ELISA) in conditioned media (conditioned for 48h) of CP-A-derived cell lines. Bars for p53KO, p53p16DKO, p53KOdnMCAK genotypes represent the mean value across n=3 independent clones ± SEM, where each point represents the mean of n=3 independent experiments for a given clone. The bar for Cas9 cells represents the mean ± SEM of n=6 independent experiments. Datapoint shape indicates clone number for p53KO, p53p16DKO and p53KOdnMCAK clones. Data were analyzed by ANOVA with FDR correction, comparing genotype-level IL-8 concentrations in p53KO, p53p16DKO and p53KOdnMCAK genotypes to Cas9. Significant ANOVA p-values for individual clones (not pooled by genotype) are shown in the sidebar. *** p ≤0.001. (d) Immunoblot of CP-A cell lines showing increased abundance of the non-canonical NF-κB pathway components p100 and p52. CYPB was used as a loading control. Data are representative of n=2 independent experiments. (e) Densitometry analysis of (d). Band intensities are normalized to the loading control and parental cell band intensities. The ratio of p52 to p100 normalized protein abundance is shown. Bars for p53KO and p53KOdnMCAK genotypes represent the mean of n=3 independent clones ± SEM, where each point represents the mean of n=2 independent experiments for a given clone. Bars for Cas9 cells represent the mean ± SEM of n=2 independent experiments. Data were analyzed by ANOVA with Tukey’s HSD.
Extended Data Figure 7.
Extended Data Figure 7.. Validation of a novel transcriptional signature of chronic ongoing chromosomal instability in esophageal cells.
(a) Scatter plot of microscopy-derived baseline cGAS+ MN frequencies (exemplar image shown) versus CINMN scores (derived from CCLE RNA-sequencing data) for indicated EAC cell lines. The simple linear regression line, 95% confidence intervals, Pearson and Spearman correlation coefficients (Rp and Rs, respectively), and p-values are shown. (b) Linear association between CINMN score and orthogonal metrics of CIN (CIN70 signature score and Aneuploidy score) across cell lines of the Cancer Cell Line Encyclopedia (CCLE). Colored lines represent simple linear regression lines in specific cell lineages. The significance of the association between CINMN and other CIN scores is derived using a linear model accounting for cell lineage as a covariate. The black regression line and grey 95% confidence intervals correspond to the marginal effect estimates of CINMN on CIN score over different cell lineages. (c, d) Linear association between CINMN score and orthogonal metrics of CIN (CIN70 signature score and aneuploidy score) across (c) EAC tumors and (d) chromosomally unstable stomach adenocarcinoma (STAD-CIN) tumors comprised in The Cancer Genome Atlas (TCGA). The significance of the association between CINMN and other CIN scores is derived using a linear model accounting for tumor purity and leukocyte fraction as covariates. The black regression line and grey 95% confidence intervals correspond to the marginal effect estimates of CINMN on CIN score over covariates. (e) Heatmap of gene set enrichment analysis (GSEA) outputs, showing MSigDB Hallmark gene sets that are most strongly commonly enriched with orthogonal CIN metrics (Aneuploidy score, CIN70, CINMN) in EAC tumors from the TCGA. GSEA of a CXCR1/2 ligand (CXCR1/2L; CXCL1–3, CXCL5–8) signature shows a positive enrichment across all three CIN metrics. **** p ≤0.0001; *** p ≤0.001; ** p ≤0.01; * p ≤0.05. (f) Volcano plot showing outputs of a linear model looking at the association between CINMN score and gene expression that are conditional on cGAS–STING expression (whilst accounting for leukocyte fraction and tumor purity as confounders) in EAC tumor from the TCGA. Slopes and p-values of genes indicate the strength of association with CINMN across EAC tumors. Genes that have an additional dependence (i.e. a statistically significant interaction; interaction term p ≤0.05) on cGAS–STING expression are highlighted through size. Genes annotated with the ’Cytokine signaling’ gene ontology term (GO:0019221) are highlighted in orange. Genes with known IFN-α/β (R-HSA-909733) or IFN-γ (R-HSA-877300) pathway involvement are highlighted in red. Genes with reported cytokine activity (GO:0005125) are marked by a border. The right panel includes examples of linear model predictions of the relationship between select genes (CXCL8, IL6, CSF3) across multiple levels of tumoral cGAS–STING expression. (g) Overrepresentation analysis (using Reactome and Gene Ontology: Biological Process pathway sets) of cGAS-dependent CIN-associated genes (i.e. genes that scale significantly more strongly in high cGAS–STING expression settings) showing a statistical overrepresentation of inflammatory pathways.
Extended Data Figure 8.
Extended Data Figure 8.. Detection of cGAS+ micronuclei as a measure of ongoing cGAS-activating chromosomal instability in human EAC tumors.
(a) Representative high-resolution image of a human EAC tumor biopsy specimen stained with DAPI (DNA), anti-cGAS Ab and anti-pan-cytokeratin (pCK) Ab showing selective localization of cGAS at micronuclei. Scale bar corresponds to 10 μM. (b) Upper panel: Examples of manual and semi-automated tumoral cGAS+ MN detections. Lower panel: Scatter plot of manual cGAS+ MN quantifications (’ground truth’) versus quantifications obtained using a semi-automated detection approach across n=11 EAC tumor specimens, showing high concordance between methods. Detections were limited to the cancer cell compartment and were normalized to the total number of detected cancer cells to obtain cancer compartment-specific cGAS+ MN frequencies. The simple linear regression line, 95% confidence intervals and Pearson and Spearman correlation coefficients (Rp and Rs, respectively) and p-values are shown. (c) Upper panel: Example of semi-automated detections in the stromal versus cancer cell compartment of a primary EAC tumor. Left lower panel: Bar plots of semi-automated cGAS+ MN detections in cancer versus stromal compartments across n=45 patient tumors, showing a higher preponderance of micronuclei in malignant compartments. Right lower panel: Bar plots showing the fold-difference in cGAS+ MN detection frequencies in cancer compartments relative to corresponding stromal compartments. Bars represent the mean ± SEM for n=45 human EAC tumors. Data were analyzed by Wilcoxon matched-pairs signed-rank test, pairing malignant and stromal values from the same tumors. **** p ≤0.0001; *** p ≤0.001. (d) Barplot comparing inter- and intra-patient variances in tumoral cGAS+ MN frequencies, showing lower variance among samples derived from the same patient (e.g. patients with matched pre-treatment biopsies and post-treatment resections) compared to pre-treatment samples from different patients. Bars represent the mean ± SEM. (e) Scatter plots of the observed tumoral cGAS+ MN frequency versus whole-genome sequenced (WGS) - derived structural variant (SV) loads across n=12 primary EAC tumor specimens. The simple linear regression line, 95% confidence intervals and Pearson and Spearman correlation coefficients (Rp and Rs, respectively) and p-values are shown. Datapoints used as exemplars in (f) are highlighted with a red border. (f) Circos plots showing copy number alterations (CNAs) and SVs for representative EAC tumors exhibiting the highest and lowest measured cGAS+ MN frequencies across all sequenced tumors (CINhigh and CINlow, respectively). The outermost circle shows chromosomes, with darker shading representing gaps in the reference human genome (e.g. centromeres, heterochromatin and missing short arms). The second circle shows tumor purity-adjusted copy number (CN) changes, with gains shown in green and losses shown in red. Absolute copy numbers > 6 are shown with a green dot. The third shell represents minor allele CNs, with gains and losses shown in blue and orange, respectively. Minor allele CN > 3 are highlighted with a blue dot. The innermost circle displays intra- and inter-chromosomal SVs. SV categories are highlighted by color, as indicated.
Extended Data Figure 9.
Extended Data Figure 9.. Single-nucleus RNA sequencing of human EAC tumors.
(a) Experimental strategy used to shortlist samples for single-nucleus RNA-sequencing (snRNA-seq). Matched fresh frozen (FF) and formalin-fixed paraffin-embedded (FFPE) tissue specimens were obtained for tumors. FFPE tissues were stained with a multiplex immunofluorescence (mIF) panel using antibodies targeting cGAS and pan-cytokeratin (pCK), as well as DAPI (DNA) to evaluate the range of CIN across n=45 patient tumors. Tumors for snRNA-seq were shortlisted to span the observed spectrum of CIN across all queried tumors. SnRNA-seq was performed on matched FF tissue. (b) Multiplex immunofluorescence (mIF)-derived cGAS+ MN frequencies across n=45 patient tumors, including treatment-naïve staging laparoscopy biopsies and surgical resection specimens. (c) Sankey plot showing the contribution (number of cells) of each sample to identified cell compartments. Samples are ranked in descending order according to their mIF-inferred cGAS+ MN burden. (d) Heatmap showing the top 10 most significant highly expressed markers associated with each of the identified cell clusters. Color maps to the log2-transformed fold-change of a given marker in a cell cluster versus all other cell clusters. Select well-established EAC markers are indicated, showing high specific expression in the malignant compartment. (e) The top 20 most significantly enriched markers in each cluster, ranked from top to bottom by significance of enrichment. Unlike (c), shown markers are not limited to genes with abundant expression (i.e. minimum 1 count / cell). (f) Heatmap of the top 10 most significantly positively enriched pathways in each cluster, showing cluster specific pathway activities aligned with cluster identities. Pathway enrichment was performed using gene set enrichment analysis (GSEA) on ’FindAllMarkers’ differential expression analysis outputs for each cluster. Color maps to the –log10-transformed significance of GSEA enrichment (FDRq). Cluster-enriched pathways are ranked from left to right within each cluster by significance of enrichment. (g) Bar plots of the Pearson correlation coefficients (Rp) of the relative abundance of each cell compartment (the percentage of cells of a given identity relative to all cell detection within a sample) versus the tumoral cGAS+ MN burden across samples. P-values of Pearson correlation analyses are shown. (h) Volcano plot showing differential gene expression between malignant cells of CINhigh and CINlow snRNA-seq samples. Genes annotated with the ’Cytokine signaling’ gene ontology term (GO:0019221) are highlighted in orange. Genes with known IFN-α/β or IFN-γ (R-HSA-909733 or R-HSA-877300, respectively) pathway involvement are highlighted in red. Genes with reported cytokine activity (GO:0005125) are marked by a black central dot. Common tumor-expressed checkpoints (see Supplementary Table 1) are highlighted in teal. The dashed line indicates a Benjamini-Hochberg-adjusted p-value of 0.05. (i) Box plots of T cell exhaustion scores in lymphoid cells from CINhigh and CINlow snRNA-seq samples. T cell exhaustion scores were computed using the ‘AddModuleScore’ function of the Seurat package using a literature-curated T cell exhaustion signature (Supplementary Table 1). Boxes represent the median ± interquartile range and whiskers were plotted using Tukey’s method. Mean scores for each sample are plotted. Significance was determined by Mann-Whitney U test. **** p ≤0.0001; * p ≤0.05.
Extended Data Figure 10.
Extended Data Figure 10.. Imaging mass cytometry-based profiling of the chromosomally unstable EAC tumor immune landscape.
(a) Multiplexed imaging mass cytometry (IMC) workflow applied across n=16 pre-treatment human EAC tumors. (b) Schematic of the IMC antibody panels used for human EAC tumor microenvironment phenotyping, showing the targets used to differentiate malignant epithelial, immune (lymphoid and myeloid) and non-immune stromal (fibroblasts and endothelial cells) cells. (c) Representative images of various malignant, immune and non-immune stromal cell IMC markers in a pre-treatment human EAC tumor region. Scale bars correspond to 100 μM. (d) Left panel: Heatmap of median Z-scored (on a per sample basis) intensities of markers from the immune panel across identified immune cell subtypes. Right panel: Box plots of cell densities of identified immune cell subtypes across n=16 primary EAC biopsies. Boxes represent the median ± interquartile range, whiskers were plotted using Tukey’s method.
Extended Data Figure 11.
Extended Data Figure 11.. Multiplex immunofluorescence-based profiling of the chromosomally unstable EAC tumor immune landscape.
(a) Multiplex immunofluorescence workflow. (b) Image: Representative high-resolution image of a human EAC tumor biopsy specimen stained with DAPI (DNA), as well as anti-pan-cytokeratin (pCK), anti-CD11b, anti-CD68, anti-CD206, anti-CD3 and anti-CD11c antibodies (Abs; 7-plex staining), showing broadly stromal staining patterns for immune cell markers. Segmentation: Representative cell segmentations showing immune marker-positive cell detections after setting appropriate intensity thresholds. Scale bar corresponds to 150 μM. (c) Box plots showing the number of stromal compartment versus cancer compartment immune marker-positive cell detections (as a percentage of all cell detections in a tumor) across all analyzed biopsy and resection specimens, showing a predominance of immune marker-positive cells in stromal compartments. Boxes represent the median ± interquartile range. Box plot whiskers range from minimum to maximum. Data were analyzed by Wilcoxon matched-pairs signed-rank test, pairing malignant and stromal detections from the same tumors. (d) Coincidence heatmap of the degree of marker positivity co-occurrence across all detected cells in human EAC biopsy and resection specimens, showing a pronounced co-occurrence (e.g. CD68 and CD206) or mutual exclusivity (e.g. CD11b and CD3) between some immune markers. Color maps to the median marker positivity across all tumors. (e) Representative cell segmentations in an EAC biopsy tumor showing multi-marker cell detections indicative of inferred cell types. Scale bar corresponds to 150 μM. (f) Heatmap of median Z-scored (on a per sample basis) intensities of markers from the mIF immune panel across identified immune cell subtypes. (g) Scatter plot of the abundance of infiltrating neutrophils (Nϕ) in pre-treatment tumors versus concurrently collected blood-circulating neutrophil counts [Nϕ], showing a positive association. The heatmap shows spearman correlations coefficients (Rs) of associations between circulating neutrophil counts and all detected intratumoral cell types, showing an association specific to the Nϕ compartment. Heatmap color maps to Rs. Rs values of correlations are shown inside the boxes. Pairwise correlations with a p ≤0.05 are highlighted with a solid black border, whereas correlations with a p ≤0.10 are highlighted with a dashed black border. The linear regression line, 95% confidence interval, Rs and Spearman correlation p-value of the association between Nϕ abundance and circulating [Nϕ] are shown on the scatter plot. (h) Correlation heatmap showing high inter-correlations between immune cell type abundances inferred through imaging mass cytometry (IMC)-based immunophenotyping and through mIF across n=16 human EAC tumors analyzed using both methods. Color maps to the Pearson correlation coefficient (Rp). Significant associations in the abundance between cell types inferred through different methods are highlighted with a central black dot. Dot size maps to the magnitude of significance, as indicated. **** p ≤0.0001; * p ≤0.05.
Extended Data Figure 12.
Extended Data Figure 12.. Tumor cell-intrinsic and stromal CXCL8 mRNA expression in human EAC tumors.
(a) Workflow to quantify malignant and stromal compartment-specific in situ CXCL8 expression in human EAC tumors from CXCL8 RNAscope images. (b) Tumoral (cancer cell-intrinsic) versus stromal CXCL8 expression across n=29 EAC tumors. Bars represent the mean and lines between datapoints link tumor and stromal values for a given sample. Data were analyzed by Wilcoxon matched-pairs signed-rank test, pairing malignant and stromal CXCL8 expression from the same tumors. (c, d) Bar plots of Spearman correlations of the association between (c) Tumoral or (d) stromal CXCL8 expression and CIN (tumoral cGAS+ MN frequency) or intratumoral immune cell abundance. Color maps to Spearman correlation coefficient (Rs). The x-axis corresponds to the –log10-transformed Spearman correlation p-value. The dashed line corresponds to a p-value of 0.05. (e) CXCL8 mRNA expression level across peripheral blood mononuclear cell (PBMC)-derived immune cell subtypes in the Human Protein Atlas and the Monaco et al. datasets.
Extended Data Figure 13.
Extended Data Figure 13.. Chromosomal instability-driven cGAS–STING as a monocyte-attracting cue.
(a) Schematic illustrating the experimental strategy for monocyte migration assays. For EAC cells, Cas9 and cGASKO cells were exposed to 1 μM MPS1i (reversine) for 24h, followed by extensive wash-out to avoid drug carry-over. Cells were then allowed to condition media for 48h prior to conditioned media (CM) collection. For CP-A cells, cells were covered in fresh untreated media and left to condition media for 48h. CD14+ monocytes were positively selected from healthy donor blood-derived peripheral blood mononuclear cells (PBMCs). Migration assays were performed using transwell migration chambers, allowing monocytes to migrate towards CM for 24h before whole-well imaging based quantification. (b) Transwell assays were performed as described in (a). Data were normalized to the untreated Cas9 control. Data of n=3 independent experiments are shown. Significance was tested by one-way ANOVA with FDR-correction. (c, d) Transwell assays were performed as described in (a), using (c) SK-GT-4 cell conditioned media (CM) or (d) OE33 CM. Migration indexes were normalized to respective DMSO controls. Data of n=6 independent experiments are shown for experimental samples and n=3 for migration control samples. Monocytes were derived from n=2 independent healthy donors. Significance was tested by one-way ANOVA with FDR-correction.
Extended Data Figure 14.
Extended Data Figure 14.. EAC patient response-associated tumor immune features.
(a) Representative high-resolution images of matched human EAC tumor biopsy and resection specimens from neo-adjuvant treatment (NA Tx) responders and non-responders, stained with DAPI (DNA) and anti-pan-cytokeratin (pCK) Ab, showing poor histopathological response in the non-responder group. Tumor regression grade (TRG; also known as Mandard score) is indicated for each patient. Scale bar corresponds to 500 μM. (b) Bar plots showing the number of patients classed as NA Tx histopathological responders (R) or non-responders (NR) and proportion of tumors classed as TRG 1–5. (c) Kaplan–Meier plots of overall survival (left panel) and recurrence-free survival (right panel) of NA Tx responders and non-responders. The significance of the difference between patient survival was determined using the log-rank test. (d) Box plots of immune cell abundances (immune cell detections in the stromal compartment as a % of all cell detections in the tumor) for all queried immune cell types in biopsies of neoadjuvant treatment (NA Tx) responders versus non-responders. (e) Box plot showing the relative proportion between intratumoral macrophages (Mφ; CD68+) and T cells (CD3+; Δ[Mφ: T cell]), in biopsy tumors of NA Tx responders versus non-responders. (f, g) Box plots of (f) tumoral cGAS+ MN frequencies and (g) cGAS–STING pathway component expression in biopsy tumors of NA Tx responders versus non-responders. (dg) Boxes represent the median ± interquartile range. Box plot whiskers range from the 10th-90th percentile. Data were analyzed via unpaired two-tailed t-test. (h) Heatmap of Spearman correlations between cGAS+ MN frequency and immune cell abundances or cGAS–STING pathway component expression. The significance of the difference between cGAS+ MN-associated slopes in neo-adjuvant treatment (NA Tx) pathological responder versus non-responder patients was tested using a linear interaction model and is reported at the bottom of the heatmap. Color maps to the Spearman correlation coefficient of associations (Rs). P-values of correlations ≤0.10 are highlighted inside the boxes. Pairwise correlations with a p ≤0.05 are highlighted with a solid black border, whereas correlations with a p ≤0.10 are highlighted with a dashed black border. (i) Representative high-resolution images of CINhigh and CINlow human EAC tumor biopsies specimens for both pathological NA Tx responders and non-responders, stained with DAPI (DNA), as well as anti-pan-cytokeratin (pCK), anti-cGAS and anti-STING antibodies. Images show a loss of malignant cell STING signal in CINhigh non-responders, but not CINhigh responders. Scale bars correspond to 50 μM. (j) Example of a CINhigh myeloid-dominated NA Tx non-responder tumor and a CINhigh myeloid- and T cell-enriched responder tumor. (k) Distribution of EAC tumor biopsies quartilized by CIN and degree of myeloid-enrichment (i.e. the extent of macrophage:T cell skew) across NA Tx responders and non-responders. (l) Distribution of EAC tumor biopsies quartilized by tumoral STING level and degree of myeloid-enrichment across NA Tx responders and non-responders. **** p ≤0.0001, *** p ≤0.001, ** p ≤0.01, * p ≤0.05.
Figure 1.
Figure 1.. cGAS–STING functionality and CIN are prevalent features of EAC.
(a) Representative high-resolution image of a human EAC tumor biopsy specimen stained with DAPI (DNA), as well as anti-cGAS, anti-pan-cytokeratin (pCK) and anti-STING antibodies. Scale bar corresponds to 200 μM. (b) Quantification of (a). Box plots showing the average cancer compartment versus stromal compartment intensities for markers of interest across EAC biopsy specimens. Boxes represent the median of marker intensities ± interquartile range split by cell compartments of interest. Box plot whiskers range from minimum to maximum. Data were analyzed by Wilcoxon matched-pairs signed-rank test, pairing malignant and stromal detections from the same tumors. (c,d) Heatmap of log2-normalized fold-changes (FC) in relative mRNA abundance of the interferon-inducible genes IFIT2, CXCL10 and CCL5 upon (c) 2’3’-cGAMP transfection (2 μg/mL 2’3’-cGAMP + 2 μL/mL lipofectamine-2000, 6h) or (d) MPS1i treatment (0.5 μM reversine, 48h). Expression values were obtained through RT-qPCR. Fold-changes (FC) were derived using the 2−ΔΔCt method, normalizing expression values to 18S expression and respective control treatments. Control treatments: 2 μL/mL lipofectamine-2000 (6h; i.e. ’mock transfection’) for 2’3’-cGAMP treatments and DMSO (48h) for MPS1i treatments. Color-mapped values represent the average log2(FC) of n=3 independent experiments. Data were analyzed by two-sided paired t-test. Significance of overall treatment-induced IFN gene induction was determined via two-sided paired t-test, comparing the pooled condition-level averages of Z-normalized IFN gene expression values of treated versus control samples. Cell lines with significant (p ≤0.05, increased induction) overall treatment-induced IFN-inducible gene induction were considered ‘IFN inducers’. (e) Bar graph depicting the relationship between IFN gene induction capacity in response to 2’3’-cGAMP treatment and IFN induction following MPS1 inhibitor treatment in BE and EAC cell lines. Significant inducers of IFN-stimulated genes following treatment are denoted as (+), non-inducers as (-). Significance was tested by two-sided Chi-square (χ2) test. (f) Representative confocal microscopy images of BE and EAC cell lines under baseline conditions (DMSO-treated, 48h), showing examples of cGAS MN and cGAS+ MN. Cells were stained with anti-cGAS and Hoechst (DNA). Images represent maximum-intensity projections of Z-stacks, taken at 1 μm intervals. Scale bars correspond to 25 μm. (g) Quantification of cGAS and cGAS+ micronuclei in BE and EAC lines under baseline conditions. Bars represent the mean ± SEM of n=3, with ~≥100 cells counted per experiment. Data were analyzed by ANOVA with FDR-based correction. (h) Representative confocal microscopy image of baseline (DMSO-treated, 48h) SK-GT-4 cells, showing an example of a cGAS+ chromatin bridge. Cells were stained with anti-cGAS and Hoechst (DNA). The image represents a maximum-intensity projection of a Z-stack taken at 1 μm intervals. Scale bar corresponds to 20 μm. (i) Quantification of baseline cGAS+ chromatin bridge frequencies in EAC and BE cell lines. Bars represent the mean ± SEM of n=3, with ~≥100 cells counted per experiment. Data were analyzed by ANOVA with FDR-based correction. (j) Upper panel: Scatter plot of baseline extracellular 2’3’-cGAMP abundance (quantified by ELISA, normalized to cell number) versus baseline micronucleus frequency (quantified by IF) in select BE and EAC lines. Box plot lines represent the median and error bars represent the range (minimum to maximum) of n=5 independent cGAMP measurements. The bounds of box plots represent the interquartile range (Q1 to Q3). The position of box plots along the x-axis corresponds to the mean MN frequency for each cell line. Horizontal error bars represent ± SEM of n=3 independent IF-based MN estimates. Shown is the estimated simple linear regression line, 95% confidence intervals, Pearson correlation coefficient (Rp) and the p-value from a Pearson correlation analysis. The significance of differences in extracellular cGAMP concentrations between CP-A and EAC lines (OE33, SK-GT-4, FLO-1) was determined by unpaired two-tailed t-test. Lower panel: Heatmap of Pearson correlation coefficients of correlations between IF-derived CIN feature frequencies and extracellular (Extra.) or intracellular (Intra.) cGAMP abundance across profiled lines. This includes cGAS expression-normalized (normalized to log2-transformed relative mRNA abundance) extracellular cGAMP abundance, showing an association with CIN feature frequencies irrespective of differences in cGAS mRNA expression levels between lines. (k) Heatmap of Pearson correlation coefficients between CIN features (cGAS+ micronuclei/chromatin bridges and overall micronuclei burden) and baseline mRNA expression of cGAS and STING or treatment-induced (48h 0.5 μM MPS1i/reversine or 6h 2 μg/mL 2’3’-cGAMP transfection) IFN gene induction. Significance corresponds to Pearson correlation analysis p-values. (l) Scatter plot of baseline MN burden versus average log2-transformed IFN-stimulated gene fold-change (of IFIT2, CXCL10 and CCL5) upon 2’3’-cGAMP stimulation (6h, 2 μg/mL; versus mock transfection) across EAC and BE lines with meaningful cGAS and STING expression levels (i.e. cGAS–STING expressors). Shown are the estimated simple linear regression line, 95% confidence intervals, Pearson correlation coefficient (Rp) and the p-value from a Pearson correlation analysis. Horizontal and vertical error bars represent the ± SEM from n=3 independent IF and qPCR experiments, respectively. (m) Model of the relationship between cGAS–STING pathway function and inherent cellular CIN in esophageal cells. CINlow cells exhibit normal cGAS–STING pathway functionality and can drive potent type I IFN responses upon treatment-induced activation of the cGAS–STING pathway. CINhigh cells suffer from upstream cGAS–STING activation under baseline conditions owing to their high burden of cytosolic DNA. Repressive mechanisms are, thus, put in place to avoid engagement of the downstream antiproliferative type I IFN cascade. As a result, CINhigh cells are less poised towards IFN I engagement upon further exacerbation of cGAS–STING activation, owing to the pre-existing presence of downstream repressive mechanisms. **** p ≤0.0001; *** p ≤0.001; ** p ≤0.01; * p ≤0.05; ns, not significant.
Figure 2.
Figure 2.. CIN-driven cGAS–STING activation drives inflammatory gene expression in EAC cells.
(a) RNA-sequencing strategy to identify cGAS-dependent CIN (i.e. MPS1i)-induced genes in OE33 and SK-GT-4 cells. CGAS-proficient Cas9 cells and cGASKO cells were exposed to either DMSO or the MPS1 inhibitor reversine (0.5 μM) for 48h before sample collection. Genes that were significantly upregulated (adj. p ≤ 0.01) upon MPS1-inhibition in cGAS-proficient cells were considered MPS1i-induced. Genes that were significantly more strongly induced in Cas9 proficient over cGASKO cells were considered CIN-driven cGAS-dependent hits. Performing this analysis in two independent lines allowed for the identification of consensus hits between the two lines. (b) Venn diagram of identified CIN/MPS1i-upregulated (outer circle) and CIN-induced cGAS-dependent (inner circle) hits for OE33 and SK-GT-4 cells. The proportion of each subset of hits annotated with the ’Immune System Process’ gene ontology (GO) term (GO:Biological Process) has been indicated. (c, d) Heatmaps of log2-transformed fold-changes (log2[FC]; MPS1i vs DMSO, RNA-seq) of cGAS-dependent CIN-driven genes for (c) OE33 and (d) SK-GT-4 Cas9 and cGASKO cells across n=3 biological repeats. Genes belonging to the ’Immune System Process’ GO term have been highlighted in orange. Consensus cGAS-dependent CIN-driven hits annotated with ’Immune System Process’ are shown in black. Average cGAS expression levels (from RNA-seq) across DMSO- and MPS1i-treated samples are plotted at the bottom of heatmaps. Color maps to row-wise Z-scored log2(FC). (e) Venn diagram showing the overlap between all detected MPS1i-induced cGAS-dependent genes in OE33 cells and SK-GT-4 cells. All 18 consensus hits are shown and are annotated with associated biological functions. (f) Heatmap of overrepresentation analyses (using GO: Biological Process and Reactome gene set collections) of MPS1i-induced cGAS-dependent genes in OE33 cells and SK-GT-4 cells. The top 15 shared overrepresented pathways are shown and ranked from top to bottom by cumulative significance across the two lines. Pathways highlighted in orange relate to immune-promoting functions. (g) Heatmap of gene set enrichment analysis (GSEA) outputs showing MPS1i (reversine)-induced pathway changes in OE33 and SK-GT-4 Cas9 and cGASKO clones, with a focus on overall enrichment in pathways relating to the cell cycle, DNA damage response (DDR), inflammatory response or interferon signaling. Values within cells represent the significance of positive or negative enrichment (FDRq) for a given pathway group upon MPS1i treatment. Color maps to normalized enrichment score (NES). (h) Heatmap of log2-normalized fold-changes (FC) in relative mRNA abundance of the inflammatory (INF) targets IL6, CXCL8, CXCL1 and CXCL2 upon MPS1i treatment (0.5 μM reversine, 48h) versus DMSO treatment across BE and EAC cell lines. Expression values were determined by RT-qPCR. Fold-changes were derived using the 2−ΔΔCt method, normalizing expression values to 18S expression and DMSO control treatment gene expression. Color-mapped values represent the average log2(FC) of n=3 independent experiments. Data were analyzed by two-sided paired t-test. Significance of overall treatment-induced INF gene induction was determined via two-sided paired t-test, comparing the pooled condition-level averages of Z-normalized INF gene expression values of treated versus control samples. Cell lines with significant (p ≤0.05, increased induction) overall reversine-induced INF gene induction were considered ‘INF gene inducers’. (i) Scatter plots showing the relationship between baseline CIN feature (cGAS+ MN and chromatin bridges and all micronuclei) frequencies and IFN-inducible gene (‘IFN’; IFIT2, CXCL10, CCL5) or inflammatory target (‘INF’; IL6, CXCL8, CXCL1 and CXCL2) induction upon MPS1i treatment (0.5 μM reversine, 48h) across cGAS–STING expressing esophageal cell lines. The simple linear regression line, 95% confidence intervals, Pearson correlation coefficients (Rp), Pearson p-values and linear model interaction term p-values are shown. (j) GSEA enrichment plot showing enrichment of inflammatory pathway gene expression with increasing baseline cGAS+ MN rates across n=7 indicated EAC cell lines. **** p ≤0.0001; *** p ≤0.001; ** p ≤0.01; * p ≤0.05; ns, not significant.
Figure 3.
Figure 3.. Inflammatory pathway activity scales with inherent level of CIN in an isogenic Barrett’s esophagus cell line model.
(a) Schematic representation of the isogenic Barrett’s esophagus (BE) CIN line model, showing the genotypes of altered cell lines derived from the parental (dashed box) non-dysplastic BE founder cell line, CP-A. (b) Representative confocal microscopy images showing the baseline incidence of cGAS+ micronuclei across the cell line models. Images of p53KO, p53p16DKO, p53KOdnMCAK cells all correspond to cells derived from the same progenitor (clone 3). Cells were stained with anti-cGAS and Hoechst (DNA). The image represents a maximum-intensity projection of a Z-stack taken at 1 μm intervals. The scale bar corresponds to 25 μm. (c) Quantification of cGAS+ micronuclei in parental CP-A cells and derived altered (Cas9 control, p53KO, p53p16DKO, p53KOdnMCAK cell lines under baseline conditions. Bars for p53KO, p53p16DKO, p53KOdnMCAK genotypes represent the mean of n=3 independent clones ± SEM, where each point represents the mean ± SEM of n=3 independent experiments. Bars for parental and Cas9 cells represent the mean ± SEM of n=3 independent experiments. Datapoint shapes correspond to clone numbers for p53KO, p53p16DKO, p53KOdnMCAK lines. Circa ≥ 100 cells were counted per independent experiment. Data were analyzed by ANOVA with FDR-based correction. (d) Heatmap of single-cell whole-genome sequencing (scWGS) results. Each row represents a single cell of the indicated genotype. Cell numbers sequenced per genotype are displayed in the left-hand column. Columns represent autosomes 1–22 (left to right) and the X chromosome. Color maps to inferred ploidy at the indicated locus. (e) Bar plots of inferred aneuploidy scores from scWGS (relative to a euploid control), showing parental and Cas9 CP-A cells are near-euploid and altered clones (p53KO, p53p16DKO, p53KOdnMCAK) are predominantly near-tetraploid. (f) Scatter plots of genotype-level average cGAS+ MN burdens (at baseline) versus average scWGS-derived CIN metrics, including the inferred number of structural breakpoints per megabase (Mb; upper panel) and between-cell karyotype heterogeneity (lower panel). The estimated simple linear regression line, Pearson correlation coefficient (Rp), Spearman correlation coefficient (Rs) and the Pearson correlation analysis p-value are shown, showing a significant positive association between genotype-level cGAS+ MN burdens and scWGS inferred CIN metrics. Datapoint shapes for p53KO, p53p16DKO, p53KOdnMCAK correspond to clone number. Error bars along the x-axis correspond to ± SEM of genotype-pooled average cGAS+ MN burdens. Error bars along the y-axis correspond to ± SEM of genotype-pooled average scWGS-derived CIN metrics. (g) Experimental strategy for the detection of CIN-associated genes from RNA-sequencing data. A linear mixed-effects model was used iteratively to assess the relationship between observed baseline cGAS+ MN frequencies (by immunofluorescence) and the expression level of every gene detected by RNA-sequencing, whilst accounting for confounding variables (random effects), such as the clone number and batch in which samples were collected. This allowed an evaluation of which genes and biological pathways are most strongly upregulated in cells with high baseline micronucleus frequencies. (h) Volcano plot of linear mixed-effects model outputs assessing the linear relationship between inherent cGAS+ MN burden and expression level of a gene in the CP-A cell line model. ANOVA p-value (y-axis) indicates the statistical significance of the association between expression and cGAS+ MN burden. Slope (x-axis) indicates the magnitude change in gene expression per unit increase in cGAS+ MN burden. Genes annotated with the ’Cytokine signaling’ gene ontology term (GO:0019221) are highlighted in orange. Genes with known IFN-α/β or IFN-γ pathway (R-HSA-909733 or R-HSA-877300, respectively) involvement are highlighted in red. Genes with reported cytokine activity (GO:0005125) are marked by a border. Top ranking genes with immune pathway involvement are labelled. Dot size in immune pathway genes maps to the (log10-transformed) mRNA abundance in the RNA-seq experiment across all samples. The top 70 most significantly positively associated genes were used to derive an esophageal cell-specific transcriptional signature of CIN, termed CINMN, used in downstream analyses. (i) Volcano plot of gene set enrichment analysis (GSEA) outputs showing pathways most strongly associated with cGAS+ MN burden in CP-A cells. Select pathways have been categorized based on their broad biological function into one of four major pathway groups: cell cycle-related pathways, DNA damage response (DDR)-related pathway, inflammatory response pathways (INF) and interferon response pathways (IFN). The p53 pathway (from the MsigDB Hallmarks collection) has been highlighted given its strong negative association with inherent cGAS+ MN burden. The heatmap in the top right corner shows the degree of enrichment of broad pathway groups across all enriched pathways. **** p ≤0.0001; *** p ≤0.001; ** p ≤0.01; * p ≤0.05; ns, not significant.
Figure 4.
Figure 4.. Micronucleus burden scales with innate immune activity in human EAC tumors.
(a) Representative high-resolution images of human EAC tumor specimens stained with DAPI (DNA), anti-cGAS Ab and anti-pCK Ab showing a high frequency of cGAS+ MN in a snRNA-seq-shortlisted tumor from the upper tertile of the cGAS+ MN range of n=45 scored primary EAC tumors and a low frequency in a shortlisted tumor from the bottom tertile. Scale bar corresponds to 50 μM. (b) Tumoral cGAS+ MN (cancer cell compartment-specific) frequencies for n=9 tumors shortlisted for snRNA-seq, showing a clear separation between CINhigh tumors and CINlow tumors. Bars represent the mean ± SEM. Data were analyzed by two-tailed unpaired t-test. (c) Uniform manifold approximation and projection (UMAP) dimensionality reduction (using Harmony embeddings to remove batch effects) of all cells remaining after quality control (QC) and filtering, colored by high-level manually curated cell identity. (d) Beeswarm plot of Milo analysis outputs for non-malignant cell clusters. Dot size corresponds to neighborhood size. Directionality and weighted mean indicate the CIN category (CINhigh or CINlow) in which there is a greater relative abundance of the indicated cell type. Weighted means for each cell cluster are shown. The x-axis represents log2(fold-change) in relative cell abundance. (e) Hit selection strategy for identifying genes most strongly associated with tumoral cGAS+ MN frequencies in each cell compartment. Single-cell expression matrices were pseudobulked for each cell type on a patient sample level, yielding a single gene expression value for each gene in every sample’s cell compartment. Resulting pseudobulked expression values for each gene were then iteratively correlated with cGAS+ MN frequencies across patient samples, yielding Pearson correlation coefficients (Rp) and p-values for each gene in each cell compartment. (f) Heatmap of gene set enrichment analyses (GSEA) querying the degree of CIN signature (CINMN and CIN70 signatures) enrichment in ranked lists of cGAS+ MN-correlated genes in each cell compartment showing selective enrichment of CIN signatures among cGAS+ MN-associated genes in the malignant compartment. Color maps to normalized enrichment score (NES). Cell border indicates a significance of enrichment (FDRq) ≤ 0.05. (g) Volcano plot showing Pearson correlation coefficients (x-axis) and p-values (y-axis) of the association between a malignant compartment pseudobulked expression and tumoral cGAS+ MN frequency, showing a strong association between immune target expression in the malignant compartment and CIN. Genes annotated with the ’Cytokine signaling’ gene ontology term (GO:0019221) are highlighted in orange. Genes with known IFN-α/β or IFN-γ (R-HSA-909733 or R-HSA-877300) pathway involvement are highlighted in red. Genes with reported cytokine activity (GO:0005125) are marked by a black central dot. (h) Volcano plot of gene set enrichment analysis (GSEA) outputs, showing the relationship between pathway enrichment and tumoral cGAS+ MN burden (CIN). Select pathways have been categorized based on their broad biological function into one of four major pathway groups: cell cycle-related pathways, DNA damage response (DDR)-related pathways, inflammatory response pathways (INF) or interferon response pathways (IFN). The p53 pathway (from the MSigDB Hallmarks collection) has been highlighted given its strong negative association with tumoral cGAS+ MN burden. The heatmap at the bottom shows the degree of enrichment of broad pathway groups with CIN within the overall distribution of all pathways. **** p ≤0.0001; ** p ≤0.01.
Figure 5.
Figure 5.. CIN is associated with intratumor myeloid cell inflammation in human EAC tumors.
(a) EAC tumor microenvironment profiling workflow. Intratumoral immune composition and abundance were queried through multiplex immunofluorescence (mIF) and imaging mass cytometry (IMC). The extent of CIN was evaluated through mIF-based cGAS+ MN detection. In situ tumor cell-intrinsic CXCL8 mRNA expression was measured using RNAscope. (b, c) Volcano plot showing immune cell subtypes whose intratumoral density is associated with the extent of tumoral CIN (cGAS+ MN frequency) (b) across n=16 human EAC biopsies queried by multiplexed imaging mass cytometry (IMC) or (c) n=38 pre- and pos-treatment EAC tumors stained via multiplex immunofluorescence (mIF). Immune cell subtypes whose density correlates significantly (Pearson correlation) with cGAS+ MN frequency are highlighted with a thick border, as indicated. The x-axis represents the –log10-transformed Pearson correlation p-value. The y-axis maps to the slope of the association between CIN and intratumoral cell abundance. Dot size maps to the mean cell density or abundance of a given immune cell type across all samples. Dot color maps to Pearson correlation coefficient for (b) and Spearman correlation coefficient for (c). (d) Representative high-resolution images of CINhigh and CINlow (based on observed cGAS+ MN frequencies) human EAC tumor biopsy specimens stained with DAPI (DNA), as well as anti-pan-cytokeratin (pCK), anti-CD11b, anti-CD68, anti-CD206, anti-CD3 and anti-CD11c antibodies, showing broadly increased myeloid cell marker (CD68, CD206, CD11c, CD11b) predominance in the CINhigh tumor. Scale bars correspond to 100 μm. (e) Left panel: Representative high-resolution image of a human EAC tumor core stained with DAPI (DNA), as well as anti-pan-cytokeratin (pCK) and anti-cGAS antibodies. The spatial positions of cGAS+ MN detections are highlighted. Scale bar corresponds to 250 μm. Right panel: Heatmap of quantilized cGAS+ MN Kernel densities across the tumor area. (f) Left panel: Representative high-resolution image of a human EAC tumor core sample, directly adjacent (4 μm sections) to section in (d), stained with a multiplex immune antibody panel. Scale bar corresponds to 250 μm. Right panel: Spatial positions of classified cell centroids. (g) Fold-enrichment of the relative abundance of immune cell types in cGAS+ MN-dense areas (≥90th percentile: ‘CIN hotspot’) of the tumor versus the remainder of the tumor (<90th percentile) across n=35 EAC tumors. Bars are shown as the median with 95% confidence interval. A one-sample t-test was used to compare immune cell fold-enrichment in CIN hotspots across tumors to 1. (h) Line plot of median fold-enrichment of immune cell types in CIN hotspots across increasing hotspot percentiles, showing a progressively higher relative abundance of Mφs and M2-like Mφs and lower T cell and DC abundance in increasingly cGAS+ MN dense regions. Heatmap indicates significance of enrichment by one-sample t-test at each CIN density threshold. (i) Representative high-resolution immunofluorescence images of CXCL8 RNAscope in CINhigh and CINlow EAC tumors. (j) Tumor-cell intrinsic CXCL8 mRNA expression levels in CINhigh versus CINlow EAC tumors. Bars represent the mean ± SEM from n=29 EAC tumors. Significance was determined by Mann-Whitney U test. ** p ≤0.01, * p ≤0.05.
Figure 6.
Figure 6.. Chromosomally unstable, myeloid-dominated EAC tumors are associated with poor patient prognosis.
(a) Forest plots of Cox proportional hazards models, showing the hazard ratio of high expression (determined using the maximal statistic approach) for indicated signatures in three independent EAC RNA-seq cohorts. Significance was determined using the log-rank test. (b) Kaplan–Meier curves showing the overall survival probability of human EAC patients partitioned according to CINMN score (median stratification) and subsequent partitioning (median) of CINhigh and CINlow groups based on the degree of myeloid cell enrichment. Myeloid cell enrichment was determined by computing the extent of myeloid to lymphoid cell skew (My:Ly) for each patient using snRNA-seq-derived immune cell type signatures. Significance was determined through pairwise comparisons between the CINhigh, myeloid-dominated group and other groups using the log-rank test. (c) Heatmaps showing the median expression for indicated signatures among patient clusters of interest. Asterisks denote the significance, determined through ANOVA with Tukey’s HSD, of the difference between the CINhigh myeloid-dominated cluster and other clusters (denoted by asterisk color). **** p ≤0.0001, *** p ≤0.001, ** p ≤0.01, * p ≤0.05. (d) Hypothetical model through which CIN drives cGAS–STING-dependent and -independent intratumor myeloid cell inflammation.

References

    1. Shah M. A. et al. Improving outcomes in patients with oesophageal cancer. Nat Rev Clin Oncol 20, 390–407 (2023). - PubMed
    1. Network, T. C. G. A. R. et al. Integrated genomic characterization of oesophageal carcinoma. Nature 541, 169 (2017). - PMC - PubMed
    1. Killcoyne S. et al. Genomic copy number predicts esophageal cancer years before transformation. Nat Med 26, 1726–1732 (2020). - PMC - PubMed
    1. Paulson T. G. et al. Somatic whole genome dynamics of precancer in Barrett’s esophagus reveals features associated with disease progression. Nat Commun 13, 2300 (2022). - PMC - PubMed
    1. Katz-Summercorn A. C. et al. Multi-omic cross-sectional cohort study of pre-malignant Barrett’s esophagus reveals early structural variation and retrotransposon activity. Nat Commun 13, 1407 (2022). - PMC - PubMed

Publication types