[Preprint]. 2025 May 7:2025.05.01.651328.
doi: 10.1101/2025.05.01.651328.

Data-driven feedback augments ultrasound nanotheranostics in brain tumors

Affiliations

Data-driven feedback augments ultrasound nanotheranostics in brain tumors

Hohyun Lee et al. bioRxiv. .

Abstract

The blood-brain barrier (BBB) renders the delivery of nanomedicine in the brain ineffective and the detection of circulating disease-related DNA from the brain unreliable. Here, we show that the acoustic emission content of focused ultrasound-controlled microbubble dynamics (MB-FUS) incorporates precursor signals that allow large-data models to predict sonication regimens for safe and effective BBB opening. Crucially, closed-loop MB-FUS controller augmented by machine learning (ML-CL) expands the treatment window (4-fold), as compared to conventional controllers, by persistently and proactively maximizing the BBB permeability while preventing tissue damage. By successfully scaling up from mice to rats and from healthy to diseased brains (glioma), ML-CL rendered the BBB permeable to large nanoparticles and markedly improved the release and detection of tumor DNA in plasma. Together, our findings reveal the potential of data-driven feedback to support the development of next-generation AI-powered ultrasound systems for safe, robust, and efficient nanotheranostic targeting of brain diseases.


Conflict of interest statement

Competing interests: The authors declare no competing interests. CB is a consultant for Haystack Oncology, Bionaut Labs, Privo Technology. CB is a co-founder of OrisDx and Belay Diagnostics

Figures
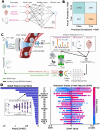
Figure 1.
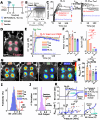
Figure 1.. Multilayer perceptron model training, interpretation, and its integration with the controller.
A) Schematic of simple proof-of-concept MLP model with one hidden layer with 10 neurons. Input features are described in Table 1. B) Confusion matrix for MLP model training (80% of ground truth label and matched number of ground false label); Numbers in the matrix indicate the number of data points with the top left, top right, bottom left, and bottom right being true negative, false positive, false negative, and true positive, respectively. C) Schematic of ML-assisted closed-loop MB-FUS controller. MLP model’s output is used as an additional safety layer (advisory loop) to override closed-loop controller’s decisions upon positive prediction. This flexible design allows its universal compatibility with various control algorithms. D) SHAP value analysis onto MLP model. All training datasets were used for analysis without random sampling. Left shows global importance calculated from the absolute value of SHAP values. Partial SHAP analysis of single feature, pressure, shows weakly positive correlation between pressure and SHAP, but with high variance, which indicates the effect of pressure onto model is not monotonic. For the right (SHAP analysis), being closer to red indicates higher values of each feature. SHAP value (x-axis) represents the contribution of each feature’s value onto the output of the model (positive SHAP value indicates the tendency of positive broadband prediction by the model).
Figure 2.
Figure 2.. Performance assessment of ML-CL under limiting conditions.
A) General MB-FUS experiment procedure for all controllers. B) Cavitation threshold model from the training dataset. 7th harmonic AE as a function of pressure. To assess the controllers’ performance at their limits, we selected a target level above the model (36 dB). C) ML-CL pressure decisions for 36 dB target level (left). The average and maximum pressures used by ML-CL were used to determine PMax and PAvg for OL controllers (right). A decrease in pressure in OL indicates a reaction to broadband emission events (> 6 dB). D) Representative MRI image for 36 dB target level sonication targets. 2 targets in each brain hemisphere (total 4 targets per mouse) were treated. E) 7th harmonic emissions during sonication for each controller. PAvg : 36.2 ± 3.3 dB, PMax 37.9 ± 2.4 dB, CL : 35.1 ± 0.7 dB, ML-CL : 34.7 ± 0.7 dB. n = 8 targets (total 2 animals) per group. F) Mean (left) and standard deviation (right) of 7th harmonic emission during sonication by ML-CL. A variance test (f-test) was performed to compare standard deviation (right) of the mean 7th harmonic emission at each target. G) MRI T1 images using the controller at 36 dB or equivalent OL pressure. H) Quantification of Ktrans values through DCE-MRI. I) Histogram for broadband emission levels during sonication. Broadband emissions higher than 6 dB were considered a broadband emission event, whose probability for each controller is highlighted next to the dotted line. Percentages indicate 11, 46, 14, and 1 instances of broadband emission event out of 1,048 total sonications for PAvg, PMax, CL, and ML-CL, respectively. J) Histogram for MLP decision during ML-CL sonication. A model output of 0.5 or greater was considered a positive prediction. For this target level (36 dB), the model predicted 4.4% (46/1040) of sonication. K) Treatment window analysis for reactive (OL, CL) and predictive (ML-CL) controllers. Bottom left: mean pressure vs. Ktrans at each target. Black indicates OL and CL, blue indicates ML-CL, and red indicates where broadband emissions were present. Top: pressure vs. broadband level throughout all sonication AE datasets. A more detailed figure with individual data points is shown in Fig. S8. ML-CL treatment window: 0.09 MPa (0.17 to 0.26 MPa). This was approximately a 300% increase (green area) from OL and CL’s treatment window: 0.02 MPa (0.17 to 0.19 MPa). Upper bounds for treatment windows were selected according to the inflection point of the hyper tangent curve fit, which indicates an increased likelihood of broadband emission. †The pressures (x-axis) used for the top left plot are the mean pressure at each targe brain location, and the pressure (x-axis) used for the bottom left plot is real-time pressure at each sonication similar to B (see Fig. S8). Also, for this figure, sonication data (Ktrans and AE) from later parts of the study were included, which adds 1 additional broadband emission event for ML-CL. Bottom right: the probability of having broadband emission event vs. Ktrans. ML-CL improved Ktrans given the same probability of broadband emission probability as evidenced by a shift in the curve by 188% (green area under hyper-tangent curve, the inflection point of 0.0173 to 0.0499). ns = not significant, *p<0.05, **p<0.01, ***p<0.001, and ****p<0.0001. Statistical analyses were performed through One-way ANOVA and Bonferroni correction. For the variance test, f-test was used with Bonferroni correction.
Figure 3.
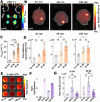
Figure 3.. ML-CL can enhance safety without compromising BBB opening efficiency.
A) H&E staining at each target referenced in photos of brain slices in the middle. B) Representative immunofluorescence images of GFAP and Iba-1. C) Quantification of GFAP and Iba-1 intensity comparing contralateral region and sonicated region. GFAP expression showed a significant increase (*p<0.05) in PAvg group but not in ML-CL. No differences in Iba-1 were observed. Paired t-tests were used for statistical analysis. ns = not significant, *p<0.05.
Figure 4.
Figure 4.. By expanding the treatment window ML-CL can safely enhance delivery of PEGylated polystyrene nanoparticles with broad size distribution in healthy brain.
A) Representative T1-MRI image after ML-CL sonication. Left brain hemisphere was treated with 32 dB, and right brain was treated with 36 dB ML-CL. n = 2 animals (total 4 targets) per group. B) Representative IVIS imaging showing delivery of each size NPs at ML-CL targets. Color range is formulated in logarithmic scale. C) Quantification of Ktrans for each target level. Both 32 and 36 dB target levels resulted in significantly higher Ktrans compared to unsonicated region (p<0.0001). 36 dB group had higher Ktrans compared to 32 dB group (p<0.001). Statistical analysis was performed through one-way ANOVA with Bonferroni correction. D) Quantification of IVIS fluorescence for each size NPs. 36 dB group increased 37, 46, and 120 nm NP delivery by 2.8, 2.1, and 2.1-fold, respectively (*p<0.05). Statistical analysis was performed using one-way ANOVA with Bonferroni’s correction. E) Representative image of in vitro IVIS setup with the different NPs (injection concentration) on a well plate (see Methods for details). F) We used the normalized in vitro radiance from each NPs to account for differences in their in vivo fluorescence. G) Normalized quantification of D using in vitro fluorescence ratio. ns = not significant, *p<0.05, **p<0.01, ***p<0.001, and ****p<0.0001. Statistical analyses were performed through One-way ANOVA and Bonferroni correction.
Figure 5.
Figure 5.. ML-CL augments the release of brain cancer-soluble biomarkers.
A) Experimental procedure indicating the time points for treatment and blood collection. The control group was injected with MB only as treatment. B) Representative T2-MRI images for tumor, GL-261-GLuc. C) Tumor size distribution across groups. All groups had no significantly different tumor size distribution. (n = 4, control, n = 4, 32 dB, n = 6, 36 dB, respectively). D) Transient 7th harmonic emission of 32dB (light green) and 36 dB (green) ML-CL during its application on GL-261-GLuc tumor-bearing mice. E) Distribution of 7th harmonic emission for ML-CL at 32 dB and 36 dB target levels. 7th harmonic level distribution was compared with t-test. (32 dB – 30.96 ± 3.13 dB; 36dB – 34.57 ± 3.73 dB). F) Histogram of broadband emission during sonication. 32 dB ML-CL had 0.04% (1/2620), and 36 dB had 0.17% (8/4585) of sonication that contained broadband events. G) ML model output during sonication. The model predicted broadband emission at 1.8% (48/2620) and 15.8% (722/4585) of 32dB and 36 dB ML-CL sonication, respectively. H) ML-CL target locations. I) Representative MRI-T1 images and J) quantification of Ktrans. K) GLuc protein luminescence quantification. Mean relative change – Control group: no difference (ns), 32dB: 2.2-fold (ns), 36 dB: 3.1-fold (p<0.05). L) GLuc gene quantification. Mean relative change – Control group: no difference (ns), 32dB: 1.5-fold (ns), 36 dB: 7.8-fold (ns). ns = not significant, *p<0.05, **p<0.01, ***p<0.001, ****p<0.0001. All statistical analyses were performed using One-way ANOVA with Bonferroni correction. Specific samples were excluded, check methods for exclusion criteria.
Figure 6.
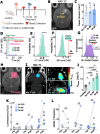
Figure 6.. ML-CL augments delivery of PEGylated polystyrene nanoparticles in F98 tumor-bearing rats.
A) Experimental procedure indicating the time points for treatment, NP administration, and IVIS analysis. The control group (no FUS) was injected with MB only as treatment. B) Representative MRI-T2 image for F98 tumor and sonication target locations. C) Tumor size distribution across groups. All groups had no significantly different tumor size distribution. (n = 5, control, n = 5, PAvg, n = 5, ML-CL 33.5 dB, respectively) D) Transient 7th harmonic levels during treatment (Blue: ML-CL 33.5 dB; Orange: PAvg 0.29MPa). Note that the curve is average of all targets, where MB arrival time and rise time can be different, that led to lower averaged harmonic level. E) Histogram of 7th harmonic levels for PAvg (Orange) and ML-CL 33.5 dB (Blue). 7th harmonic levels during 20 seconds following MB arrival were considered for all sonication. 30.8 ± 4.0 dB for ML-CL; 24.7 ± 10.9 dB for PAvg. Levene’s test was used for variance comparison and t-test for mean comparison. Sk = skewness. F) Histogram of broadband emission during sonication. PAvg (Orange) had 0.76% (35/4585), and ML-CL (Blue) had 0.24% (11/4585) of sonication that contained broadband events. G) ML model output during sonication. The model predicted broadband emission at 10.03% (460/4585) of ML-CL sonication. H) Representative MRI-T1 images and I) quantification of Ktrans. J) Representative IVIS image of NP delivery in F98 tumor-bearing rats. Left: Control (no FUS); Middle: PAvg (0.29 MPa); Right: ML-CL (33.5 dB target level). K) Quantification of NP delivery. ML-CL improved NP delivery by 7.2-fold (p<0.001) compared to control group and 2.8 -fold (p<0.01) compared to PAvg group. ns = not significant, *p<0.05, **p<0.01, ***p<0.001, ****p<0.0001. All statistical analyses were performed with One-way ANOVA with Bonferroni correction.
Figure 7.
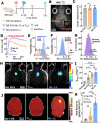
Figure 7.. ML-CL augments release of protein and ctDNA from F98-GLuc tumor-bearing rats.
A) Experimental procedure indicating the time points for treatment and blood collection. The control group (no FUS) was injected with MB only as treatment. B) Representative MRI-T2 image for F98-GLuc tumor and sonication target locations. C) Tumor size distribution across groups. All groups had no significantly different tumor size distribution. (n = 6, control, n = 6, PAvg, n = 8, ML-CL 33.5 dB, respectively) D) Transient 7th harmonic levels during treatment (Blue: ML-CL 33.5 dB; Orange: PAvg 0.30 MPa). Note that the curve is average of all targets, where MB arrival time and rise time can be different, that led to averaged down harmonic level. E) Histogram of 7th harmonic levels for PAvg (Orange) and ML-CL 33.5 dB (Blue). 7th harmonic levels during 20 seconds following MB arrival were considered for all sonication. ML-CL: 28.2 ± 5.6 dB and PAvg: 26.8 ± 6.6 dB. Levene’s test was used for variance comparison and t-test for mean comparison. Sk = skewness. F) Histogram of broadband emission during sonication. PAvg (Orange) had 0.44% (24/5502), and ML-CL (Blue) had 0.98% (72/7336) of sonication that contained broadband events. G) ML model output during sonication. The model predicted broadband emission at 8.52% (460/7336) of ML-CL sonication. H) Representative MRI-T1 images and I) quantification of Ktrans. J) GLuc protein luminescence quantification. Mean relative change – Control group: 1.1-fold (ns), PAvg: 1.4-fold (ns), 36 dB: 1.5-fold (p<0.05). Left: Control (no FUS); Middle: PAvg (0.30 MPa); Right: ML-CL (33.5 dB target level). K) GLuc ctDNA quantification. Mean relative change – Control group: no difference (ns), PAvg: no difference (ns), 36 dB: 2.1-fold (p<0.01). ns = not significant, *p<0.05, **p<0.01, ***p<0.001, ****p<0.0001. All statistical analyses were performed with One-way ANOVA with Bonferroni correction. Specific samples were excluded, check methods for exclusion criteria.

References

    1. Vanlandewijck M. et al. A molecular atlas of cell types and zonation in the brain vasculature. Nature 554, 475–480 (2018). - PubMed
    1. Wälchli T. et al. Shaping the brain vasculature in development and disease in the single-cell era. Nat Rev Neurosci 1–28 (2023) doi: 10.1038/s41583-023-00684-y. - DOI - PMC - PubMed
    1. Iliff J. J. et al. A Paravascular Pathway Facilitates CSF Flow Through the Brain Parenchyma and the Clearance of Interstitial Solutes, Including Amyloid β. Science Translational Medicine 4, 147ra111–147ra111 (2012). - PMC - PubMed
    1. Iadecola C. The Neurovascular Unit Coming of Age: A Journey through Neurovascular Coupling in Health and Disease. Neuron 96, 17–42 (2017). - PMC - PubMed
    1. Wu D. et al. The blood–brain barrier: Structure, regulation and drug delivery. Sig Transduct Target Ther 8, 1–27 (2023). - PMC - PubMed

Publication types

LinkOut - more resources