[Preprint]. 2025 May 5:2024.08.03.606469.
doi: 10.1101/2024.08.03.606469.

Generating Synthetic Task-based Brain Fingerprints for Population Neuroscience Using Deep Learning

Affiliations

Generating Synthetic Task-based Brain Fingerprints for Population Neuroscience Using Deep Learning

Emin Serin et al. bioRxiv. .

Abstract

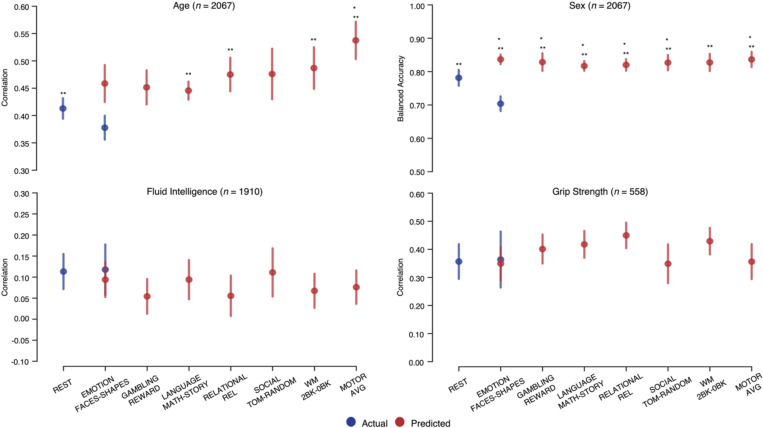
Task-based functional magnetic resonance imaging (tb-fMRI) reveals individual differences in the neural basis of cognitive functions by linking specific tasks to neural responses. However, scaling tb-fMRI to population-level studies is challenging due to its cognitive demands, variations in task design across studies, and the limited scope of tasks in large datasets. To address this, we propose DeepTaskGen, a deep-learning approach that generates non-acquired task-based contrast maps from resting-state fMRI (rs-fMRI) data. Our approach enables generating synthetic task images for non-acquired tasks within the study protocol. We validate this approach using the Human Connectome Project lifespan data, then generate 47 contrast maps from 7 different cognitive tasks for over 20,000 individuals from UK Biobank. DeepTaskGen outperforms several benchmarks in generating synthetic task-contrast maps, exhibiting superior reconstruction performance while retaining inter-individual variation essential for biomarker development. Notably, we further showed that synthetic task contrast maps achieved similar or greater performance compared to actual task contrast maps and resting-state connectomes for predicting a wide range of demographic, cognitive, and clinical variables. This approach will facilitate the study of individual differences and the generation of task-related biomarkers by enabling the generation of arbitrary functional cognitive tasks from readily available rs-fMRI data.


Figures

Fig. 1:
Fig. 1:. Input, DeepTaskGen architecture, and model evaluation on training and independent samples.
a. We utilized voxel-to-ROI rs-fMRI connectomes as input. A connectome was constructed for each subject by calculating the full correlation between the averaged time series from 50 ICA-based ROIs and the time series of individual voxels. b. Task-contrast maps for various tasks were predicted from rs-fMRI connectomes using our proposed DeepTaskGen architecture. DeepTaskGen is a volumetric U-Net model with attention mechanism that processes the input resting-state connectome through a series of convolutional blocks, each comprising a 3D convolution layer, batch normalization, and a non-linear activation function. By utilizing max pooling, the model compresses images while preserving task-relevant patterns, and then, it up-samples the images to align with the output task contrast maps. The numbers below each block represent the output shape of each block and the number of feature maps (above). The details of the architecture are presented in Supplementary Table 1. c. We trained and evaluated DeepTaskGen on the HCP Young Adult dataset. The figure above shows the reconstruction performance computed by taking Pearson’s correlation between predicted and actual contrast maps for representative contrasts from seven distinct tasks. The figure below displays the diagonality index (the difference between the on-diagonal and the mean off-diagonal elements in a correlation matrix, normalized by the mean on-diagonal values), evaluating models’ discriminability performance. We compared DeepTaskGen with methods like group-averaged contrast maps, retest scans, and a linear model (each depicted in distinct colors). d. We further fine-tuned the trained DeepTaskGen model on the HCP Development dataset using either task contrasts (e.g., GAMBLING REWARD). We predicted the other contrast (e.g., EMOTION FACES-SHAPES). The fine-tuned model was compared to the non-fine-tuned DeepTaskGen and linear models (shown in distinct colors). Reconstruction performance and discriminability were again used to assess the models’ performance for each task contrast.
Fig. 2:
Fig. 2:. Visualization of group-level contrast maps and similarity (or dissimilarity) among subjects.
a. Group-level contrast maps for seven representative tasks were generated for predicted maps on three datasets (HCP Young Adult, HCP Development, and UK Biobank) and compared to actual task contrast maps from HCP-YA. Activations and deactivations are displayed using scaled z-scores, with colors indicating the magnitude of the effect (shown in the color gradient bar). b. To visualize within- and between-task variance among subjects, we employed Uniform Manifold Approximation and Projection (UMAP), a non-linear dimensionality reduction technique. UMAP projects high-dimensional task contrast maps into two dimensions for clear visualization, allowing us to assess if the projected datasets contain individual- and task-specific information necessary for downstream analyses. Each dot represents a subject’s task contrast map for the seven tasks, colored accordingly. Similar subjects are positioned closer together, indicating similarity, while distant dots represent dissimilarity. Accordingly, wider spread within tasks and greater distance between tasks represent higher within- and between-task variability. Note that we fitted a separate UMAP model to each dataset, as indicated in each column and row.
Fig. 3:
Fig. 3:. Prediction of subjects’ age, sex, fluid intelligence, and dominant hand grip strength using task contrast maps and resting-state connectome on UK Biobank.
We predicted subjects’ demographic and cognitive measures in the UK Biobank dataset using three modalities: resting-state connectome, actual contrast map from the EMOTION task, and seven synthetic task contrast maps. All predictions were made using L2 regularized regression (i.e., ridge regression) within a 5-fold cross-validation framework with permutation testing (P = 1000). Blue represents resting-state connectome and actual task contrast maps, while red represents predicted task contrast maps. Note that only the EMOTION task has both actual and predicted contrast maps on UKB, indicated in blue and red, while the remaining six tasks are indicated in red as UKB does not provide them. Significant predictions based on permutation testing are highlighted. Error bars indicate the standard deviation of prediction performance across five CV folds. Balanced accuracy was used for sex classification, while Pearson’s correlation assessed the other variables. Sample sizes for all analyses are indicated in each figure. An asterisk (*) indicates a significant difference in prediction performance between annotated maps and resting-state connectome data, while two asterisks (**) represent a significant difference between the annotated maps and actual task-contrast maps. Detailed test statistics are provided in Supplementary Tables 12, 14-17.
Fig. 4:
Fig. 4:. Prediction of subjects’ clinical measures using task contrast maps and resting-state connectome on UK Biobank.
We predicted subjects’ clinical measures in the UK Biobank dataset using three modalities: synthetic task contrast maps, actual task contrast maps, and resting-state connectome data. resting-state connectome, actual contrast map from the EMOTION task, and seven synthetic task contrast maps. All predictions were made using L2 regularized regression (i.e., ridge regression) within a 5-fold cross-validation framework. Permutation testing (P = 1000) was used to assess the significance of out-of-sample performance against a null distribution. Actual and synthetic brain measures are depicted in blue and red colors, respectively. Note that only the EMOTION task has both actual and predicted contrast maps on UKB, indicated in blue and red, while the remaining six tasks are indicated in red as UKB does not provide them. Significant predictions based on permutation testing are highlighted. Error bars indicate the standard deviation of prediction performance across five CV folds. Balanced accuracy was used to measure depression classification performance, while Pearson’s correlation was employed to assess other variables. Sample sizes for all analyses are indicated in each figure. Test statistics were only performed between predictions surviving permutation testing. The detailed test statistics are given in Supplementary Tables 12,18-20. The results for the additional clinical measures are depicted in Supplementary Figure 4.

References

    1. Hariri A. R., Bookheimer S. Y. & Mazziotta J. C. Modulating emotional responses: effects of a neocortical network on the limbic system. Neuroreport 11, 43–48 (2000). - PubMed
    1. Swartz J. R., Knodt A. R., Radtke S. R. & Hariri A. R. A neural biomarker of psychological vulnerability to future life stress. Neuron 85, 505–511 (2015). - PMC - PubMed
    1. Gao S. Combining multiple connectomes improves predictive modeling of phenotypic measures. 9 (2019). - PMC - PubMed
    1. Greene A. S., Gao S., Scheinost D. & Constable R. T. Task-induced brain state manipulation improves prediction of individual traits. Nat. Commun. 9, 2807 (2018). - PMC - PubMed
    1. Gal S., Coldham Y., Tik N., Bernstein-Eliav M. & Tavor I. Act natural: Functional connectivity from naturalistic stimuli fMRI outperforms resting-state in predicting brain activity. NeuroImage 258, 119359 (2022). - PubMed

Publication types

LinkOut - more resources