[Preprint]. 2025 May 7:2025.04.28.650846.
doi: 10.1101/2025.04.28.650846.

A molecular circuit regulates fate plasticity in emerging and adult AT2 cells

Affiliations

A molecular circuit regulates fate plasticity in emerging and adult AT2 cells

Amitoj S Sawhney et al. bioRxiv. .

Update in

  • A molecular circuit regulates fate plasticity in emerging and adult AT2 cells.
    Sawhney AS, Deskin BJ, Cai J, Gibbard D, Ali G, Utoft A, Qi X, Olson A, Hausman H, Sabol L, Holmberg S, Shah R, Warren R, De Langhe S, Inde Z, Sarosiek KA, Lemire E, Haber A, Wang L, Wei Z, Benedito R, Brownfield DG. Sawhney AS, et al. Nat Commun. 2025 Oct 14;16(1):8924. doi: 10.1038/s41467-025-64224-1. Nat Commun. 2025. PMID: 41087371 Free PMC article.

Abstract

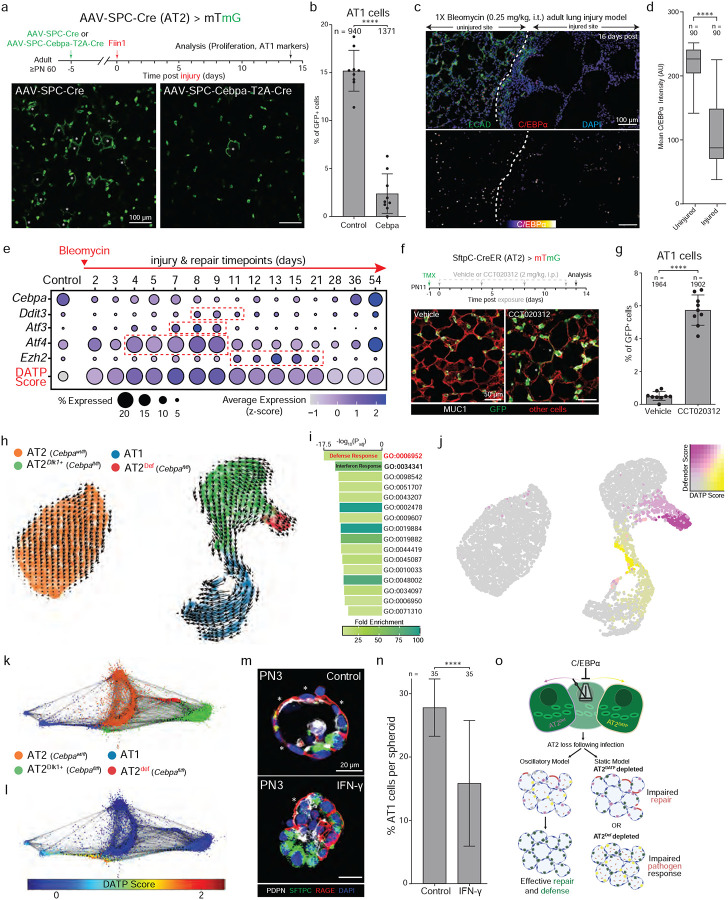
Alveolar AT1 and AT2 cells are vital for lung gas exchange and become compromised in several diseases. While key differentiation signals are known, their emergence and fate plasticity are unclear. Here we show in the embryonic lung that single AT2s emerge at intermediate zones, extrude, and connect with nearby epithelium via interlumenal junctioning. We observe that AT2s retain fate plasticity until the bZIP transcription factor C/EBPα suppresses Notch signaling at a novel Dlk1 enhancer. Both Dlk1 and Cebpa are regulated by the polycomb repressive complex (PRC2), which together form a "pulse generator" circuit that times Dlk1 expression and thus Notch activation, resulting in a "salt and pepper" pattern of AT1 and AT2 fate. In injured adult lungs, C/EBPα downregulation is required to re-access AT2 fate plasticity and is mediated by the dominant negative C/EBP family member CHOP. Finally, Cebpa loss also activates a "defender" AT2 state, distinct from its reparative state, and we propose AT2s toggle between either state following infection to protect and repair alveoli.


Conflict of interest statement

Competing interests The authors have no competing interests to declare.

Figures

Figure 1:
Figure 1:. Emergence and patterning of nascent AT2 cells.
a scRNAseq data (GSE119228) depicting embryonic, perinatal, and adult timepoints of alveolar epithelial development. b Leiden Clustering analysis identifies four populations: mature AT2s (mAT2), nascent AT2s (nAT2), distal progenitors (DP), and AT1s. c Stratification of the AT2 lineage clusters across development depicting time separation of the DP, nAT2, and mAT2 cell populations. d Venn diagram showing number of genes detected for all clusters. e Dot plot showing stage-restricted expression of selected surface markers for nAT2 and mAT2 cells, Retnla and Cd74 respectively. f e17.5 lung immunostained for nascent AT2 marker RELMα (green), mature AT2 marker CD74 (red), and DP/AT1-restrictive luminal marker PDPN (white). Bar, 25 μm. g e15.5 (left) and e16.5 (right) lungs immunostained for ASM cell marker smooth muscle actin (SMA, red), RELMα (green), epithelial marker E-cadherin (ECAD, blue), and PDPN (white). Close-up images for e15.5 lungs depict rare cases of single nAT2 cells (asterisk) emerging in intermediate regions, but not at the terminal end buds (arrowheads). Bars, 100 μm (left and right panels), 20 μm (close-ups). Mesothelium marked with white dash. h Quantification of RELMα+ nAT2 emergence in distal epithelial branches across development from e15.5 to e17.5 determined by immunostaining (n represents branches scored for each timepoint). ****p ≤ 0.0001 (Brown-Forsythe and Welch ANOVA test). i Quantification of RELMα+ nAT2 anatomical positioning (columnar versus basally extruded) across development. Extruded values presented as mean ± SD (n represents cells scored at each timepoint). j Schematic showing region of AT2 Emergent Zone (green) within Sox9+ distal epithelium at the terminal stalk (blue) instead of Sox2+ airway epithelium region. Around 17.5, nAT2 cell (RELMα+) basally extrude and then junction in distal epithelial branches and propagate emergent zone proximally further. Near birth (PN0), as proximal regions further developed, emergent zones shift to TEB.
Figure 2:
Figure 2:
a e17.5 lung immunostained for RELMα (green), PDPN (white), and DAPI (blue). a-i depicts a RELMα+ nAT2 cell traversing across the interstitium from lumen A to B. Close-up panels (right) show a nAT2 cell embedded in lumen A, at z-position +18 μm (top right), as well as in lumen B, at z-position +24 μm (bottom right). Bar, 50 μm (left), 10 μm (close-ups; right). b Quantification of nAT2 interlumenal junctioning (ILJ) events detected during development by immunostaining (n represents nAT2 cells scored at each timepoint). ****p = 4.8 × 10⁻¹¹ (one-way ANOVA, data as mean ± SD). c 3D rendering immunostaining of single (upper) and double (lower) interlumenal junctioning nAT2s for E-cadherin (green), RELMα (red), PDPN (white), and DAPI. Lumen boundaries are marked in yellow dashes. d experimental schematics of timeplase confocal microscopy on Nkx2.1Cre; Rosa26mTmG lineage labeled precision cut lung slices at distal lung. e Single nAT2 junctions between two lumens in 12-hour snapshots. f Two nAT2s established contact at 14.5 hr and junction between two lumens in 15-hour snapshots, contact marked with white arrows. g Examples of luminal Muc1 domain length in non-junctioning (left) and junctioning nAT2s h Quantification of (g) shows condensed MUC1 domain in ILJ nAT2s. (n represents number of nAT2 cells scored at each timepoint). ****p = 4.8 × 10⁻¹¹ (Student’s two-sided t-test, data as mean ± SD). i schematics of stages of interluminal junctioning, including nAT2 basal extrusion and apical domain constriction j schematics of nAT2 extrusion and junctioning outcomes at various interstitial positions.
Figure 3:
Figure 3:. Nascent AT2s retain fate plasticity.
a PN1 and adult (≥ PN60) lungs immunostained for AT2 marker MUC1 (white), RELMα (green), CD74 (red), and DAPI. Bar, 10 μm. b Timecourse quantification of (a) showing AT2 transitioning from nascent (RELMα+) to mature (CD74+). (n represents total AT2 cells scored at each timepoint in experimental triplicate, values as mean ± SD). ****p ≤ 0.0001 (one-way ANOVA, data as mean ± SD). c PN1 lung immunostained for RELMα (green), CD74 (red), and DAPI. Close-up showing both CD74+ mAT2s and RELMα+ nAT2s. Bar, 50 μm. d Alveolar fate selection during late embryogenesis, contrasted with AT2 maturation during the early post-natal period. e PAGA velocity of scRNAseq data of e15.5 and e17.5 epithelial cells. Arrow thickness represents the relative fraction of cells with velocity from the original cluster to target cluster. A transcriptional trajectory is observed starting from nAT2s to nAT1s (red arrow). f Velocity magnitude and AT1/AT2 gene score for the nAT2 fraction from (e). g Velocity analysis of the nAT2 fraction from (e) depicting AT1/AT2 score (cutoff 0.5). h scRNAseq data (GSE149563) of embryonic, perinatal, and adult time points of the distal epithelium. i Leiden clustering including a distinct transitional AT2 cluster (tAT2 > 1; brown). Close-up depicts velocity analysis (red dotted box), showing transition towards AT1 cluster. j Timepoint distribution of cells observed within tAT2 > 1 cluster in (i). k Immunostained spheroids of e15.5 distal progenitors (EpCAM+), e18.5 nAT2s (RELMα+), PN3 mAT2s (MHC-II+), and adult mAT2s (MHC-II+). Spheroids were cultured on Matrigel for four days with media supplemented every two days with FGF7 (50 ng/mL), followed by fixation and stained for PDPN (white), RAGE (red), DAPI (blue), and AT2 marker SFTPC (green). Cells that remained distal progenitors retained both AT1 markers (RAGE, PDPN) and the AT2 marker (SFTPC). Bars, 20 μm. l Quantification of (k) showing percentage of cells per spheroid that differentiated into AT1 cells determined by immunostaining (n = spheroids sampled for each condition in experimental triplicate). ****p ≤ 0.0001 (one-way ANOVA). m A revised model of the Fate Plasticity Window depicting retained fate plasticity in nAT2 cells with the ability to differentiate into AT1 cells. All experiments were repeated at least three times.
Figure 4:
Figure 4:. C/EBPα a is required to maintain but not select AT2 fate.
a A bioinformatic screen of 1,678 transcription factors or epigenetic regulators, out of which 67 are enriched along the AT2 lineage. A final list of 32 genes were selected that have known embryonic lethal or lung defects upon knockout in mice. These 32 genes stratify into four time-dependent categories: DP restrictive, DP-nAT2 restrictive, nAT2-mAT2 restrictive, and constitutive. The Plasticity Window (red dotted box) spans from ~e16.5 to ~PN7. b Dot plot showing expression of Sox9 (DP restrictive; yellow), Cebpa and Nupr1 (nAT2-mAT2 restrictive; pink), Etv5 and Elf5 (constitutive; grey) over developmental and adult timepoints. The plasticity window is depicted with a red dotted box. c e16.5 and e17.5lungs immunostained for PDPN (white), C/EBPα (green), E-cadherin (ECAD, red), and DAPI (blue). C/EBPα+ cells are marked (arrowheads) within the proximal (P) and distal (D) regions of the epithelial branches. Bars, 100 μm. d Alveolar regions of PN0 control Nkx2.1Cre; Rosa26mTmG; Cebpawt/fl (left) and Nkx2.1Cre; Rosa26mTmG; Cebpafl/fl (right) lungs immunostained for Cre reporter (mTmG) and MUC1 (white). GFP+ (DP lineage) cells form both AT1 cells (flattening; “1”) and AT2 cells (MUC1+) even upon Cebpa deletion. Bars, 50 μm. e Alveolar regions of adult control LyzMCre; Rosa26mTmG; Cebpawt/fl (left) and LyzMCre; Rosa26mTmG; Cebpafl/fl (right) lungs immunostained for MUC1 (white) and CD74 (blue). AT2-lineage derived GFP+ cells are seen to differentiate into flat AT1 cells (asterisk) upon Cebpa deletion. Bars, 100 μm. f Quantification of (e) showing percent GFP+ cells that differentiate into AT1s upon Cebpa deletion (n represents number of GFP+ cells sampled for the Cebpawt/fl and Cebpafl/fl conditions in experimental triplicate). ****p = 1.4 × 10⁻¹⁴ (Student’s two-sided t-test, data as mean ± SD). All experiments were repeated at least three times.
Figure 5:
Figure 5:. C/EBPα blocks AT2 fate plasticity by repressing Dlk1.
a Experimental setup and timeline: Lungs were isolated 14 days post TMX (PN25) and alveolar epithelial cells (EpCAM+) from control (SftpcCreER; Tg(iSuRe-Cre); Cebpawt/fl) and Cebpa deleted (SftpcCreER; Tg(iSuRe-Cre); Cebpafl/fl) lungs were processed for scRNAseq. a-i depicts the clusters (Louvain). a-ii shows gene scores across the 3 clusters in (ai). Upon Cebpa deletion, AT2 and mAT2 scores decreases, while nAT2 score increases compared to control AT2s without activation of AT1 score of the Cebpafl/fl cluster (red dashed box). b Experimental timeline and TMX dosage. EdU water administered continuously for 14 days. Lungs immunostained for tdT (red) and proliferation (detected by ClickIT in green). Cebpa deleted lungs with either high (~99% AT2s) or sparse dose (~20% AT2s) TMX, depicting proliferating AT2-lineage cells (asterisk) and flattening AT1 cells (arrowhead). Bars, 50 μm. c Quantification of (b) showing percent tdT+ AT1 cells upon Cebpa deletion in either High Dose (fl/fl – H.D.) or Sparse (fl/fl – Sp) deletions compared to control (wt/fl) AT2s (n represents tdT+ cells sampled for each condition in experimental triplicate). ****p ≤ 0.0001 (One-way ANOVA with Tukey’s multiple comparisons testing; data as mean ± SD). d Average gene expression values (log2 fold change) of the 22 (out of 107 total) genes that encode for extracellular proteins enriched in the Cebpafl/fl AT2 cluster. Six genes (bold) are found to be upregulated in nAT2 cells and four of which encodes secreted (green) or membrane bound (red) protein, with Dlk1 (red, bold) having the highest fold expression (log2 fold change). e Alveolar regions of lungs from control SftpcCreER; Tg(iSuRe-Cre); Cebpawt/fl (left) or SftpcCreER; Tg(iSuRe-Cre); Cebpafl/fl (right) mice, isolated 14 days post high-dose TMX (at PN25). Lungs were immunostained for DLK1 (green) and tdT (red). Bars, 20 μm. f Quantification of (e) for percent TdT+ AT2 cells that express DLK1 upon loss of Cebpa in both high dose and sparse deletion conditions. Note similar percentage of tdT+ AT2s express DLK1 in both high dose and sparse deletion conditions, 47.2% and 43.9% respectively (n represents tdT+ cells sampled for control, high dose and sparse deletion in experimental triplicate). ****p ≤ 0.0001, *p = 0.015 (one-way ANOVA, data as mean ± SD). All experiments were repeated at least three times. g Bulk ATACseq tracks showing chromatin accessibility of Cebpawt/fl (blue) and Cebpafl/fl (red) AT2 cells (n = 3 replicates for each condition), showing the Dlk1 transcriptional start site (TSS) and the intergenic differentially methylated region (IG-DMR). The closest C/EBPα binding site to the Dlk1 TSS is observed at a distal trans-regulatory element (TRE, yellow), downstream of the IG-DMR, with reduced chromatic accessibility upon loss of Cebpa. Further reanalysis of ChIP-seq dataset of the TRE (red dashed box) shows elevated activity at binding sites, indicating their involvement in Dlk1 regulation.
Figure 6:
Figure 6:. PRC2 and C/EBPα act as an incoherent FFL to generate a DLK1 pulse late in development.
a Distal alveolar buds of e15.5 (top) and e17.5 (bottom) lungs immunostained for DLK1 (green) and E-cadherin (ECAD, red). Close-up images show e15.5 tips have low DLK1 intensity (fire LUT), and e17.5 tips have higher levels of DLK1 protein. Bars, 10 μm. b Dot plot showing RNA expression levels of Cebpa, Dlk1, and PRC2 members genes (red) during developmental time-course. Minimal expression of Cebpa and Dlk1 observed (grey dashed box), in contrast to the high PRC2 members genes before e16.5. c Epithelial branches of e16.5 and e17.5 lungs immunostained for PDPN (white), EZH2 (green), and E-cadherin (ECAD, red). EZH2 presence in the proximal (P) and distal (D) regions of the epithelial branches at e16.5 but absence by e17.5. Bars, 50 μm. d Immunostained spheroids of e15.5 DPs (EpCAM+) cultured on Matrigel for four days with media supplemented every two days with FGF7 alone (Control, top) or FGF7 with GSK126 (10 μM), an EZH2 inhibitor (bottom). Note an increase in DLK1 (red) in cultures with GSK126. Bars, 20 μm. e Quantification of (d) showing percent DLK1+ cells per spheroid for each condition in the culture at day 4 determined by immunostaining (n represents number of spheroids for each condition in experimental triplicate). ****p = 8.24 × 10⁻¹⁵ (Student’s two-sided t-test, data as mean ± SD). f Cistrome DB Toolkit analysis at the Cebpa locus identifies EZH2 (red) and the other PRC2 members (grey) to have enriched binding at this site. g Immunostained spheroids of e15.5 DPs cultured as in (d). Note an increase in C/EBPα (red) in GSK126 group. Bars, 20 μm. h Quantification of (g) for percent C/EBPα+ cells per spheroid at day 4 determined by immunostaining (n represents number of spheroids for each condition in experimental triplicate). ****p = 3.9 × 10−36 (Student’s two-sided t-test, data as mean ± SD). i Distal epithelial branch of an e15.5 Nkx2.1Cre; Rosa26mTmG; Ezh2fl/fl mouse lung, sparsely labeling and deleting Ezh2 in (GFP+) alveolar epithelial cells. Lungs were immunostained for C/EBPα (white) and the Cre reporter (mTmG). Bar, 10 μm. j Quantification of (i) showing percent of DP cells in the distal alveolar buds expressing C/EBPα in lineage negative (RFP+) or lineage positive (GFP+) cells (n represents number of distal alveolar buds sampled for both groups). ****p ≤ 0.0001 (Mann-Whitney U-test). k Interactions between EZH2/PRC2, C/EBPα, and DLK1 that fits the model of an incoherent, type 2 Feed Forward Loop (I2-FFL). l Model fitting of Dlk1 expression from scRNAseq data of the developing lung, following the DP > nAT2 > mAT2 lineage fitted onto an I2-FFL Model (red line). RMSE = 0.12 (High goodness of fit if RMSE ≤ 0.75). m Spheroids of e15.5 DPs cultured as in (d), immunostained for PDPN (white), SFTPC (green), RAGE (red), and DAPI. Note that treatment with GSK126 increases the proportion of AT2 differentiation detected by an increase in SFTPC+ (green) cells. Bars, 20 μm. n Quantification of (m) showing a stacked plot of the proportion of DP (white), AT1 (grey) and AT2 (black) cells determined by immunostaining. Compared to control, Both GSK126 alone and FGF7 + GSK126 groups resulted in significantly more AT2 differentiation (n represents number of spheroids for each condition in experimental triplicate). ****p = 3.3 × 10−43 for Control vs GSK126, p = 2.0 × 10−36 for Control vs FGF7 + GSK126 (one-way ANOVA, data as mean ± SD). o Schematic of DLK1 pulse upon removal of repressors reopens AT2 fate plasticity window and convert a subset of AT2s into Notch signaling senders. In conjunction of further lateral inhibition, the molecular circuit in (k) contributes to AT1/AT2 patterning in lung development. All experiments were repeated at least three times.
Figure 7:
Figure 7:. C/EBPα downregulation is required to re-access mutually exclusive Defender and Regenerative states in response to injury.
a Experimental design (top). 5 days after AAV-SPC-Cre (Control; left) or AAV-SPC-Cebpa-T2A-Cre (right) instillation into lungs of adult Rosa26mTmG mice to induce constitutive GFP-Cre expression and overdrive expression of Cebpa in AT2 cells, lungs were injured by Fiin1 (14.75 mg/kg) intratracheal instillation (i.t.). Lungs were isolated and immunostained for Cre reporter (GFP) and AT1 markers 14 days post injury (dpi). Immunostained images (bottom) show GFP+ AT1 cells (asterisk) in the control, but little to none when C/EBPα is overexpressed. Bars, 100 μm. b Quantification of (a) for percent GFP+ cells that differentiated into AT1 cells (n represents GFP+ cells sampled for each condition in experimental triplicate). ****p = 6.5 × 10⁻¹⁰ (Student’s two-sided t-test, data as mean ± SD). c Alveolar regions of an adult mouse lung 16 days post 1X Bleomycin (0.25 mg/kg, i.t.) injury, immunostained for E-cadherin (ECAD, green), C/EBPα (red), and DAPI (blue). Injured (right) sites show simplified alveolar structures with reduced E-cadherin expression compared to uninjured sites (left). C/EBPα breakout (fire LUT) below depicts reduced C/EBPα expression in injured versus uninjured sites. Bars, 100 μm. d Quantification of (c) for mean C/EBPα intensity in AT2 cells within uninjured or injured regions (n represents cells scored for each condition in experimental triplicate). ****p ≤ 0.0001 (Mann-Whitney U-test). e Dot plot from a scRNAseq dataset (GSE141259) of 1X bleomycin-induced injury in AT2 cells, showing relative gene expression in vehicle (control) and various timepoints post 1X Bleomycin injury. Spikes in expression of DATP state associated genes (Ddit3, Atf3, Atf4, and Ezh2) are marked (dashed red box), whereas a temporary reduction of Cebpa is observed upon injury. The DATP gene score (red, see Suppl. Table 1) is also plotted on this timecourse, showing an activation of a DATP associated state upon injury, which resolves over time. f Experimental design for lineage labeling AT2 cells at PN11 in SftpcCreER; Rosa26mTmG mice, followed by administration of corn oil (vehicle) or CCT020312 (2 mg/kg, intraperitoneal), a Ddit3 agonist, 1 day post TMX, and every 4 days (4 doses total). Lungs were isolated 14 days post TMX (PN25) and immunostained for Cre reported (mTmG) and MUC1 (white). Upon treatment with CCT020312, an increase in GFP+ AT1 cells (asterisk) is observed. Bars, 50 μm. g Quantification of (f) showing percent GFP+ AT1 cells for either vehicle or CCT020312 conditions (n represents GFP+ cells sampled for each condition). ****p = 2.1 × 10⁻¹¹ (Student’s two-sided t-test, data as mean ± SD). h Leiden clustering of our scRNAseq dataset reveals two distinct Cebpafl/fl AT2 clusters: AT2DLK1+ (green) and AT2Def (red). Velocity analysis (arrows) show AT2DLK1+ cells going in two separate trajectories, towards the AT1 and AT2Def clusters. i Gene Ontology (GO) analysis of the AT2Def cluster shows enriched pathogen defense response (red) and interferon signaling (black) gene programs. j DATP- and Defender-associated gene score co-expression shows a mutually exclusive pattern in Cebpafl/fl cells. k SPRING plot of the four clusters observed in (h), showing AT2Def state (red) in between the control AT2 (orange) and AT2DLK1+ (green) clusters. l SPRING plot of the DATP-associated gene score showing a high DATP score between the control AT2 (middle) and AT1 (left) clusters. m Immunostained spheroids of PN3 mAT2s cultured on Matrigel for four days with media supplemented every two days with FGF7 alone (Control, top) or with interferon-γ (20 ng/mL) (bottom). Note a decrease in AT1 cells (asterisk) in cultures treated with interferon-γ. Bars, 20 μm. n Quantification of (m) showing percent of cells per spheroid that differentiated into AT1s for each condition (n represents spheroids sampled per condition). ****p = 1.2 × 10⁻⁸ (Student’s two-sided t-test, data as mean ± SD). o Schematic showing AT2 oscillation between AT2Def (purple) and AT2DATP (yellow) states, negatively regulated by C/EBPα. Upon AT2 loss (grey AT2s) due to infection, remaining AT2s can oscillate (left) between the two states resulting in proper infection response and regeneration. The inability to access either the AT2Def or AT2DATP states would result in impaired pathogen response or impaired repair and regeneration respectively. All experiments were repeated at least three times.

References

    1. Barnes PJ, et al. Chronic obstructive pulmonary disease. Nat Rev Dis Primers 1, 15076 (2015). - PubMed
    1. Martinez FJ, et al. Idiopathic pulmonary fibrosis. Nature Rev Dis Primers 3, 17074 (2017). - PubMed
    1. Siegel R, Naishadham D, Jemal A. Cancer statistics, 2013. CA Cancer J Clin 63, 11–30 (2013). - PubMed
    1. Desai TJ, Brownfield DG, Krasnow MA. Alveolar progenitor and stem cells in lung development, renewal and cancer. Nature 507, 190–194 (2014). - PMC - PubMed
    1. Franks TJ, et al. Lung pathology of severe acute respiratory syndrome (SARS): a study of 8 autopsy cases from Singapore. Hum Pathol 34, 743–748 (2003). - PMC - PubMed

Publication types