[Preprint]. 2025 May 4:2025.05.02.649190.
doi: 10.1101/2025.05.02.649190.

Understanding the physical processes behind DNA-DNA proximity ligation assays

Affiliations

Understanding the physical processes behind DNA-DNA proximity ligation assays

Bernardo J Zubillaga Herrera et al. bioRxiv. .

Abstract

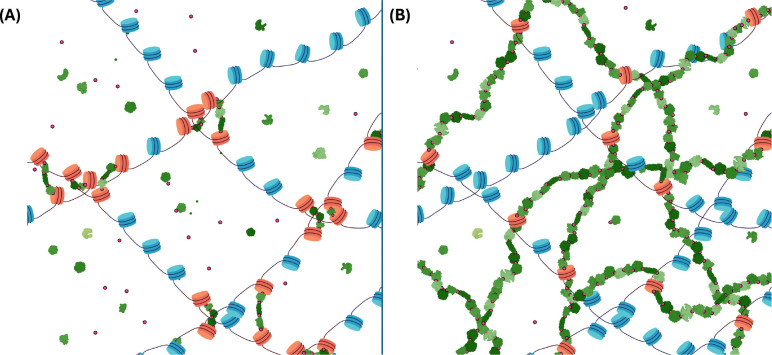
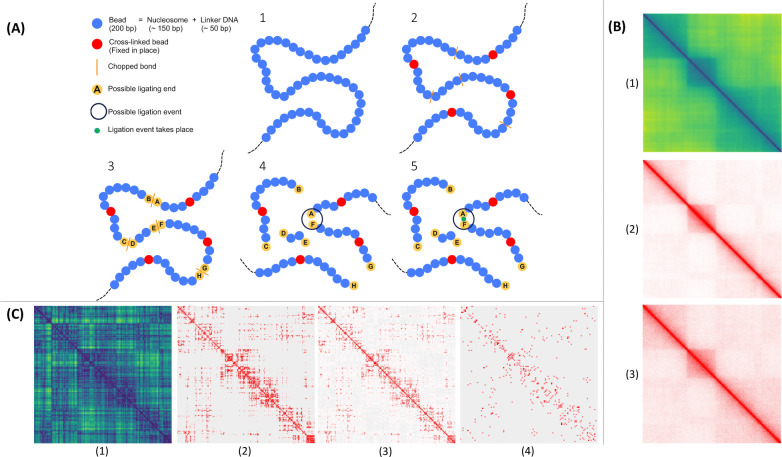
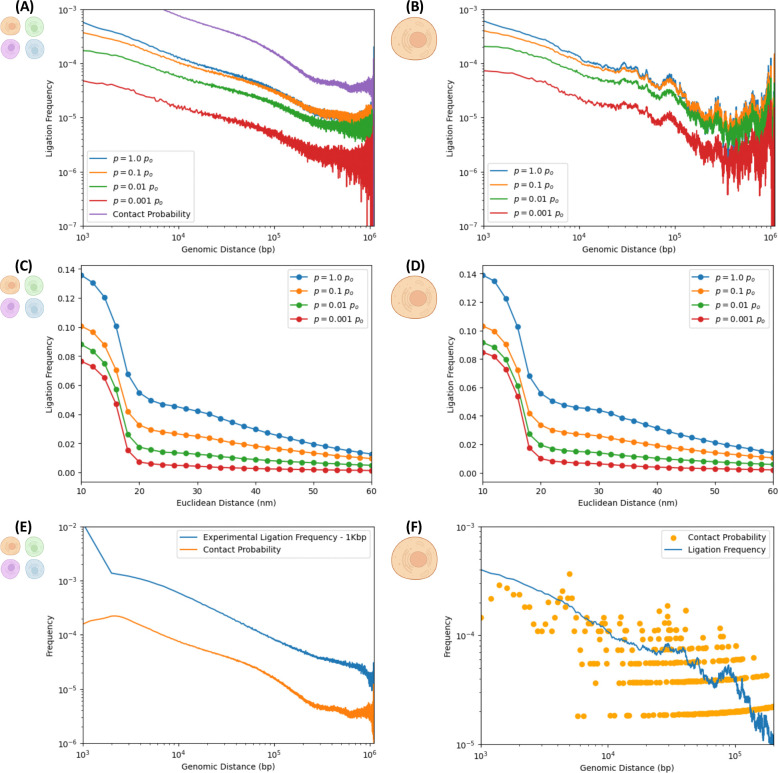
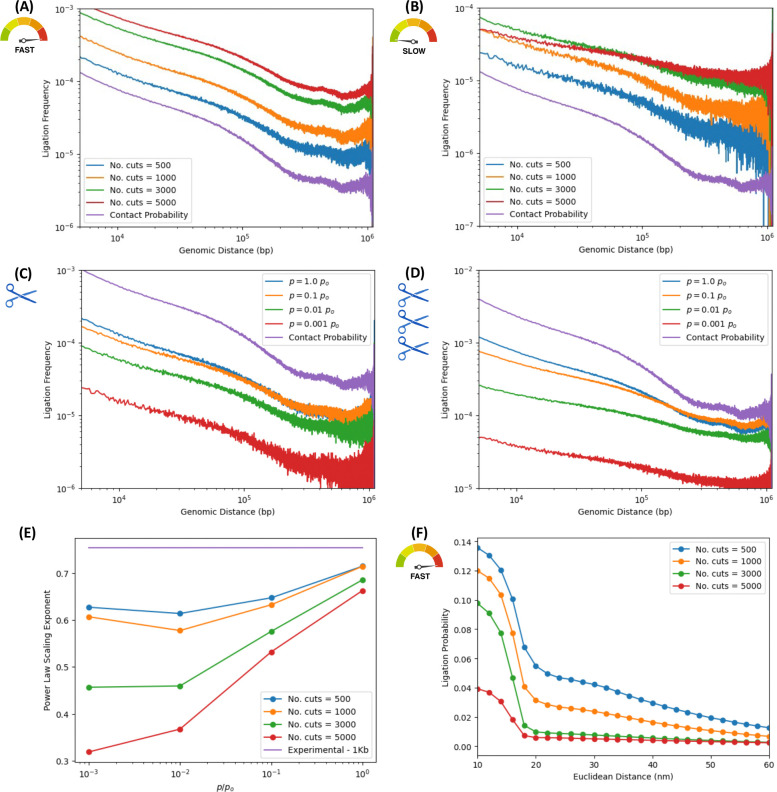
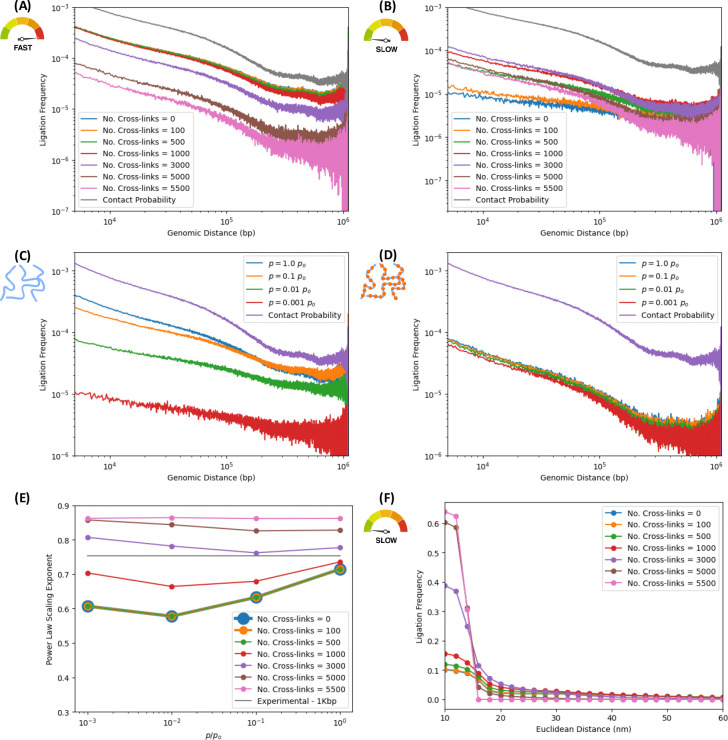
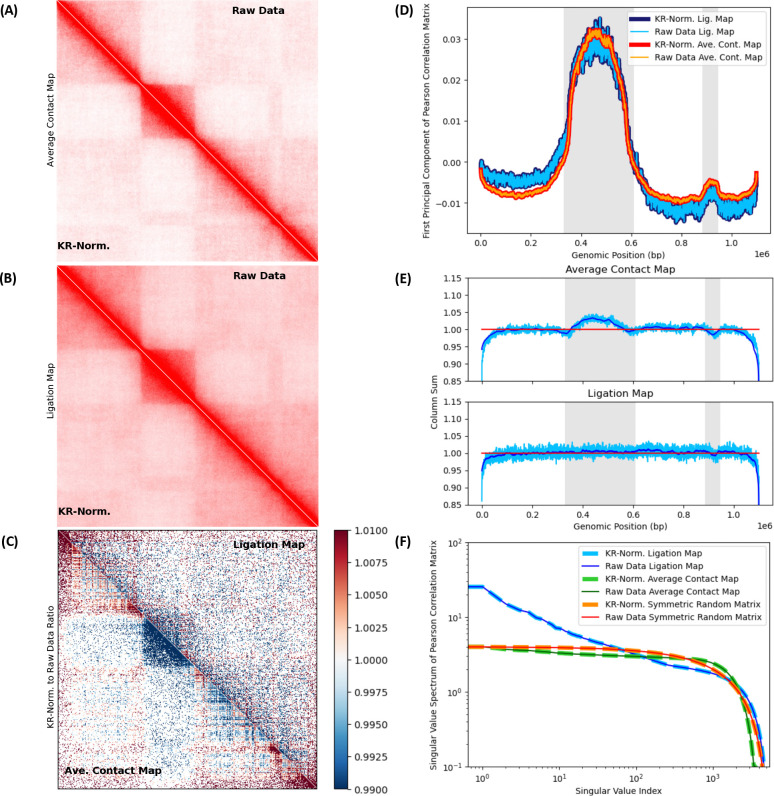
In the last decade, DNA-DNA proximity ligation assays opened powerful new ways to study the 3D organization of genomes and have become a mainstay experimental technology. Yet many aspects of these experiments remain poorly understood. We study the inner workings of DNA-DNA proximity ligation assays through numerical experiments and theoretical modeling. Chromosomes are modeled at nucleosome resolution and evolved in time via molecular dynamics. A virtual Hi-C experiment reproduces, in-silico, the different steps of the Hi-C protocol, including: crosslinking of chromatin to an underlying proteic matrix, enzymatic digestion of DNA, and subsequent proximity ligation of DNA open ends. The protocol is simulated on ensembles of different structures as well as individual structures, enabling the construction of ligation maps and the calculation of ligation probabilities as functions of genomic and Euclidean distance. The methods help to assess the effect of the many variables of the Hi-C experiment and of subsequent data processing methods on the quality of the final results.

Keywords: Chromosome Conformation Capture; DNA; DNA-DNA Proximity Ligation; Genome Structure and Organization; Hi-C; Ligation Maps.


Conflict of interest statement

8.COMPETING INTERESTS The authors declare no competing interests.

Figures

Figure 1.
Figure 1.. Two limiting cases of DNA crosslinking:
Schematic representation of two limiting cases of crosslinking, in which DNA is represented by chains of nucleosomes (in blue), crosslinking agents such as formaldehyde are represented by small red dots and proteins are represented in different shades of green. Crosslinking can take place between the histones and proteins, as well as between proteins and other proteins. Crosslinked nucleosomes are represented in red. Two limiting cases are shown in (A) and (B), corresponding to crosslinking via short-range protein bridges, and crosslinking to a nuclear protein matrix, resp. (A) Short-range protein bridges: DNA is crosslinked to DNA via short-range protein bridges, allowing for a certain freedom of motion of the crosslinked nucleosomes in chromatin. Bridges shown include up to 3 proteins. (B) Nuclear protein matrix: a nuclear protein matrix is illustrated. DNA crosslinks to the scaffold provided by the protein polymer network that percolates the physical extent of the nucleus, analogous to the cytoskeleton in the cell. The protein meshwork can be understood as the long-range limit of the protein bridges, providing higher-order interactions that make up a network, providing some structural integrity and rigidity to the nucleus. Created in BioRender. Zubillaga, B. (2025) https://BioRender.com/aixb5aa
Figure 2.
Figure 2.. In-silico protocol at nucleosome resolution.
(A) Basic steps: 1) Initial, native structure at nucleosome resolution (200bp). 2) Nucleosomes crosslink to protein matrix, fixed in place (in red). Bonds are enzymatically digested (cuts in orange). 3) Digested fragment ends (in yellow, labeled A through H) are free to ligate. 4) Structure evolves in time with molecular dynamics. 5) Ends A and F come into physical proximity (enclosed by circle). 6) Ends A and F ligate (green) with some probability rate. (B) Average distance, contact and ligation maps over native structure ensemble. Maps for ensemble of 5000 different structures modeling a 1.1Mbp region of chromosome 7 (95.4 to 96.5 Mbp) at 200bp resolution. (1) Distance map, in [nm], averaged over initial, native ensemble. (2) Average contact map of native ensemble. Beads pairs within distance of r = 1.5σ count as contacts. σ = 10 [nm] is the Lennard-Jones potential’s length-scale parameter. (3) Ligation map for 500 digested bonds, 500 crosslinked nucleosomes per structure, and ligation rate p = 10−2 po, where po = 1/τ, and τ = 2.2678 ± 0.0008 [μs]. Proximity ligation is possible if two nucleosomes are within threshold distance of r = 1.5σ. Correspondence between average distance and contact maps with ligation map shows protocol reproduces native ensemble features, including checkerboard patterns, domains and compartments. (C) Distance, contact and ligation maps of unique, single structure. Protocol is performed on individual structure of native ensemble. (1) Distance map, in [nm], of initial structure. (2) Contact map of initial structure. Contacts are counted for nucleosome pairs within threshold r = 7.5σ, where σ = 10 [nm], as before. (3) Average ligation map over 5000 scHi-C iterations on same initial structure, with same numbers of digestions, crosslinks and ligation rate as before, and ligation threshold r = 1.5σ. (4) Ligation map for single instance of in-silico scHi-C, at 10Kbp resolution for visual clarity, given the map’s sparsity at 200bp resolution (contrasted with Fig. 2.(C).(3)). Correspondence of distance and contact maps with ligation map is apparent. scHi-C protocol reproduces features of native structure and intimations of domains. In-silico protocol allows repetitions of experiment on same structure, aggregating over sparse single-iteration map, impossible in experimental scHi-C (single cells being single-use).
Figure 3.
Figure 3.. Dependence of ligation frequencies on genomic and Euclidean distances.
Left and right columns correspond to numerical experiments simulating ensemble and single-cell Hi-C experiments, resp. Ligation frequency as a function of genomic distance for different ligation rates: Ligation frequencies exhibit characteristic power-law scaling (typical of experimental maps) for different ligation rates “p”, capturing long-range interaction effects of features as domains and compartments. Results shown for different ligation rates span a few orders of magnitude both for: (A) ensemble Hi-C calculations (on 5000 different structures) and (B) scHi-C calculations (aggregating 5000 realizations on a single structure). For comparison, the average contact probability of the ensemble is shown. In (A), power-law scalings for different ligation rates resemble the contact probability over the native ensemble of initial structures. Ligation frequency as a function of the 3D Euclidean distance between pairs of nucleosomes for different ligation rates: Ligation frequency versus the Euclidean distance between pairs of loci exhibits characteristic sigmoidal decay, suggesting a characteristic length scale, in the order of ~20 [nm], over which most of the ligation events occur. Ligation frequency at Euclidean distance “d” represents the frequency with which pairs of free segment ends, initially separated by Euclidean distance “d” in the initial, native conformations, find themselves within physical proximity (within a distance of r = 1.5σ ) at some point in time and ligate according to the ligation rate. These sigmoid curves are not proper probability distribution functions and not subject to normalization. Results shown for different ligation rates span a few orders of magnitude both for: (C) ensemble Hi-C (on 5000 different structures) and (D) scHi-C (repeated 5000 times on same structure). Agreement with experimental contact probability: (E) The ensemble contact probability over 5000 native structures representative of a 1.1Mbp region of chromosome 7 agrees with corresponding experimental results over same region at 1Kbp resolution, sharing similar exponents. Averaging effect in scHi-C simulations: (F) Average ligation frequency from 5000 iterations of single-cell numerical experiment on the same initial structure, contrasted with underlying contact probability of said structure. Averaging on different realizations reduces ligation frequencies noisiness relative to the initial structure’s contact probability. Created in BioRender. Zubillaga, B. (2025) https://BioRender.com/6afacus
Figure 4.
Figure 4.. Digestion efficiency effects on ligation frequencies for different ligation rates.
In-silico ensemble Hi-C for different digestion and ligation efficiencies and 500 crosslinks. “No. cuts” is the number of bonds enzymatically cleaved, spanning the range from 500 to 5000. Ligation rates span orders of magnitude. Contact probability of native ensemble is shown for comparison. Ligation frequency vs. genomic distance for different digestion efficiencies: We explore non-equilibrium effects of fragment diffusion on ligation maps, in fast and slow ligation rate limits, for different digestion efficiencies. (A) Fast ligation rate (p = 1 × po): Similar power-law exponents, irrespective of digestion efficiency. Ligations accumulate quickly, individual fragments not diffusing significantly from initial positions before ligating. Hence the insensitivity to digestion efficiency. (B) Slow ligation rate (p = 10−3 × po ): Exponents change appreciably, and curves “flatten”. Greater fragmentation (i.e., smaller fragment sizes) progressively degrades ligation map due to non-equilibrium effects of fragment diffusion. Ligation frequency vs. genomic distance for different ligation rates: Ligation frequencies versus genomic distance are shown for high and low digestion efficiency and different ligation rates. (C) Low digestion efficiency: Just 500 bonds digested, i.e., 9.09% of bonds cleaved, for average fragment sizes of ~11 nucleosomes. Exponents are rather insensitive to ligation rates. Low cleaving rate implies low structural degradation for the ligation map. (D) High digestion efficiency: 5000 bonds digested, i.e., 90.9% of bonds cleaved, for average fragment sizes of ~1.1 nucleosomes, near nucleosome gas limit. The polymer is almost fragmented into individual nucleosomes that diffuse subject to excluded volume. After degrading chromosomes into nucleosome gases, only large ligation rates preserve information in maps. For low ligation rates, gas diffusion effaces structure. Scaling laws flatten with decreasing ligation rates for highly digested structures. Effect of digestion efficiencies on power-law exponents of ligation frequencies vs. genomic distance: (E) Non-equilibrium effects of digestion efficiency on exponents for different ligation rates. Curves for different numbers of bonds cleaved are shown. Exponents decrease with decreasing ligation efficiency, as suggested in (A) through (D). (F) Sigmoidal decay of ligation frequency versus Euclidean suggests a characteristic distance of ~20 [nm] when p = 1 × po. Ligation frequencies are ordered according to number of cuts, with large digestion efficiency corresponding to lower frequencies. Created in BioRender. Zubillaga, B. (2025) https://BioRender.com/pc4u4ij
Figure 5.
Figure 5.. Crosslinking efficiency effects for different ligation rates.
Ensemble protocol for different crosslinking and ligation efficiencies, and 1000 digested bonds. “No. Cross-links” represents the number of crosslinked nucleosomes, spanning the range from 0 (no crosslinking) to 5500 (fully crosslinked, frozen structures). Ligation rates span a few orders of magnitude. For comparison, the contact probability of native ensemble is shown. Ligation frequency vs. genomic distance for different ligation rates: We explore fast and slow ligation rate limits, for different crosslinking efficiencies. (A) Fast ligation rate p = 1 × po: Scaling laws have similar exponents irrespective of crosslinking efficiency. For high ligation rates, ligations accumulate on short timescales, fragments not diffusing significantly before ligating. (B) Slow ligation rate p = 10−3 × po: Power-laws “flatten” with decreasing crosslinking efficiency. Small ligation rates imply slower ligation accumulation and non-equilibrium effects of fragment diffusion impacting the map. Ligation vs. genomic distance for different crosslinking efficiencies: We consider low and high crosslinking efficiencies, for different ligation rates. In the former, no nucleosomes are crosslinked, and fragments can diffuse away, subject to excluded volume. In the latter, 5000 nucleosomes (i.e., 90.9% of the nucleosomes) are crosslinked to the matrix. (C) No crosslinking: In the absence of crosslinks, power-laws flatten with decreasing ligation efficiencies as structure washes away from the map with increasing and unimpeded fragment diffusion. (D) High crosslinking limit: Structures are frozen in their initial, native states. Crosslinks arresting fragment motion makes ligation frequencies insensitive to ligation rates and map impervious to diffusion. Digestion efficiency effects on power-law exponents of ligation frequencies vs. genomic distance: The effects just described are quantitatively measured by the scaling exponent vs. ligation rate for different crosslinking efficiencies (E) For low crosslinking efficiencies (0 to 500 crosslinks, i.e. 0% to 9.09% of nucleosomes crosslinked), the exponent decays with decreasing ligation efficiencies. For high crosslinking efficiencies, structures are effectively frozen in place and the exponent is insensitive to ligation rates. Effect of crosslinking efficiency on the ligation frequency vs. Euclidean distance: (F) Ligation frequency decays sigmoidally with a typical distance of ~15[nm] for different crosslinking efficiencies and a low ligation rate p = 10−3 × po. Ligation frequencies are ordered according to crosslinking efficiency. For lower crosslinking, unhampered fragment motion permits ligations between initially distant fragments. In fully crosslinked structures, fragment motion is arrested ligations between distant fragments being exceedingly unlikely, causing sharp sigmoidal decays. Created in BioRender. Zubillaga, B. (2025) https://BioRender.com/eir7kx6
Figure 6.
Figure 6.. Knight-Ruiz (KR) normalization effects on Hi-C maps.
Matrix balancing effects are studied, contrasting KR-normalized (post-processed) with non-normalized (raw) maps. In-silico ligation rate p = 10−1 × po, 3000 bond cuts and 500 crosslinks are considered. (A) KR-normalized and raw average contact maps. The upper triangular matrix (UTM) shows the raw contact map on the native ensemble. The lower triangular matrix (LTM) shows its KR-normalized counterpart. No visually obvious difference exists between them. (B) KR-normalized and raw ligation maps. The UTM and LTM show raw and KR-normalized ligation maps, resp. No visual difference is apparent. (C) KR-normalized to raw matrix ratio for ligation and average contact maps. The UTM and LTM show the ratio of KR-normalized to non-normalized matrices for ligation and contact maps, resp. Normalization depletes the contact map’s central domain (dark blue), enriching leftmost and rightmost domains (red). The corresponding effect on the ligation map is less striking, because of non-equilibrium effects of diffusion after fragmentation, free segments displacing before ligating. (D) First Principal Component (FPC) of Pearson Correlation Matrix (PCM). The FPC of the PCM is shown for raw and KR-normalized maps, for both average contact and ligation maps. Shaded backgrounds (gray) indicate compartment switches. In both ligation and contact maps, FPC captures compartment switches (see 6.(A) and 6.(B)). There is no significant difference between FPCs of raw and KR-normalized data, as their curves overlap. (E) Column sums for average contact and ligation maps. Column sum per locus is shown versus genomic position for contact and ligation maps (above and below, resp.) Pre and post normalization sums (light blue and red, resp.), and moving averages over the former (dark blue) are shown. Normalization succeeds, column sums converging to 1. Column sums over contact map distinguish compartment switches (see gray shaded backgrounds). A visible enrichment around the central domain, as well as a small depletion, agree with the FPC in 6.(D). Noisier column sums for ligation map lack obvious enrichments because of non-equilibrium effects. (F) Singular value spectra of PCMs. Spectra for KR-normalized and non-normalized data, for ligation and contact maps, and a random symmetric matrix with entries drawn from (0,1), show insensitivity to normalization.

References

    1. Lieberman-Aiden E. et al. Comprehensive Mapping of Long-Range Interactions Reveals Folding Principles of the Human Genome. Science (1979) 326, 289–293 (2009). - PMC - PubMed
    1. Rao S. S. P. et al. A 3D Map of the Human Genome at Kilobase Resolution Reveals Principles of Chromatin Looping. Cell 159, 1665–1680 (2014). - PMC - PubMed
    1. Nagano T. et al. Single-cell Hi-C reveals cell-to-cell variability in chromosome structure. Nature 502, 59–64 (2013). - PMC - PubMed
    1. Bonev B. & Cavalli G. Organization and function of the 3D genome. Nat Rev Genet 17, 661–678 (2016). - PubMed
    1. McCord R. P., Kaplan N. & Giorgetti L. Chromosome Conformation Capture and Beyond: Toward an Integrative View of Chromosome Structure and Function. Mol Cell 77, 688–708 (2020). - PMC - PubMed

Publication types

LinkOut - more resources