[Preprint]. 2025 May 8:2025.05.08.652956.
doi: 10.1101/2025.05.08.652956.

PTEN regulates starburst amacrine cell dendrite morphology during development

Affiliations

PTEN regulates starburst amacrine cell dendrite morphology during development

Teva W Bracha et al. bioRxiv. .

Abstract

Neurons are subject to extensive developmental regulation to ensure precise subtype-specific morphologies that are intimately tied to their function. Starburst amacrine cells (SACs) in the mammalian retina have a highly stereotyped, radially symmetric dendritic arbor that is essential for their role in direction-selective circuits in the retina. We show that PTEN, the primary negative regulator of the PI3K-AKT-mTOR pathway that is highly implicated in neurodevelopmental disorders, regulates SAC morphology in a cell-autonomous manner. Pten-deficient SACs show a nearly twofold increase in the number of dendritic branches, while other morphological properties remain largely unchanged. These morphological changes arise late in SAC development after dendrite development is largely complete and persist into adulthood. Mechanistically, excessive dendritic branching appears to arise from dysregulated mTOR activity. Despite this dramatic increase in dendritic branches, Pten-deficient SACs maintain a normal population number, organization of synaptic outputs, and intact direction-selectivity in the retina. Collectively, these results show that PTEN is essential for the normal development of highly stereotyped neuronal morphology.


Figures
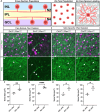
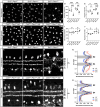
Figure 1.
Figure 1.. Validation of SAC specific Pten deletion
A. Schematic showing different retinal preparations for visualizing SACs. Retinal cross-sections (left panel) are used to analyze cellular lamination and dendrite stratification. Retinal flat mounts imaged in an En Face preparation are used for population measurements (middle panel) and single cell morphology (right panel). B-E’. P28 retinal flat mounts immunostained with ChAT (magenta) to label SAC somas and PTEN (green) shows that PTEN is present in all cells in the GCL. In Six3Cre;PtencKO retinas, PTEN is eliminated from all GCL cells (C, C’), whereas in ChATCre;PtencKO retinas, PTEN is selectively lost only from SACs (white arrows) (E, E’). F-I. Quantification of SAC soma sizes at P28 reveals somal hypertrophy, a common phenotype seen after Pten deletion, in both Six3Cre;PtencKO and ChATCre;PtencKO GCL and INL SACs (p = 0.0433 (F), 0.0017 (G), 0.0124 (H), 0.0307 (I)). Data reported as mean ± SEM. Scale bars = 25 μm.
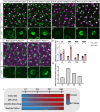
Figure 2.
Figure 2.. Selective deletion of Pten from SACs does not affect their cell density, mosaic spacing, or dendrite lamination
A-C. Images of P28 Six3Cre;PtenWT, Six3Cre;PtencHet and Six3Cre;PtencKO retina flat mounts with GCL SACs labeled by ChAT immunostaining. D, E. Quantification of cell density and mosaic spacing of GCL and INL SACs shows decreased cell density and mosaic regularity in Six3Cre;PtencKO retinas following pan-retinal deletion of Pten (p < 0.0001 for GCL and INL (D), p = 0.01 for GCL and p < 0.0001 for INL (E)). F-H. Images of P28 ChATCre;PtenWT;Ai9, ChATCre;PtencHet;Ai9 and ChATCre;PtencKO;Ai9 retina flat mounts with GCL SACs labeled by tdTomato. I, J. Quantification shows normal cell density and mosaic spacing of SACs in ChATCre;PtencKO;Ai9 retinas following selective deletion of Pten from SACs (p = 0.7195 for GCL and 0.4336 INL (I), p = 0.1871 for GCL and 0.9901 for INL (J)). K-M. P28 Six3Cre;PtenWT, Six3Cre;PtencHet and Six3Cre;PtencKO retina cross-sections labeled by ChAT immunostaining show abnormal SAC somal lamination and disorganized dendrites in Six3Cre; PtencKO retinas. N. Quantification of SAC dendrite stratification using IPLaminator shows aberrant dendrite stratification in Six3Cre;PtencKO compared to controls (p = 0.0004). O-Q. P28 ChATCre;PtenWT;Ai9, ChATCre;PtencHet;Ai9 and ChATCre;PtencKO;Ai9 retina cross-sections with SAC somas and dendrites labeled via tdTomato. SAC somal lamination and dendrite organization are grossly normal, with two distinct bands in S2 and S4 in the IPL. R. Quantification of SAC dendrite stratification shows no significant changes in ChATCre;PtencKO;Ai9 SACs relative to controls (p = 0.4638). Data reported as mean ± SEM. Scalebars = 25 μm.
Figure 3.
Figure 3.. Pten-deficient SACs have abnormal dendritic branching patterns
A-C. SACs from P21 ChATCre;PtenWT, ChATCre;PtencHet, and ChATCre;PtencKO retina flat mounts sparsely labeled with AAV8-FLEx-tdTomato-CAAX. Images show single SACs located in the INL. A’-C’. Imaris reconstructions of SACs in A-C. A”-C”. Zoomed-in view of the dendritic arbor reconstruction near the soma. D-G. Quantification of total dendrite length (GCL p = 0.033; INL p = 0.076), number of branch points (GCL and INL p < 0.0001), dendritic field area (GCL p = 0.756; INL p = 0.152), and dendrite branch self-crossings (GCL p = 0.0015; INL p < 0.0001). A significant increase in the number of branch points and self-crossings is present in both GCL and INL SACs in ChATCre;PtencKO retinas. Red dots indicate data from representative images. H, I. Sholl analysis reveals differences in local density that differ between GCL and INL SACs in ChATCre;PtencKO retinas (GCL p = 0.0312; INL p = 0.0011). GCL cKO SACs show increased density near their terminal arbors, while INL cKO SACs show increased density throughout their arbor. Data reported as mean ± SEM and contain cells from at least 3 animals. Scalebars in A-C and A’-C’ = 25 μm. Scalebar in A”-C” = 3 μm.
Figure 4.
Figure 4.. Pten-deficient SACs continue to show dendritic abnormalities at P60
A-B. P60 ChATCre;PtenCtrl and ChATCre;PtencKO SACs sparsely labeled by injection of AAV8-FLEx-tdTomato-CAAX. Images show single SACs located in the GCL. A’-B’. Enlargement from A-B highlighting that in ChATCre;PtencKO SACs one of the dendrites frequently becomes hypertrophic. A”-B”. Imaris reconstructions of SACs in A-B. C. Quantification of the number of SACs containing a hypertrophic dendrite greater than 1μm in caliber (8.33% in PtenCtrl and 81.25% in PtencKO SACs; p = 0.0003 by Fisher’s exact test). D-F. Quantification shows that P60 cKO SACs have normal total dendritic length (p = 0.345), an increased number of branch points (p < 0.0001), and reduced dendritic field area (p = 0.013). Red dots indicate data from representative images. G. Sholl analysis reveals increases in local dendrite branch density similar to the phenotype observed at P21. (p = 0.0043). Data reported as mean ± SEM and contain cells from at least 3 animals. Scalebars for A and A” = 25 μm. Scalebars for A’ = 2 μm.
Figure 5.
Figure 5.. Deletion of Pten from SACs upregulates mTOR but not GSK3β signaling
A-H. Flat mount preparations of P28 ChATCre;PtencHet;Ai9;Tcf/Lef:H2B-GFP and ChATCre;PtencKO;Ai9;Tcf/Lef:H2B-GFP retinas immunostained for tdTomato (magenta, B, F), pS6 (teal, C-G), and β-catenin reporter Tcf/Lef:H2B-GFP (green, D-H). White arrowheads highlight SAC cell bodies in the GCL in both Pten controls (A-D) and cKOs (E-H). Red arrowhead indicates a SAC with elevated levels of β-catenin reporter signal. Asterisks indicate retinal ganglion cells in both the control and cKO retinas that show elevated levels of pS6. I, J. Quantification of pS6 and β-catenin fluorescence intensity show a significant increase in pS6 levels (p = 0.009) but no change in β-catenin levels (p = 0.312) in cKO SACs. K, L. Schematic showing a simplified view of the PI3K-AKT pathway. In the absence of Pten in SACs, AKT appears to increase mTOR activity as measured by pS6 levels, while GSK3β signaling as measured by β-catenin activity remains unchanged. Data reported as mean ± SEM. Scalebars = 25 μm.
Figure 6.
Figure 6.. Increased pS6 precedes dendrite branching phenotypes in developing SACs
A-F. Retinal flat mounts of ChATCre;PtencHet and ChATCre;PtencKO SACs immunostained for ChAT (magenta) and pS6 (green) at P7 (A-B), P14 (C-D), and P60 (E-F). White arrowheads indicate SAC somas. A’-B’. Closeups of indicated P7 SAC somas show high levels of pS6 in both ChATCre;PtencHet and ChATCre;PtencKO retinas. C’-D’. At P14, pS6 levels are diminished in ChATCre;PtencHet SACs but elevated in ChATCre;PtencKO SACs. E’-F’. Closeups of SAC somas show that pS6 remains elevated in ChATCre;PtencKO SACs relative to controls at P60. G-H. Quantification at P7, P14, P28, and P60 shows that pS6 levels are initially high in SACs at P7 (p = 0.2346) and decrease at later time points in control SACs, while pS6 levels remain significantly elevated in ChATCre;PtencKO SACs relative to controls at P14 (p = 0.0007), P28 (p = 0.0006), and P60 (p < 0.0001). I. Summary of cellular phenotypes in ChATCre;PtencKO SACs over the course of development and maturation. Increases in soma size and pS6 levels become apparent by P14, increased dendritic branching by P21, and localized increases in dendrite caliber are seen at P60. Scalebars = 25 μm in A, C, and E. Scalebars = 5 μm in A’, C’, and E’.
Figure 7:
Figure 7:. Loss of Pten does not affect SAC synaptic outputs nor alter retinal responses to directional stimuli
A-B. P28 ChATCre;PtenCtrl and ChATCre;PtencKO retinas injected with AAV1-FLEx-mGFP-2A-Synaptophysin-mRuby to label SAC dendrites with membrane-bound GFP and synaptic release sites with Synaptophysin (Syp) fused to mRuby. A’-B’. Syp:mRuby shows highly compartmentalized localization to the outer third of SAC dendritic arbors in both ChATCre;PtencHet and ChATCre PtencKO SACs. C-D. Quantification of the number and volume of Syp:mRuby puncta show no significant differences between ChATCre;PtencHet and ChATCre PtencKO SACs (p = 0.146 and p = 0.332). E-F. Quantification of the distribution of Syp:mRuby puncta reveals no significant changes in the average distance from the soma (p = 0.838) or the distribution along SAC dendrites (p > 0.999) in ChATCre;PtencHet and ChATCre PtencKO SACs. Data reported as mean ± SEM and contain cells from at least 3 animals. Scalebars = 25 μm. G, H. Example polar plots of directional responses from individual RGCs following MEA recording of ChATCre;PtencHet and ChATCre PtencKO retinas. Direction selective (DS) cells were identified based on their direction selective index (DSI) and their goodness of fit for the von Mises distribution. The black trace indicates the cells responses to light stimuli in different directions, while the blue circle represents the von Mises fit. (G) shows an example of a direction selective response, while (H) shows a direction insensitive response. I. Distribution of the DSI of all detected cells from MEA recordings shows that most cells fall below the DSI threshold for a DS cell (0.37), but a small population are direction selective (p = 0.9999). J-N. Quantification of DSI (p = 0.632), von Mises fit (p = 0.5179), tuning width (p = 0.6965), average number of spikes per epoch (p = 0.8411), and average spikes (p = 0.3397) in preferred direction from DS cells; no significant differences in the response properties of DS cells were detected between ChATCre;PtencHet and ChATCre PtencKO retinas.

Similar articles

References

    1. Lefebvre J.L., Sanes J.R., and Kay J.N., Development of dendritic form and function. Annu Rev Cell Dev Biol, 2015. 31: p. 741–77. - PubMed
    1. Zeng H. and Sanes J.R., Neuronal cell-type classification: challenges, opportunities and the path forward. Nat Rev Neurosci, 2017. 18(9): p. 530–546. - PubMed
    1. Jan Y.N. and Jan L.Y., Branching out: mechanisms of dendritic arborization. Nat Rev Neurosci, 2010. 11(5): p. 316–28. - PMC - PubMed
    1. Lefebvre J.L., Molecular mechanisms that mediate dendrite morphogenesis. Curr Top Dev Biol, 2021. 142: p. 233–282. - PubMed
    1. Albeg A., et al. , C. elegans multi-dendritic sensory neurons: morphology and function. Mol Cell Neurosci, 2011. 46(1): p. 308–17. - PMC - PubMed

Publication types