[Preprint]. 2025 May 7:2025.05.07.652728.
doi: 10.1101/2025.05.07.652728.

Soma to neuron communication links stress adaptation to stress avoidance behavior

Affiliations

Soma to neuron communication links stress adaptation to stress avoidance behavior

Julia Witrado et al. bioRxiv. .

Abstract

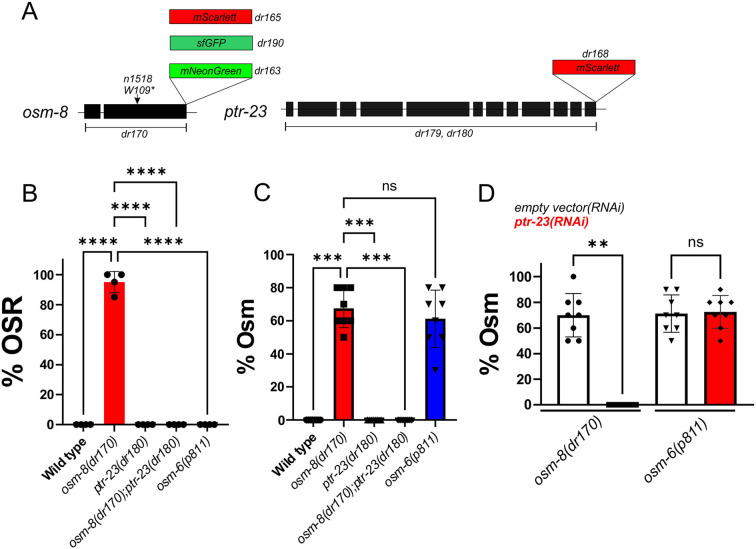
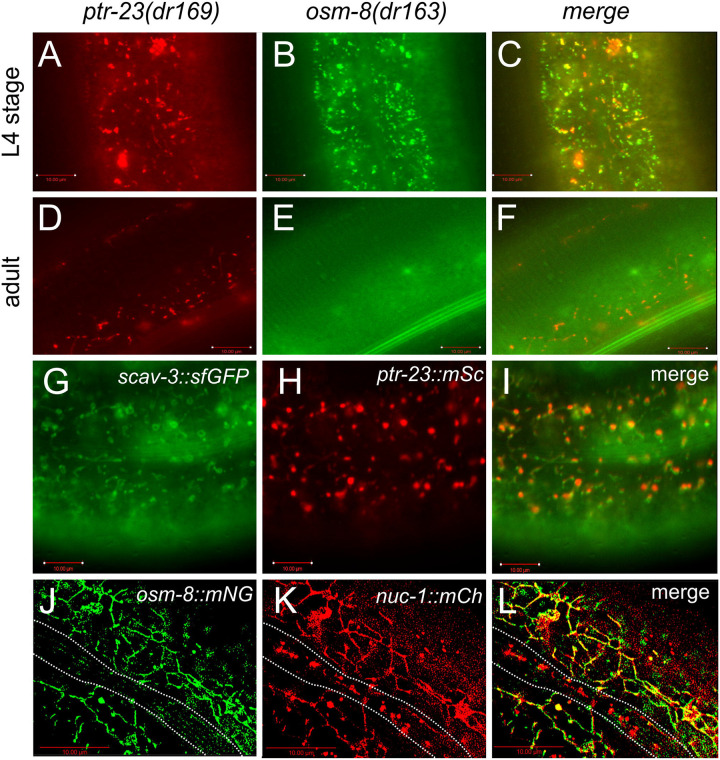
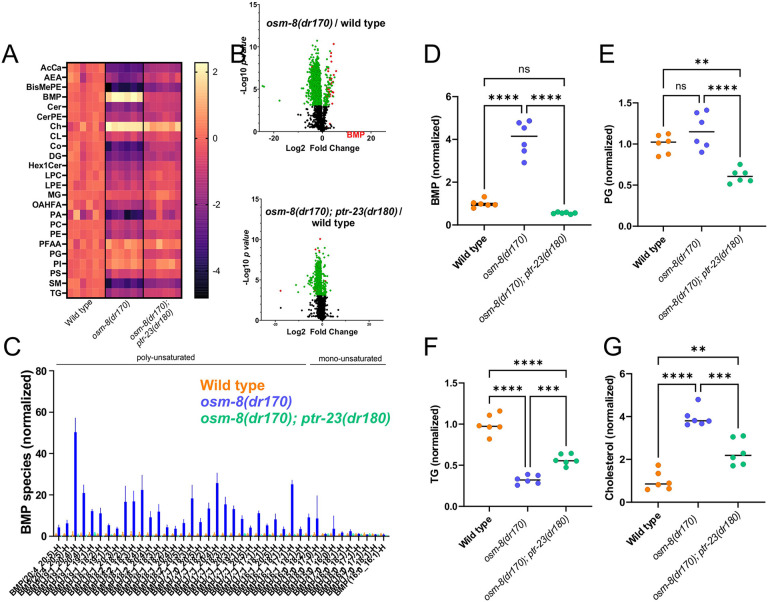
In multicellular organisms, signaling from the nervous system to the peripheral tissues can activate physiological responses to stress. Here, we show that inter-tissue stress communication can also function in reverse, i.e. from the peripheral tissue to the nervous system. osm-8 mutants, which activate the osmotic stress response in the C. elegans skin, also exhibit defective osmotic avoidance behavior, which is regulated by the ASH neuronal avoidance circuit. osm-8 osmotic avoidance behavior is completely suppressed by mutation of the Patched/NPC1 homolog ptr-23. The function of osm-8 and ptr-23 in the hypodermal epithelial cells is both necessary and sufficient for directing neuronal osmotic avoidance behavior. Endogenously tagged alleles of osm-8 and ptr-23 co-localize exclusively in the hypodermal lysosomes. Unbiased lipidomic analysis shows that osm-8 leads to a ptr-23-dependent elevation of the lysosome specific lipid bis(monoacylglycero)phosphate (BMP) and expansion of the pool of hypodermal lysosomes. Just as genetic activation of the osmotic stress response by loss of osm-8 in the hypodermis causes an Osm phenotype, acute physiological exposure to osmotic stress also confers a reversible Osm phenotype. Behavioral plasticity requires glycerol production, as mutations in the glycerol biosynthetic enzymes gpdh-1 and gpdh-2 are defective in acquired Osm behavior. While the osm-8 induced Osm behavior requires ptr-23, physiologically induced Osm behavior does not. Instead, both genetic and physiologically induced Osm phenotypes require the unusual non-neuronal lysosomal V-ATPase subunit vha-5, which is also critical for organismal osmotic stress survival. Together, these data reveal that genetic or physiological activation of stress signaling from the skin elicits lysosome-associated signals that modulate the function of a sensory neuron circuit. Such 'body-brain' interoceptive communication may allow organisms to better match neuronal decision-making with organismal physiological state.


Conflict of interest statement

Conflict of Interest Statement The authors have no conflicts of interest to declare

Figures

Figure 1 –
Figure 1 –. osm-8 physiological and behavioral phenotypes depend on ptr-23.
A) Diagram of the osm-8 and ptr-23 alleles generated in this study. A detailed list of these and other strains can be found in Table 1. The osm-8(n1518) allele was characterized in a prior study (Rohlfing et al. 2011). B) Osmotic stress resistance (OSR) phenotype of the indicated genotypes. N=8 replicates per genotype (10 animals per replicate, N=80 per genotype). ****-p<0.0001, One-way ANOVA with Kruskal-Wallis post hoc test. Individual data points are shown along with the mean ± S.D. C) Osmotic avoidance phenotype of the indicated genotypes. N=8 replicates per genotype (10 animals per replicate, N=80 per genotype). ***-p<0.001, ‘ns’ – p>0.05, One-way ANOVA with Kruskal-Wallis post hoc test. Individual data points are shown along with the mean ± S.D. D) Osmotic avoidance phenotype of the indicated genotypes. N=8 replicates per genotype (10 animals per replicate, N=80 per genotype). **-p<0.01, ‘ns’ – p>0.05, One-way ANOVA with Kruskal-Wallis post hoc test. Individual data points are shown along with the mean ± S.D.
Figure 2 –
Figure 2 –. osm-8 mutants have normal ASH osmosensory neuron development and exhibit a distinct behavioral phenotype from the ciliary mutant osm-6.
A) Dil staining of day 1 adults of the indicated genotypes. B) Latency to reversal response with 10% octanol. N= 98-136 individual trials per genotype. ****-p<0.0001, One-way ANOVA with Tukey’s multiple comparison test. Individual data points are shown along with the mean ± S.D. C) Number of encounters with the hypertonic ring in the osmotic avoidance assay per individual animal. N=18-21 animals per genotype. ****-p<0.0001, One-way ANOVA with Tukey’s multiple comparison test. Individual data points are shown along with the mean ± S.D. D) Time inside the hypertonic ring in the osmotic avoidance assay per individual animal. N=18-21 animals per genotype. ****-p<0.0001, One-way ANOVA with Tukey’s multiple comparison test. Individual data points are shown along with the mean ± S.D.
Figure 3 –
Figure 3 –. osm-8 and ptr-23 hypodermal expression is necessary and sufficient to regulate osmotic avoidance behavior.
A) Predicted expression of osm-8, ptr-23, and other Class 1 & 2 Osm mutants across sensory neurons and hypodermal cells adapted from the C. elegans neuronal gene expression map and network (CeNGEN) (Taylor et al. 2021) B) Osmotic stress resistance (OSR) phenotype of the indicated genotypes with osm-8 or ptr-23 rescue under either their endogenous promoter or the hypodermal specific promoter dpy-7p. N=8 replicates per genotype (10 animals per replicate, N=80 per genotype). ***-p<0.001, One-way ANOVA with Kruskal-Wallis post hoc test. Individual data points are shown along with the mean ± S.D. C) Osmotic avoidance phenotype of the indicated genotypes with osm-8 or ptr-23 rescue under either their endogenous promoter or the hypodermal specific promoter dpy-7p. N=8 replicates per genotype (10 animals per replicate, N=80 per genotype). ****-p<0.0001, *** – p<0.001, **-p<0.01, One-way ANOVA with Kruskal-Wallis post hoc test. Individual data points are shown along with the mean ± S.D. D) Osmotic stress resistance (OSR) phenotype of the indicated genotypes with empty vector or ptr-23 RNAi. N=8 replicates per genotype (10 animals per replicate, N=80 per genotype). ***-p<0.001, **-p<0.01, One-way ANOVA with Kruskal-Wallis post hoc test. Individual data points are shown along with the mean ± S.D.. E) Osmotic avoidance phenotype of the indicated genotypes with empty vector or ptr-23 RNAi. N=8 replicates per genotype (10 animals per replicate, N=80 per genotype). ****-p<0.0001, *-p<0.05, ‘ns’-p>0.05, One-way ANOVA with Kruskal-Wallis post hoc test. Individual data points are shown along with the mean ± S.D.
Figure 4 –
Figure 4 –. OSM-8 and PTR-23 co-localize in hypodermal lysosomes.
A) Wide-field fluorescence images of L4 stage animals expressing A) ptr-23::mSc, B) osm-8::mNG, and C) the merged overlay the indicated endogenously tagged alleles. Scale bar = 10μm. Wide-field fluorescence images of day 1 adult animals expressing D) ptr-23::mSc, E) osm-8::mNG, and F) the merged overlay the indicated endogenously tagged alleles. Scale bar = 10μm. Wide field fluorescence images of Day 1 adults expressing G) the lysosomal marker scav-3::sfGFP, H) endogenously tagged ptr-23:mSc, and I) the merged overlay. Scale bar=10μm. Deconvolved wide field image of L4 stage animals expressing J) osm-8::mNG, K) the lysosomal marker nuc-1:mCh, and L) the merged overlay. Scale bar= 10μm. Dotted lines indicate the seam cell boundary, which lack OSM-8 expression.
Figure 5 –
Figure 5 –. The lysosome-specific lipid bis(monoacylglyerol)phosphate (BMP) and cholesterol are upregulated in osm-8 mutants in a ptr-23 dependent manner.
A) Heat map of the normalized log10 fold change for each indicated lipid class. Each column represents an individual replicate of 5,000 worms. AcCa=Acyl Carnitine, AEA=N-Acylethanolamine, BisMePE=Bis-methyl phosphatidylethanolamine, BMP=Bis(monoacylglyerol)phosphate, Cer=Ceramide, CerPE=Ceramide PE, Ch=Cholesterol, CL=Cardiolipins, Co=CoenzymeQ, DG=Diglycerides, Hex1Cer=Hexosylceramide, LPC=LysoPC, LPE=LysoPE, MG=Monoglycerides, OAHFA=OAcyl-(gamma-hydroxy)FA, PA=Glycerophosphatidic acid, PC=Glycerophosphocholines, PE=Glycerophosphoethanolamines, PFAA=Primary fatty acid amines, PG=Glycerophosphoglycerols, PI=Glycerophosphoinositols, PS=Glycerophosphoserines, SM=Sphingomyelins, TG=Triradylglycerols. B) Volcano plot of the log2 fold change versus log10 p-value for all identified lipid species in osm-8(dr170) compared to wild type (top) or osm-8(dr170); ptr-23(dr180) compared to wild type (bottom). BMP lipids, which are strongly upregulated in osm-8(dr170), are highlighted in red. C) Normalized fold change for all BMP lipid species. Data shown are mean ± S.D. Lipids are organized as poly-unsaturated (>1 acyl chain double bonds) or mono-unsaturated (1 or 0 acyl chain double bonds). D) Normalized log2 fold change for BMP lipid group in wild type, osm-8(dr170) and osm-8(dr170); ptr-23(dr180). N=8 samples per genotype. Horizontal line indicates the mean. ****-p<0.0001, One-way ANOVA with Tukey post hoc test. E) Normalized log2 fold change for phosphoglycerol lipid group in wild type, osm-8(dr170) and osm-8(dr170); ptr-23(dr180). N=8 samples per genotype. Horizontal line indicates the mean. ****-p<0.0001, **-p<0.01, One-way ANOVA with Tukey post hoc test. F) Normalized log2 fold change for triglyceride lipid group in wild type, osm-8(dr170) and osm-8(dr170); ptr-23(dr180). N=8 samples per genotype. Horizontal line indicates the mean. ****-p<0.0001, ***-p<0.001, One-way ANOVA with Tukey post hoc test. G) Normalized log2 fold change for phosphoglycerol lipid group in wild type, osm-8(dr170) and osm-8(dr170); ptr-23(dr180). N=8 samples per genotype. Horizontal line indicates the mean. ****-p<0.0001, ***-p<0.001, **-p<0.01, One-way ANOVA with Tukey post hoc test.
Figure 6 –
Figure 6 –. osm-8 expands the pool of hypodermal lysosomes through a ptr-23-dependent, autophagy-independent mechanism.
A) Deconvolved flattened Z-stacks of hypodermal nuc-1:mCh lysosomal fluorescence in day 1 adult animals of the indicated genotype. Scale bar = 5μm. B) Quantification of the number of nuc-1:mCh puncta in each genotype. Individual data points are shown along with the mean ± S.D.. N=18-21 measurements from 6-7 individual animals per genotype. ****-p<0.0001, ‘ns’-not significant, One-way ANOVA with Tukey post hoc multiple comparison testing. C) Widefield images of lgg-1::gfp:mCh autophagy marker in day 1 adults of the indicated genotype. Individual green puncta represent autophagosomes while red puncta represent autolysosomes. Scale bar = 5μm
Figure 7 –
Figure 7 –. Mild physiological adaptation to osmotic stress drives a reversible Osm phenotype in wild type animals that is dependent on the V-ATPase subunit vha-5.
A) Adaptation-induced osmotic avoidance behavior in day 1 wild type animals. Black symbols represent animals that were grown on 50mM NaCl and then shifted to 250mM NaCl for the indicated amount of time prior to performance of a standard Osm assay. Red symbols indicate animals that were grown on 250mM NaCl and then shifted back to 50mM NaCl for the indicated amount of time prior to the performance of a standard Osm assay. N=8 replicates per time point for adaptation and reversal (10 animals per replicate, N=80 per genotype). Data points are the mean ± S.D. ****-p<0.0001. ***-p<0.001, ‘ns’-not significant versus t=0. One-way ANOVA with Dunnet’s multiple comparison testing. B) Osmotic adaptation osmotic avoidance assay in wild type, gpdh-1(dr154), gpdh-2(dr195), and gpdh-1(dr154); gpdh-2(dr195) day 1 adult animals. N=8 replicates per genotype and per time point (10 animals per replicate, N=80 per genotype for each time point). 88-p<0.01, ***-p<0.001, ****-p<0.0001, One-way ANOVA with Tukey post hoc test. Individual data points are shown along with the mean ± S.D. C) Osmotic adaptation osmotic avoidance assay in wild type and ptr-23(dr180) day 1 adult animals. N=8 replicates per genotype and per time point (10 animals per replicate, N=80 per genotype for each time point). ‘ns’-not significant, One-way ANOVA with Tukey post hoc test. Individual data points are shown along with the mean ± S.D. D) Osmotic adaptation osmotic avoidance assay in wild type, vha-5(RNAi), osm-8(dr170), and osm-8(dr170); vha-5(RNAi) day 1 adult animals. N=8 replicates per genotype and per time point (10 animals per replicate, N=80 per genotype for each time point). ****-p<0.0001, ‘ns’-not significant, One-way ANOVA with Tukey post hoc test. Individual data points are shown along with the mean ± S.D. E) Survival of day 1 adults after 24 hour exposure to NGM plates with either 50mM NaCl or 250mM NaCl. N=4 replicates per condition (20-25 animals per replicate, 80-100 animals per condition per genotype). ****-p<0.0001, ‘ns’-not significant, One-way ANOVA with Tukey post hoc testing. Individual data points are shown along with the mean ± S.D. F) working model for the role of osm-8, ptr-23, and vha-5 in the regulation of peripheral physiology and behavior.

Similar articles

  • Short-Term Memory Impairment.
    Cascella M, Al Khalili Y. Cascella M, et al. 2024 Jun 8. In: StatPearls [Internet]. Treasure Island (FL): StatPearls Publishing; 2025 Jan–. 2024 Jun 8. In: StatPearls [Internet]. Treasure Island (FL): StatPearls Publishing; 2025 Jan–. PMID: 31424720 Free Books & Documents.
  • The Black Book of Psychotropic Dosing and Monitoring.
    DeBattista C, Schatzberg AF. DeBattista C, et al. Psychopharmacol Bull. 2024 Jul 8;54(3):8-59. Psychopharmacol Bull. 2024. PMID: 38993656 Free PMC article. Review.
  • Sexual Harassment and Prevention Training.
    Cedeno R, Bohlen J. Cedeno R, et al. 2024 Mar 29. In: StatPearls [Internet]. Treasure Island (FL): StatPearls Publishing; 2025 Jan–. 2024 Mar 29. In: StatPearls [Internet]. Treasure Island (FL): StatPearls Publishing; 2025 Jan–. PMID: 36508513 Free Books & Documents.
  • Peripuberty Is a Sensitive Period for Prefrontal Parvalbumin Interneuron Activity to Impact Adult Cognitive Flexibility.
    Sahyoun GM, Do TD, Anqueira-Gonzàlez A, Hornblass A, Canetta SE. Sahyoun GM, et al. Dev Neurosci. 2025;47(2):127-138. doi: 10.1159/000539584. Epub 2024 Jun 3. Dev Neurosci. 2025. PMID: 38830346 Free PMC article.
  • Management of urinary stones by experts in stone disease (ESD 2025).
    Papatsoris A, Geavlete B, Radavoi GD, Alameedee M, Almusafer M, Ather MH, Budia A, Cumpanas AA, Kiremi MC, Dellis A, Elhowairis M, Galán-Llopis JA, Geavlete P, Guimerà Garcia J, Isern B, Jinga V, Lopez JM, Mainez JA, Mitsogiannis I, Mora Christian J, Moussa M, Multescu R, Oguz Acar Y, Petkova K, Piñero A, Popov E, Ramos Cebrian M, Rascu S, Siener R, Sountoulides P, Stamatelou K, Syed J, Trinchieri A. Papatsoris A, et al. Arch Ital Urol Androl. 2025 Jun 30;97(2):14085. doi: 10.4081/aiua.2025.14085. Epub 2025 Jun 30. Arch Ital Urol Androl. 2025. PMID: 40583613 Review.

References

    1. Aggad D., Brouilly N., Omi S., Essmann C. L., Dehapiot B. et al. , 2023. Meisosomes, folded membrane microdomains between the apical extracellular matrix and epidermis. Elife 12. - PMC - PubMed
    1. Ashley G. E., Duong T., Levenson M. T., Martinez M. A. Q., Johnson L. C. et al. , 2021. An expanded auxin-inducible degron toolkit for Caenorhabditis elegans. Genetics 217. - PMC - PubMed
    1. Avery J. A., Drevets W. C., Moseman S. E., Bodurka J., Barcalow J. C. et al. , 2014. Major depressive disorder is associated with abnormal interoceptive activity and functional connectivity in the insula. Biol Psychiatry 76: 258–266. - PMC - PubMed
    1. Bargmann C. I., Thomas J. H. and Horvitz H. R., 1990. Chemosensory cell function in the behavior and development of Caenorhabditis elegans. Cold Spring Harb Symp Quant Biol 55: 529–538. - PubMed
    1. Berendzen K. M., Durieux J., Shao L. W., Tian Y., Kim H. E. et al. , 2016. Neuroendocrine Coordination of Mitochondrial Stress Signaling and Proteostasis. Cell 166: 1553–1563 e1510. - PMC - PubMed

Publication types