[Preprint]. 2025 May 10:2025.05.07.652737.
doi: 10.1101/2025.05.07.652737.

A census of anti-CRISPR proteins reveals AcrIE9 as an inhibitor of Escherichia coli K12 Type IE CRISPR-Cas system

Affiliations

A census of anti-CRISPR proteins reveals AcrIE9 as an inhibitor of Escherichia coli K12 Type IE CRISPR-Cas system

Dmitry Taranenko et al. bioRxiv. .

Abstract

CRISPR-Cas adaptive immunity systems provide defense against mobile genetic elements and are often countered by diverse anti-CRISPR (Acr) proteins. The Type IE CRISPR-Cas of Escherichia coli K12 has been a model for structural and functional studies and is a part of the species' core genome. However, this system is transcriptionally silent, which has fueled questions about its true biological function. To clarify the role of this system in defense, we carried out a census of Acr proteins found in Enterobacterales and identified AcrIE9 as a potent inhibitor of the E. coli K12 Type IE CRISPR-Cas system. While sharing little sequence identity, AcrIE9 proteins from Pseudomonas and Escherichia both interact with the Cas7 subunit of the Cascade complex, thus preventing its binding to DNA. We further show that AcrIE9 is genetically linked to AcrIE10, forming the most widespread anti-CRISPR cluster in Enterobacterales, and this module often co-occurs with a novel HTH-like protein with unusual architecture.


Figures

Figure 1:
Figure 1:. Acr classes distribution among Enterobacterales.
(A) Distribution of known anti-CRISPR proteins among phage genomes and different bacterial groups. Colored circles at the top represent selected candidates for experimental evaluation, red – from Enterobacterales, blue – from Pseudomonadales. (B) Genus level taxonomic distribution of Acrs found in Enterobacterales. (C) Local genomic context of Acr genes found in Enterobacterales, as predicted by geNomad. ‘Putative phage contig’ category includes predicted phage contigs lacking terminal repeats. ‘Chromosome’ category includes all loci, not found to be associated with other categories. Numbers in parenthesis for all panels represent number of loci found.
Figure 2:
Figure 2:. Screening of Acr candidates reveals anti-CRISPR proteins active against Type I-E CRISPR-Cas of E.coli.
(A) E. coli KD263 strain with a M13 phage-targeting spacer G8 was used for M13 phage infection assay. (B) EOP with phage M13 on the lawns of KD263 cells with induced expression of Cas proteins and Acr candidates. Cultures with empty pBAD vector and without induction of CRISPR-Cas expression were used as controls. (C) E. coli SS80 strain, a KD263 derivative with T7-targeting spacer, was used for T7 infection assay. (D) EOP with phage T7 on the lawns of SS80 cells with induced expression of Cas proteins and Acr candidates. Cultures with empty pBAD vector and without induction of CRISPR-Cas expression were used as controls. (E) E. coli BW39671 strain, a BW25113 Δhns derivative with a λ phage-targeting spacer T3, was used for λvir phage infection assay. (F) EOP with phage λvir on the lawns of BW39671 cells with induced expression of Acr candidates. Cultures without a λvir targeting spacer and with empty pBAD vector were used as controls. EOPs presented on panel (B) and (D) were performed at 37C, while EOP from the panel (F) was performed at 30C. Acr expression was induced with 0.2% L-arabinose, CRISPR-Cas expression at the EOPs presented on panel (B) and (D) was induced with 0.2% L-arabinose and 1 mM IPTG, while EOP from the panel (F) was performed at conditions of native CRISPR-Cas expression. All experiments were performed in biological triplicates and bars on the right represent mean pfu/ml values.
Figure 3:
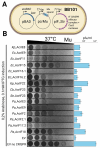
Figure 3:. Screening of Acr candidates reveals potential anti-CRISPR proteins targeting I-F CRISPR of E.coli LF82.
(A) E. coli BB101 strain with a plasmid-encoded IF LF82 system and phage-targeting spacer was used for the phage Mu phage infection assay. (B) EOP with phage Mu on the lawns of BB101 cells with induced expression of Cas proteins and Acr candidates. Cultures with empty pBAD vector and without CRISPR-Cas encoding plasmid were used as controls. Acr expression was induced with 0.2% L-arabinose, CRISPR-Cas and spacer expression was induced with 0.1 mM IPTG. All experiments were performed in biological triplicates and bars on the right represent mean pfu/ml values.
Figure 4:
Figure 4:. AcrIE9 inhibits primed but not naïve adaptation.
(A) E. coli BL21-AI strain with a plasmid-encoded Cas1-Cas2 was used for the naïve adaptation assay. Acr expression was induced with 0.2% L-arabinose, Cas1-Cas2 expression was induced with 1 mM IPTG. (B) Agarose gel representing CRISPR arrays after naïve adaptation. Expanded arrays are labeled with arrows. (C) E. coli KD263 strain transformed with a priming plasmid was used for the primed adaptation assay. Acr expression was induced with 0.2% L-arabinose, CRISPR-Cas expression was induced with 0.2% L-arabinose and 1 mM IPTG. (D) Agarose gel representing CRISPR arrays after primed adaptation. Expanded arrays are labeled with arrows. Representative gels of the experiments carrying in biological triplicates are shown on the panels (B) and (D). Expected size of the products after PCR with CRISPR array-specific primers with non-expanded and expanded array templates are shown on the right on the panels (A) and (C).
Figure 5:
Figure 5:. AcrIE9 targets Cas7 subunit of Cascade in vivo and interferes with Cascade DNA binding.
(A) E. coli KD454 strain, a KD263 derivative lacking Cas3, was used for CRISPR transcriptional silencing assay. sfGFP was expressed from pTet containing or lacking G8 protospacer. Acr expression was induced with 0.2% L-arabinose, CRISPR-Cas expression was induced with 0.2% L-arabinose and 1 mM IPTG, sfGFP expression was induced with 200 ng/mL aTc. A scheme of the assay and conditions color code is shown on the right. (B) Dynamics of sfGFP production in KD454 cells carrying an empty pBAD vector or expressing Ec_AcrIE9/Pa_AcrIE9. Fluorescence intensity was normalized to the culture optical density. (C) In vivo pull-down of Ec_AcrIE9 with a C-terminal Strep tag in E.coli KD263 after induction of untagged Ec_IE Cascade expression. Control represents a similar experiment carried with AcrIE9_Ec without the Strep tag. Identity of the labeled proteins on was determined via MALDI-TOF mass-spectrometry. (D) SDS-PAGE analysis of Cascade purified from cell cultures with or without Pa_AcrIE9 co-expression (left panel). SEC elution profiles of Cascade and Cascade:Pa_AcrIE9 complexes run on Superose 6 10/300 column (right panel).
Figure 6:
Figure 6:. AcrIE9 binds to the Cas7 subunit of the assembled Cascade complex and interferes with target DNA recognition in vitro.
(A) EMSA demonstrates Pa_AcrIE9 binding to dsDNA. 0.25 μM of 52-bp single-stranded or double-stranded DNA was incubated with Pa_AcrIE9 at increasing concentrations (17, 33 and 66 μM). (B) EMSA with increasing concentrations of Ec_IE Cascade (20 – 320 nM) and 4.5 nM of target plasmid in the presence or absence of an excess (1.5 μM) of Pa_AcrIE9. Without AcrIE9, a complete plasmid shift is achieved (top panel). In the presence of Pa_AcrIE9, two gel shifts associated with consequent binding of the Pa_AcrIE9 and Ec_IE Cascade could be observed, and Cascade binding is incomplete (bottom panel). (C) In vitro glutaraldehyde (0.5%) crosslinking assay between 23 μM Pa_AcrIE9 and 6 μM of Ec_IE Cascade, resulting in the appearance of novel band migrating above Cas7 (red arrow), that was confirmed to represent Cas7-AcrIE9 adduct.
Figure 7:
Figure 7:. AcrIE9 prevents genomic DNA degradation in a self-targeting CRISPR-Cas system.
(A) E. coli KD504 strain, a KD263 derivative encoding a self-targeting yihN spacer, was used for the CRISPR toxicity assay. Acr expression was induced with 0.2% L-arabinose, CRISPR-Cas expression was induced with 0.2% L-arabinose and 1 mM IPTG. (B) Cell toxicity after induction of CRISPR-Cas self-targeting. CRISPR-Cas was induced at time zero and at indicated time points cells were plated on M9 media supplemented with 0.2% glucose. Representative plates from an experiment performed in biological triplicates are presented. (C) Genomic DNA coverage in self-targeting KD504 cells after CRISPR-Cas induction in conditions of Pa_AcrIE9 expression or in the presence of the empty pBAD vector. Bold curves represent moving average for coverage ratios before and 3h after induction of CRISPR-Cas expression. Window size is 10kb for the left panel and 5kbp for the right panel zoomed in at the yihN protospacer region (black vertical line). Semi-transparent curves represent 1x-normalized coverage ratios for each nucleotide position.
Figure 8:
Figure 8:. AcrIE9 and AcrIE10 form a highly abundant genetic module associated with a novel HTH-like protein.
(A-B) Distribution of AcrIE9 across mobile genetic elements (A) and genera (B) within Enterobacterales order. (C) Representative genomic loci harboring acrIE9. Genes encoding proteins from one superfamily are connected with lines. σ70 promoters predicted with BPROM are shown as arrows. (D) Normalized abundance of most common protein superfamilies found in AcrIE9-encoding loci. Bars are colored according to manually assigned functional categories, identical to panel (C). (E) Co-localization of acrIE9, acrIE10, and acrIE9/10a in genomes of Enterobacterales. Genomic distance lower than 2 kB was accounted as co-localization. (F) Structure and surface charge distribution of AcrIE9/10a in comparison with distantly related Aca proteins and AcrVA4. Common HTH protein fold is colored in light blue. Comparison of AcrIE9/10a protein models with other Aca types is provided in Supplementary Figure 9. All used Aca protein sequences are listed in Supplementary Table 3.

Similar articles

References

    1. Koonin E. V, Makarova K. S. & Zhang F. Diversity, classification and evolution of CRISPR-Cas systems. Curr Opin Microbiol 37, 67–78 (2017). - PMC - PubMed
    1. Koonin E. V & Makarova K. S. Origins and evolution of CRISPR-Cas systems. Philosophical Transactions of the Royal Society B 374, 20180087 (2019). - PMC - PubMed
    1. Koonin E. V & Makarova K. S. Mobile genetic elements and evolution of CRISPR-Cas systems: all the way there and back. Genome Biol Evol 9, 2812–2825 (2017). - PMC - PubMed
    1. Sternberg S. H., Richter H., Charpentier E. & Qimron U. Adaptation in CRISPR-Cas systems. Mol Cell 61, 797–808 (2016). - PubMed
    1. Amitai G. & Sorek R. CRISPR–Cas adaptation: insights into the mechanism of action. Nat Rev Microbiol 14, 67–76 (2016). - PubMed

Publication types

LinkOut - more resources