[Preprint]. 2025 May 4:2025.04.29.651323.
doi: 10.1101/2025.04.29.651323.

Exercise training remodels inter-organ endocrine networks

Affiliations

Exercise training remodels inter-organ endocrine networks

Cheehoon Ahn et al. bioRxiv. .

Update in

Abstract

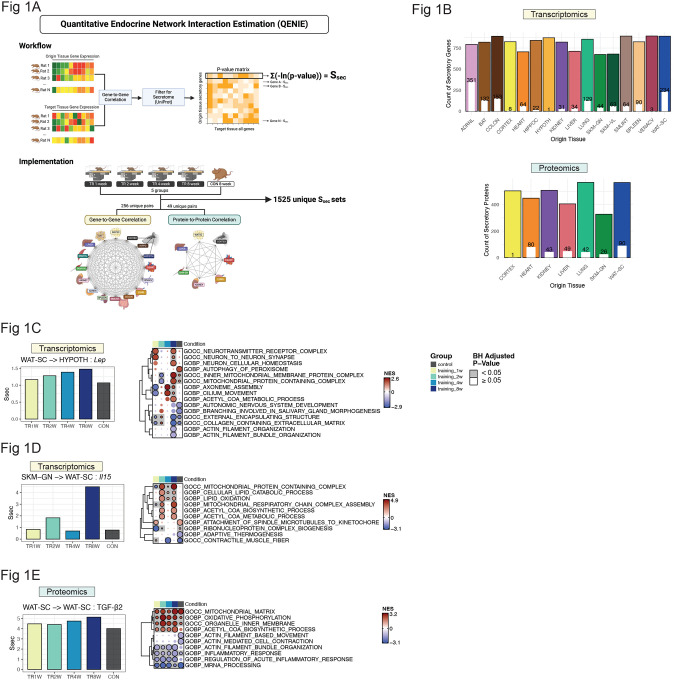
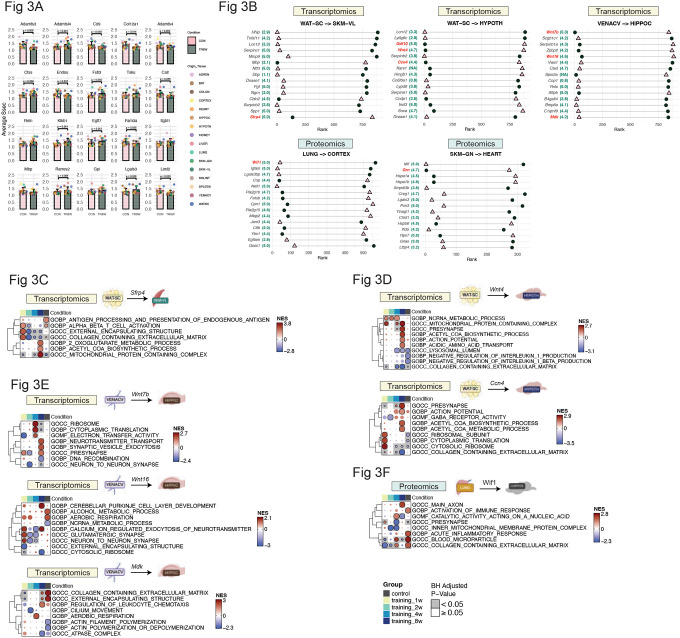
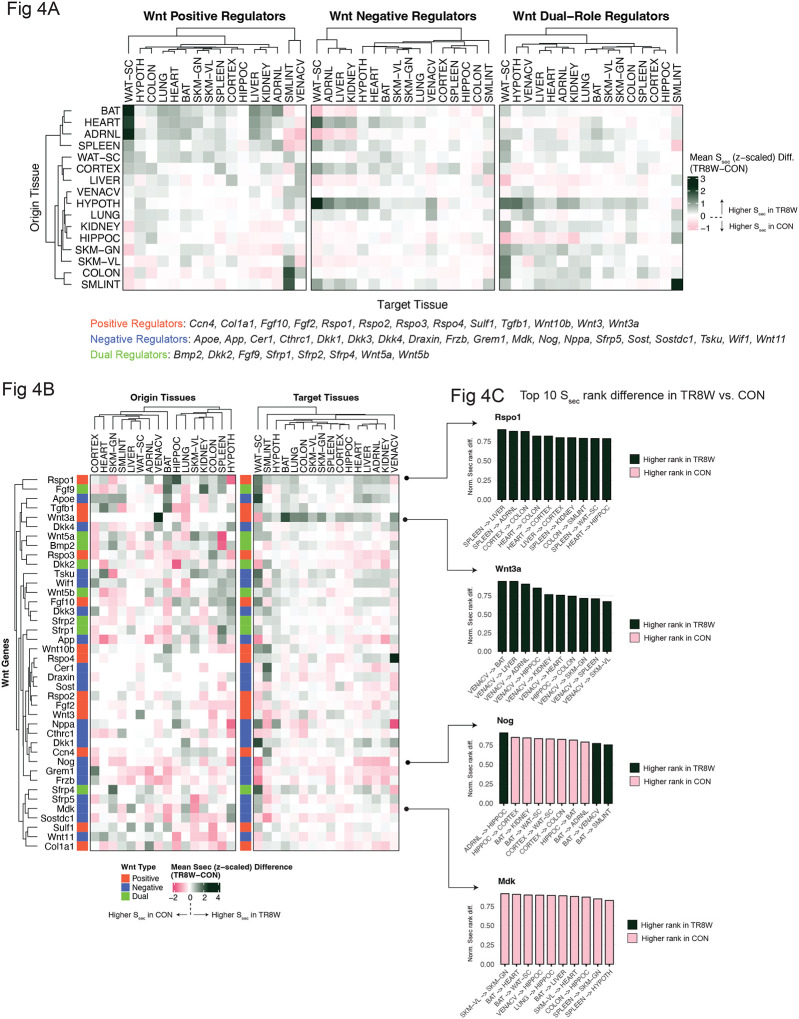
Exercise induces organism-wide molecular adaptations, partly mediated by humoral factors released in response to acute and chronic physical activity. However, the extent and specificity of endocrine effects from training-induced secreted factors remain unclear. Here, we applied systems genetics approaches to quantify inter-organ endocrine networks using multi-tissue transcriptomics and proteomics data collected from endurance-trained rats in The Molecular Transducers of Physical Activity Consortium (MoTrPAC). Eight weeks of endurance training significantly altered both the magnitude and specificity of endocrine effects across multiple origin-target tissue pairs. Subcutaneous white adipose tissue emerged as a key endocrine regulator impacted by training, while extracellular matrix-derived factors were identified as globally regulated secretory features in trained vs sedentary animals. Notably, secretory Wnt signaling factors were identified as key mediators of exercise-induced endocrine adaptations in multiple tissues. Our systems genetics framework provides an unprecedented atlas of inter-organ communication significantly remodeled by endurance exercise, serving as a valuable resource for novel exerkine discovery.


Conflict of interest statement

COMPETING INTERESTS The authors declare that they have no competing interests.

Figures

Figure 1.
Figure 1.. Workflow of QENIE and validation of physiological relevance of Ssec
A) Schematic representation of the QENIE workflow and its implementation. B) Number of secretory transcripts and proteins identified in each origin tissue after secretome filtering. White bars and numbers within the colored bars indicate the count of secretory transcripts or proteins that were significantly different between CON and TR8W. C) Ssec of Lep (WAT-SC-to-HYPOTH) across groups. Fgsea results of HYPOTH transcripts correlating with WAT-SC-Lep across groups are shown. D) Ssec of Il15 (SKM-GN-to-WAT-SC) across groups. Fgsea results of WAT-SC transcripts correlating with SKM-GN-Il15 across groups are shown. E) Ssec of TGF-β2 (WAT-SC-to-WAT-SC) across groups. Fgsea results of WAT-SC proteins correlating with WAT-SC-TGF-β2 across groups are shown. QENIE, Quantitative Endocrine Network Interaction Estimation; Ssec, Secretome score; ADRNL, Adrenal gland; BAT, brown adipose tissue; COLON, colon; CORTEX, cerebral cortex; HEART, heart; HIPPOC, hippocampus; HYPOTH, hypothalamus; KIDNEY, kidney; LIVER, liver; LUNG, lung; PLASMA, plasma; SKM-GN, gastrocnemius (skeletal muscle); SKM-VL, vastus lateralis (skeletal muscle); SMLINT, small intestine; SPLEEN, spleen; VENACV, vena cava; WAT-SC, subcutaneous white adipose tissue. CON, Control; TR, Training; GOBP, Gene Ontology Biological Process; GOCC, Gene Ontology Cellular Component; GOMF, Gene Ontology Molecular Function; NES, Normalized Enrichment Score; BH, Benjamini-Hoechberg.
Figure 2.
Figure 2.. Ssec rank difference in CON vs. TR8W
A) Volcano plot showing results of Wilcoxon signed-rank test comparing gene-to-gene Ssec rank differences between CON and TR8W. B) Volcano plot showing results of Wilcoxon signed-rank test comparing protein-to-protein Ssec rank differences between CON and TR8W. Significant (adjusted p<0.05) origin-target pairs are highlighted in black. Color-coded padded boxes represent different origin tissues. Matched origin-target pairs (e.g., CORTEX→CORTEX) are excluded from A and B but were included in the statistical testing.
Figure 3.
Figure 3.. Top secretory genes with the largest Ssec rank difference in CON vs. TR8W
A) Bar plots displaying the results of a paired t-test comparing Ssec values between CON and TR8W for the top 20 global transcripts exhibiting the largest Ssec rank differences between the two groups. B) Top 15 transcripts exhibiting the largest Ssec rank difference between the CON and TR8W for WAT-SC-to-SKM-VL, WAT-SC-to-HYPOTH, VENACV-to-HIPPOC, LUNG-to-CORTEX, and SKM-GN-to-HEART. Extracellular score (range: 0–5) obtained from COMPARTMENTS is shown in green numeric next to each feature. Pink triangles represent Ssec ranks in CON, and dark green circles represent Ssec ranks in TR8W. Features highlighted in subsequent figures are colored in red. C) Fgsea results of SKM-VL transcripts correlating with WAT-SC-Sfrp4 across groups. D) Fgsea results of HYPOTH transcripts correlating with WAT-SC-Wnt4 and WAT-SC-Ccn4 across groups. E) Fgsea results of HIPPOC transcripts correlating with VENACV-Wnt7b, VENACV-Wnt16, and VENACV-Mdk across groups. FFgsea results of CORTEX proteins correlating with LUNG-Wif1 across groups.
Figure 4.
Figure 4.. Feature- and tissue-specific remodeling of Wnt network by exercise training
A) Heatmaps displaying the average difference in Ssec (TR8W – CON) for positive, negative, and dual regulators of Wnt signaling. Each Ssec difference was z-scaled before calculating the average. Rows represent origin tissues, and columns represent target tissues. Member genes of the three categories are shown. B) Heatmaps illustrating the average difference in Ssec (TR8W – CON) for secretory Wnt factors, summarized by origin and target tissues. Each Ssec difference was z-scaled before averaging across origin or target tissues. C) Bar graphs showing the normalized Ssec rank difference between TR8W and CON for the top 10 origin-target tissue pairs with the largest rank differences for Rspo1, Wnt3a, Nog, and Mdk. Normalized rank difference was calculated by dividing the absolute Ssec rank difference between TR8W and CON by the total number of secretory genes in the origin tissue. The normalized rank difference ranges from 0 to <1. Dark bars indicate a higher rank in TR8W, while pink bars indicate a higher rank in CON.

References

    1. Ruegsegger GN, and Booth FW. Health Benefits of Exercise. Cold Spring Harb Perspect Med. 2018;8(7). - PMC - PubMed
    1. Heinonen I, Kalliokoski KK, Hannukainen JC, Duncker DJ, Nuutila P, and Knuuti J. Organ-specific physiological responses to acute physical exercise and long-term training in humans. Physiology (Bethesda). 2014;29(6):421–36. - PubMed
    1. Chow LS, Gerszten RE, Taylor JM, Pedersen BK, van Praag H, Trappe S, et al. Exerkines in health, resilience and disease. Nat Rev Endocrinol. 2022. - PMC - PubMed
    1. Hackney AC, and Lane AR. Exercise and the Regulation of Endocrine Hormones. Prog Mol Biol Transl Sci. 2015;135:293–311. - PubMed
    1. Wei W, Riley NM, Lyu X, Shen X, Guo J, Raun SH, et al. Organism-wide, cell-type-specific secretome mapping of exercise training in mice. Cell Metab. 2023;35(7):1261–79 e11. - PMC - PubMed

Publication types