[Preprint]. 2025 May 8:2024.12.27.630541.
doi: 10.1101/2024.12.27.630541.

Decoding sexual dimorphism of the sex-shared nervous system at single-neuron resolution

Affiliations

Decoding sexual dimorphism of the sex-shared nervous system at single-neuron resolution

Rizwanul Haque et al. bioRxiv. .

Update in

Abstract

Sex-specific behaviors are often attributed to differences in neuronal wiring and molecular composition, yet how genetic sex shapes the molecular architecture of the nervous system at the individual neuron level remains unclear. Here, we use single-cell RNA sequencing to profile the transcriptome of sex-shared neurons in adult Caenorhabditis elegans males and hermaphrodites. We uncover widespread molecular dimorphism across the nervous system, including in previously unrecognized neuron-types such as the touch receptors. Neuropeptides and signaling-related genes exhibit strong sex-biased expression, particularly in males, reinforcing the notion that neuropeptides are crucial for diversifying connectome outputs. Despite these differences, neurotransmitter identities remain largely conserved, indicating that functional dimorphism arises through modulatory, not identity-defining, changes. We show that sex-biased expression of neurotransmitter-related genes correlates with bias in outgoing synaptic connectivity and identify regulatory candidates for synaptic wiring, including both shared and sex-specific genes. This dataset provides a molecular framework for understanding how subtle regulatory differences tune conserved circuits to drive sex-specific behaviors.


Conflict of interest statement

Competing interests The authors declare no competing interests.

Figures
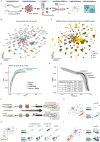
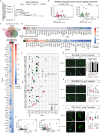
Fig. 1:
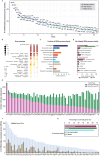
Fig. 1:. Single-cell RNA sequencing in both sexes of C. elegans.
(A) Schematic of the experimental design. Hermaphrodite and male C. elegans harboring the pan-neuronal marker rab-3p(prom1)::2xNLS::TagRFP were subjected to cell dissociation. RFP+ cells were purified by FACS. The single-cell RNA transcriptomes were obtained using 10X Genomics (https://www.10xgenomics.com). (B) UMAP representation of all cell-clusters identified with their neuronal identity. Previously published(20) (CeNGEN) datasets or manual assignments were both used to determine the IDs of the neurons. (C) UMAP representation of cell clusters with a shifted overlay to illustrate the overlap. Data sets are YA hermaphrodites (magenta), YA males (green), and CeNGEN L4 hermaphrodites (yellow). (D) Receiver-Operator Characteristic (ROC) curve showing True Positive Rate (TPR) versus False Positive Rate (FPR) for hermaphrodites, males, hermaphrodites-males together, and CeNGEN compared to ground truth expression data using the 65 cell types with 9 or more cells in hermaphrodite and male clusters. (E) Precision-Recall (PR) Curve of Recall (TPR) versus Precision [1 – False Discovery Rate (FDR)] curve. Red dots represent thresholds 1–4. Grey shading represents 95% confidence intervals. (F) Schematic of AIM neurons neurotransmitter switch from glutamatergic identity (in hermaphrodite) to cholinergic identity (in male). (G) AIM representation in the UMAP projection of all cells (inset marked as orange). UMAP projection depicting expression of unc-17, cho-1 cholinergic identity genes, eat-4 glutamatergic identity gene, and transcriptional factor lin-29 gene within AIM cluster. (H) High expression of ins-39 in males. AFD representation in the UMAP projection of all cells (inset marked in orange). UMAP projection depicting expression of ins-39 gene within AFD cluster. (I) Dimorphic expression of mab-3. Left, SMD representation in the UMAP projection of all cells (inset marked in orange). UMAP projection depicting expression of mab-3 gene within SMD cluster. In G-I, heatmaps represent expression levels (log10). Created in BioRender. Oren, M. (2025) https://BioRender.com/i2zd1il.
Fig. 2.
Fig. 2.. Comparative analysis of sex-shared neurons reveals widespread molecular dimorphism.
(A) Number of differentially expressed genes (DEGs) in the sex-shared neuronal clusters. Clusters are divided to sensory (triangle), interneuron (hexagon), and motor (circle) neurons. A gene was considered DE with average log fold change > 1, ≥ 9 cells per cluster in both sexes, p-value < 0.05, and a threshold ≥ 2 in at least one sex (See Methods). (B) Gene ontology (GO) term analysis for the 2215 DEGs in both sexes and in hermaphrodite and males separately (only genes meeting the criteria of log fold change > 1, ≥ 9 cells per cluster in both sexes, p-value < 0.05, threshold ≥ 2 in at least one of the sexes are included) reveals specific enrichment for synaptic and signaling gene expression. Wormcat p-values are determined by one-sided Fisher test with FDR correction. (C) Percentage of DEGs from each gene family as a fraction of the number of genes in the specific family. (D) The number of instances of DEGs in the gene families presented in (C) divided according to DEGs that are enriched in males (green) and hermaphrodites (magenta). Only significant comparisons are shown. A DEG that is observed in more than one cluster was counted accordingly (See Methods). For (D) we performed a two-sided Fisher’s exact test followed by p-value Bonferroni correction for multiple comparisons. (E) Number of binary genes (‘on’ in hermaphrodites ‘off’ in males in magenta, ‘on’ in males ‘off’ in hermaphrodites in green) in each cell. Cells are shown according to the number of hermaphrodite binary genes from left to right. (F) Number of DEGs across cells (light blue), with the number of binary genes (gray). (G) Percentage of binary genes in hermaphrodites, males, both, exclusively (across cell types) hermaphrodites and exclusively males.
Fig. 3.
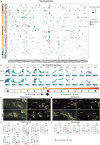
Fig. 3.. Sexual dimorphism of neuropeptides across the nervous system.
(A) Bubble plot of differentially expressed neuropeptide genes between sexes. Bubble size indicates average fold change in gene expression (only genes with log fold-change >1, ≥9 cells/cluster, p <0.05, threshold ≥2 in at least one sex included), and bubble color shows sex enrichment (green: male, magenta: hermaphrodite). Rows represent neuron types (sensory, interneurons, and motor). Columns represent genes. (B) UMAP projection of AUA, AVE, RMH, DVC, AVB, AIB, PDB, URA, M2, DVB, SAB, PLM, SIB and AVM clusters showing expression of nlp-11 gene in both sexes. Heatmap shows expression levels. Bubble plot representation of nlp-11 gene expression in clusters as in (A) of two sexes, arranged left to right by p-value (most to least significant). Bubble size represents average log fold change, bubble color (green: males; magenta:hermaphrodites) represents enrichment in each sex. (C, E) Representative confocal micrographs showing multi-colored neuronal nuclei in the NeuroPAL strain otIs669 in head (C) and tail €where neurons are identified by colour barcode(45, 46). These images were utilized to identify neurons expressing the nlp-11(syb4759[nlp-11::SL2::GFP::H2B]) reporter in young adult hermaphrodites and males. Scale bars: 10μm. (D) Quantification of nlp-11 fluorescent intensity from (C) in head neurons AUA, AVE, AIB URAD, URAV, M2, SABV, SIB AVM. (F) Quantification of nlp-11 fluorescent intensity from (E) in tail neurons DVC, PDB, PLML, PLMR, and DVB neurons in both sexes at YA stage. n represents number of animals in each group in which neurons were identified and recorded. Number of worms (hermaphrodite, male) were: AUA, AVE, URAD, URAV, PDB, PLML, PLMR (14,14); AIB (12,12); M2 (12,13); SABV, AVM (13,13); SIB (9,9); DVB (14,12); DVC (14,13). Box-and-whiskers plots show median (center line), 25–75th percentiles (box), min–max (whiskers), with dots representing data points. Two-sided Mann-Whitney test was used for comparisons.
Fig. 4.
Fig. 4.. Neurotransmitter identity is preserved across sex-shared neuronal clusters.
(A) Left and right bubble plots representing the mean expression values of neuronal identity genes in hermaphrodites and males, respectively. Neuronal clusters and genes are color-coded according to their neurotransmitter identity. (B) Bubble plot representing differentially expressed neurotransmitter identity genes between the sexes. Only genes with significant log fold change when comparing the hermaphrodite and male mean expressions are shown. Bubble size in (A) corresponds to gene expression and in (B) to the average log fold change in gene expression. Bubble color indicates enrichment in either sex (green, male; magenta, hermaphrodite). Rows represent neuron types, grouped color coding for neurotransmitter identity. Columns represent individual genes. (C) Bar plot representing the difference in outgoing connectivity between males and hermaphrodites in each cluster (The number of outgoing connections in males minus the number of outgoing connections in hermaphrodites for each neuron that was examined). Numbers are represented as an absolute value (See Methods for more details). Magenta represents a higher value in hermaphrodites, while green represents a higher value in males. (D) Two-tailed Pearson correlation analysis between the difference in connectivity (outgoing connections, all synaptic connections, and incoming connections) and the average log-fold change of neurotransmitter identity genes (See Methods for more details). The numbers representing log fold change were correlated with the number representing the difference in outgoing connectivity. The colors of the dots correspond to the neurotransmitter identity colors shown, except those that overlap and are labeled red (A). For (D) we performed a two-sided Pearson correlation test.
Fig. 5:
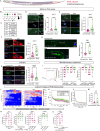
Fig. 5:. Sexually dimorphic properties of PLM neuron.
(A) Illustration of PLM sensory neuron (https://www.wormatlas.org/) (B) Bubble plot of nlp-11, flp-8, dop-3, sng-1, and mec-8 expression in PLM. Size: average log fold change; color: green: male and magenta: hermaphrodite enrichment. (C) Table showing gene functions from (B). (D-H) Representative confocal micrographs and quantification of gene expression in PLM (white dotted circle): (D) nlp-11::SL2::GFP::H2B (n=16 hermaphrodites, 15 males) (E) flp-8p::GFP (n=15/group) (F) dop-3::RFP (n=19/group) (G) sng-1::GFP in PLM neurite (n=10/group) (H) mec-8 smFISH probe with mec-4::gfp and DAPI (n=27 hermaphrodites, 26 males). Scale bars = 10 μm. a.u. = arbitrary units. (I) Left: Illustration of gentle/harsh touch in C. elegans. Created in BioRender. Oren, M. (2025) https://BioRender.com/i2zd1il Middle: posterior gentle touch responses of both sexes and harsh tail-touch responses tested on the same animals (n = 20/group). Right: anterior and posterior gentle touch responses of both sexes (n=15/group). (J) Normalized GCaMP6s calcium responses in PLM (n=13 animals per group). Heatmaps show calcium levels of individual worms. (K) Mean and SEM calcium traces from (J). (L) Mean traces showing normalized amplitudes of PLM, zoomed in at frequencies 0–0.2 Hz. (M) AUC (area under the curve) measured from PLM amplitudes for chosen frequencies (0–2 Hz). (N) Posterior gentle touch responses of both sexes after RNAi: control (n=15 each), nlp-11 (n=14 hermaphrodites, 15 males), mec-8 (n=15 hermaphrodites, 14 males), and mutants nlp-11(syb530), mec-8(ok2043) (n=14 each). (O) Posterior gentle touch responses of hermaphrodites in Wild-type (n= 17), mec-8 (ok2043)(n=18), and mec-8 rescue in PLM (n=18). Boxplots: median (line), 25th–75th percentile (box), min–max (whiskers), dots = individual data points. In (D, E, F, G, H, I, M) we performed a two-sided Mann-Whitney test for each comparison. In (N, O) we performed a Kruskal-Wallis test followed by a Dunn’s multiple comparison test.
Fig. 6:
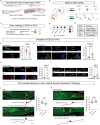
Fig. 6:. Expression of DEGs in PHC.
(A) Illustration depicting the location of PHC sensory neurons and their neurite length in both sexes, as outlined in WormAtlas. Created in BioRender. Oren, M. (2025) https://BioRender.com/i2zd1il. (B) Validation of previously reported DEGs. Left, PHC representation in the UMAP projection of all cells (inset marked as orange). UMAP projection depicting expression of dmd-3, eat-4, and flp-11 gene within PHC cluster. Heatmap represents expression level. (C) GO term enrichments for DEGs in PHC cluster, including the number of genes in each GO term. (D) Bubble plot representation of capa-1, F32B4.5, dop-3, and lad-2 differential genes expression in PHC cluster. Bubble size represents average log fold change, and bubble color (green: males and magenta: hermaphrodites) represents enrichment in each sex. (E) Table lists the established functions for genes in (D). (F-I) Representative confocal micrographs showing expression and quantification of various genes in PHC neurons (white dotted circle). (F) capa-1p::GFP. Hermaphrodites, n = 14; males, n= 16. (G) F32B4.5p::GFP,n = 10 animals per group. (H) dop-3p::RFP. n = 14 animals per group. (I) lad-2p::GFP, n = 15 animals per group. (J-K) Representative confocal micrographs of eat-4p11::GFP expression in PHC neurons in wild-type and lad-2 (tm3056) mutant males, n = 16 animals per group (J) and hermaphrodites, n = 10 animals per group (K). Scale bars represent 10 μm. In the box-and-whiskers graph, the center line in the box denotes the median, while the box contains the 25th to 75th percentiles of the dataset, whiskers define the minimum and maximum value with dots showing all points. In (F, G, H, I, J, K) We performed a two-sided Mann-Whitney test for each comparison.
Fig. 7.
Fig. 7.. Identification of genes regulating connectivity.
(A) Schematic of correlation analysis. Rows: number of outgoing connections calculated according to(37) across neurons. Columns: mean expression of genes across neurons. Pearson correlation was calculated for connectivity numbers and mean expression per gene, separately for hermaphrodites and males. (B) Mean expression of VM106R.1 across outgoing connections in both sexes. (C) Venn diagram showing significantly correlated genes in hermaphrodites and in males and the number of neuronal genes within these groups (brown) (top). Heatmap of Pearson correlation coefficients of significantly correlated and overlapping genes (bottom). (D) Heatmaps of Pearson correlation coefficient of significantly correlated neuronal genes in hermaphrodites (top) and in males (bottom). (E) Expression of significant neuronal genes from (D). Size represents average log fold change, color represents sex enrichment. (F) Mean expression of zig-1 (right) and ttx-7 (left) across outgoing connections in hermaphrodites and males. (G-I) Representative confocal micrographs and quantification of: (G) glr-3p::SNB-1::venus in RIA in Wild-type (hermaphrodites n = 15, males n = 14) and ttx-7(nj40) (n = 15/group) (left). Percentage of animals showing mislocalization of SNB-1 (right). (H) glr-3p::SNB-1::venus expression in RIA in Wild-type (hermaphrodites n = 15, males n = 14) and zig-1(ok784)(n = 15/group)(left). Quantification of venus signal (right). (I) dat-1p::novogfp::CLA-1 expression in CEP neurons in Wild-type and ttx-7(nj40)(left). Quantification of CLA-1 puncta in CEP (right). n = 15/group. In the box-and-whiskers graph, the center line in the box denotes the median, while the box contains the 25th to 75th percentiles of the dataset, whiskers define the minimum and maximum value with dots showing all points. (C) Pearson correlation analysis with Benjamini Hochberg correction for multiple comparisons was done. (G) Two-sided Fisher’s exact test was done for each comparison. (H-I) Two-sided Mann-Whitney test was done for each comparison. Magenta: hermaphrodites, green: males.

Similar articles

References

    1. Gater R., Tansella M., Korten A., Tiemens B. G., Mavreas V. G., Olatawura M. O., Sex differences in the prevalence and detection of depressive and anxiety disorders in general health care settings: report from the World Health Organization Collaborative Study on Psychological Problems in General Health Care. Arch Gen Psychiatry 55, 405–413 (1998). - PubMed
    1. Cerri S., Mus L., Blandini F., Parkinson’s Disease in Women and Men: What’s the Difference? J Parkinsons Dis 9, 501–515 (2019). - PMC - PubMed
    1. Aleman A., Kahn R. S., Selten J. P., Sex differences in the risk of schizophrenia: evidence from meta-analysis. Arch Gen Psychiatry 60, 565–571 (2003). - PubMed
    1. Fang S., Luo Z., Wei Z., Qin Y., Zheng J., Zhang H., Jin J., Li J., Miao C., Yang S., Li Y., Liang Z., Yu X. D., Zhang X. M., Xiong W., Zhu H., Gan W. B., Huang L., Li B., Sexually dimorphic control of affective state processing and empathic behaviors. Neuron 112, 1498–1517.e8 (2024). - PubMed
    1. Chiu H., Hoopfer E. D., Coughlan M. L., Pavlou H. J., Goodwin S. F., Anderson D. J., Erratum: A circuit logic for sexually shared and dimorphic aggressive behaviors in Drosophila (Cell (2021) 184(2) (507–520.e16), (S0092867420316202), ( 10.1016/j.cell.2020.11.048)). Cell 184, 847 (2021). - DOI - PMC - PubMed

Publication types

LinkOut - more resources