[Preprint]. 2025 May 2:2025.04.29.651313.
doi: 10.1101/2025.04.29.651313.

Presynaptic vesicles supply membrane for axonal bouton enlargement during LTP

Affiliations

Presynaptic vesicles supply membrane for axonal bouton enlargement during LTP

L M Kirk et al. bioRxiv. .

Abstract

Long-term potentiation (LTP) induces presynaptic bouton enlargement and a reduction in the number of synaptic vesicles. To understand the relationship between these events, we performed 3D analysis of serial section electron micrographs in rat hippocampal area CA1, 2 hours after LTP induction. We observed a high vesicle packing density in control boutons, contrasting with a lower density in most LTP boutons. Notably, the summed membrane area of the vesicles lost in low-density LTP boutons is comparable to the surface membrane required for the observed bouton enlargement when compared to high-density control boutons. These novel findings suggest that presynaptic vesicle density provides a new structural indicator of LTP that supports a local mechanism of bouton enlargement.


Figures
Extended Data Figure 1:
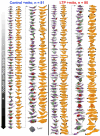
Extended Data Figure 1:. Mitochondria containing boutons.
All boutons containing mitochondria that were measured for this study are shown in descending order from smallest to largest surface area for control (left) and LTP (right) conditions. Each bouton is shown as a pair with its 3D rendering containing presynaptic vesicles (green), mitochondria (purple), and synapses (red) on the left and the selected region of the bouton used for quantification on the right (orange).
Extended Data Figure 2:
Extended Data Figure 2:. Mitochondria lacking boutons.
All boutons lacking mitochondria that were measured for this study are shown in descending order from smallest to largest surface area for control (left) and LTP (right) conditions. Each bouton is shown as a pair with its 3D rendering containing presynaptic vesicles (green) and synapses (red) on the left and the selected region of the bouton used for quantification on the right (orange).
Figure 1:
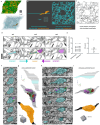
Figure 1:. Accurate segmentation and quantification of axon surface areas.
a) Reconstructed volume containing fully segmented objects from serial section EM (top). Surface meshes were generated using NeuropilTools. A sample axon is shown in orange with the remaining objects in transparent teal (bottom). b) Side view and top-down view of one virtual section that was created using the in silico ultramicrotome. c) Virtual electron micrograph with simulated membranes for each object in (b). d) Segmentation strategy using cytoplasm from adjacent serial sections (ss1 and ss3) to guide the amount of grey wall to include in the contour on ss2. e) This segmentation strategy resulted in no significant difference between the ground truth values and the manually measured surface area of axons in the virtual volumes (median absolute error = 1.7%, n = 10 axonal boutons). Serial section EM images and 3D reconstructions show example segmentation (teal) of cross-sectioned (f, g) and obliquely sectioned (h, i) axons, demonstrating how the new segmentation strategy was applied to obtain accurate surface areas. Excitatory postsynaptic densities (red), mitochondria (purple arrows), and synaptic vesicles (green arrows) are also indicated in EM images. (g, i) Top: axon contours are shown traversing through the z-axis, and the teal lines indicate the contours shown in the EM example images in (f) and (h). Middle: 3D meshes of the axons are generated and smoothed using NeuropilTools. Axons contain synapses (red), presynaptic vesicles (green), and mitochondria (purple). Bottom: the region of each axon used to calculate bouton surface area is indicated in orange, and inter-bouton regions are black.
Figure 2:
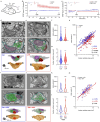
Figure 2:. Presynaptic vesicle numbers are decreased, and boutons are larger following LTP.
a) Diagram of acute hippocampal slice with one recording electrode and two stimulating electrodes delivering alternating stimuli. b) EPSP slope increased after theta burst stimulation (TBS) delivered at t = 0 min and was maintained for 2 hours (LTP: red). Test-pulse stimulation does not increase the EPSP (Control: blue). The inset shows average waveforms over 10 minutes from baseline (black; t = −10–0 min) and after TBS or control stimulation (red/blue; t = 110–120 min). c) Bath application of 50 μM APV prevents LTP induction with TBS stimulation. For (b-c) n = 2 animals per condition, and error bars show SEM. Inset scale bars: x = 5 ms and y = 10 mV. d-e) Electron micrographs, segmentations, and 3D reconstructions representing the median vesicle numbers and bouton surface areas for control (d) and LTP (e). In addition to axon segmentation (teal), postsynaptic density (red) and mitochondria (purple) segmentations are shown. Docked (orange) and non-docked (green) vesicles are also identified. f) Total vesicle number per bouton is decreased with LTP (p = 0.0005). g) Bouton surface areas are increased with LTP (p = 0.0001). h) Presynaptic vesicle numbers are positively correlated with bouton surface area in both control and LTP conditions (rp= Pearson’s R, p<0.0001). Boutons in the LTP condition have fewer presynaptic vesicles compared to control with an effect size (partial eta-squared) of 13% attributed to condition (ANCOVA: Fcondition= 42; df = 1; p<0.0001). For (f-h) ncon=141 and nLTP = 154. i-j) Electron micrographs, segmentations, and 3D reconstructions representing the median vesicle numbers and bouton surface areas for control (i) and TBS (j) in the presence of 50 μM APV. k-l) When treated with APV, neither vesicle numbers (p = 0.67) (k) nor bouton surface areas (p = 0.12) (l) were significantly altered with TBS. m) Presynaptic vesicle numbers are positively correlated with bouton surface area in both control and TBS conditions in the presence of APV (Pearson’s R, p<0.0001). However, there was no difference in presynaptic vesicles across bouton sizes between conditions (ANCOVA: Fcondition= .012; df = 1; p = 0.91). For (k-m) nCon+APV = 66 and nTBS+APV = 67.
Figure 3:
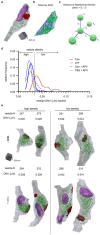
Figure 3:. Decreased vesicle density is a feature of LTP.
a) Example 3D bouton with green vesicles, purple mitochondria, and red synapse. b) Delaunay mesh connects the center-points of vesicles in (a) to determine the distances of the neighboring vesicles. c) Diagram showing how the average membrane to membrane distance to neighboring vesicles (DNV) was calculated for each vesicle. d) The relative frequency of the median DNV per bouton is plotted for each condition. The dotted line at 0.035 μm indicates where the LTP and control lines intersect. Boutons with a median DNV ≥ 0.035 μm are classified as having a low vesicle density, and boutons with DNV < 0.035 μm have a high vesicle density. Most boutons in the LTP condition had low density vesicles (77%), compared to the relatively few boutons in control, control-APV, and TBS-APV that had low density vesicles (9%, 6%, 19%, respectively). e) Example boutons with low and high vesicle densities that have similar vesicle numbers are shown, indicating that vesicle density is not merely a function of absolute vesicle number. Boutons can have high or low vesicle densities regardless of the presence of mitochondria.
Figure 4:
Figure 4:. Modeling that includes vesicle density parameters accurately predicts bouton growth from the membrane of presynaptic vesicles lost during LTP.
a) Illustration demonstrating hypothesis that presynaptic vesicles lost during LTP (blue) provide the necessary membrane to grow presynaptic boutons (right). b) Summed vesicle surface area plotted against bouton surface area with model II major axis linear regressions are shown for control and LTP. The equation for lost vesicle surface area with LTP was derived by subtracting the LTP regression from the control regression. c) Modeled bouton growth during LTP was determined for each control bouton by using the equation derived in (b) to calculate the predicted summed vesicle surface area lost with LTP and adding it to the control bouton surface area. Modeled boutons and model II linear regression are shown in grey. Although the slopes for the modeled growth and LTP regressions do not differ (pslope= 0.69), the intercepts are not equal (py-intercept= 0.4), indicating a poor model. d) Control and LTP boutons were restricted to those that had high and low vesicle densities (respectively) as determined in Figure 3. When bouton growth was modeled as in (b-c) using only these restricted data, neither the regression slope nor the y-intercept of the modeled growth boutons differed from the LTP regression (pslope= 0.12; py-intercept= 0.20).

Similar articles

References

    1. Bliss T. & Gardner-Medwin A. Long-lasting potentiation of synaptic transmission in the dentate area of the unanaesthetized rabbit following stimulation of the perforant path. https://physoc.onlinelibrary.wiley.com/doi/epdf/10.1113/jphysiol.1973.sp... (1973) doi: 10.1113/jphysiol.1973.sp010274. - DOI - DOI - PMC - PubMed
    1. Choquet D. Linking Nanoscale Dynamics of AMPA Receptor Organization to Plasticity of Excitatory Synapses and Learning. J. Neurosci. 38, 9318–9329 (2018). - PMC - PubMed
    1. Buonarati O. R., Hammes E. A., Watson J. F., Greger I. H. & Hell J. W. Mechanisms of postsynaptic localization of AMPA-type glutamate receptors and their regulation during long-term potentiation. Sci. Signal. 12, eaar6889 (2019). - PMC - PubMed
    1. Neher E. & Brose N. Dynamically Primed Synaptic Vesicle States: Key to Understand Synaptic Short-Term Plasticity. Neuron 100, 1283–1291 (2018). - PubMed
    1. Harris K. M. Enhanced cycling of presynaptic vesicles during long-term potentiation in rat hippocampus. J. Physiol. JP286983 (2025) doi: 10.1113/JP286983. - DOI - PubMed

Publication types

LinkOut - more resources