. 2025 Jul 7:17:467-484.
doi: 10.2147/JEP.S522053. eCollection 2025.

The Potential Effect of Dapagliflozin and Liraglutide in Attenuating Cardio-Renal Injuries in Diabetic Rats

Affiliations

The Potential Effect of Dapagliflozin and Liraglutide in Attenuating Cardio-Renal Injuries in Diabetic Rats

Adel Ali Albanna et al. J Exp Pharmacol. .

Abstract

Objective: To evaluate the therapeutic benefits of dapagliflozin and liraglutide as treatments for type 2 diabetes mellitus and their combined effects on T2DM-related complications, specifically cardio-renal injury.

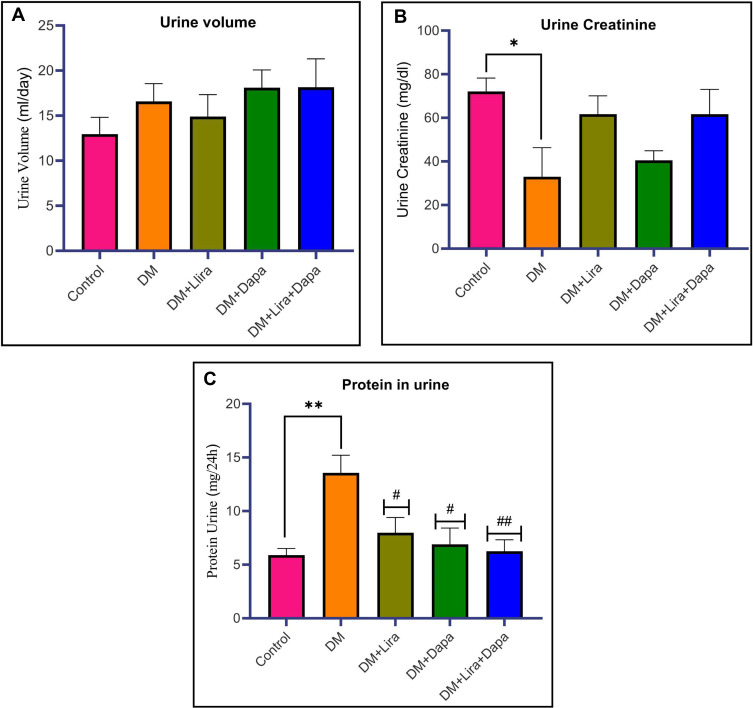
Methods: Thirty rats were randomly allocated into two groups, with the first group serving as the control group, which had 6 rats. The second group was the experimental group, which had 24 rats administered a high-fat diet for four weeks, followed by a single dose of streptozotocin (STZ) to induce diabetes mellitus (DM). This, combined with a high-fat diet, a low dose of STZ was used to cause sub-lethal damage to beta cells. HFD/STZ is an easy method to successfully create a rat model resembling human T2DM, causing insulin resistance, but it does not fully capture the complexity of human T2DM. The experimental group was randomly divided into a positive control group, a liraglutide (0.4 mg/kg, s.c) group, a dapagliflozin (1 mg/kg, orally) group, and a combination of Dapa and lira group, which were administered daily for four weeks. Blood samples were analyzed for glucose, insulin, and cardiac and kidney function markers. Cardiac and kidney tissue were examined to assess redox balance, glutathione (GSH), catalase (CAT), and malondialdehyde (MDA).

Results: Dapa and/or lira administration improved the body weight, lipid profile, cardiac and kidney function markers. Furthermore, all treating groups exhibited restoration of the balance between oxidants and antioxidants. Histological studies also revealed a reduction in cardiorenal tissue injury caused by diabetes. Interestingly, the combined management of Dapa and Lira showed a more beneficial protective effect than individual treatments. This study uniquely explores the simultaneous impact on cardiac and renal systems in a diabetic model, offering novel insights into cardiorenal interaction and the combined therapeutic potential of Dapa and Lira.

Conclusion: These findings suggest that the combination of dapagliflozin and liraglutide provides superior protection against diabetes-induced cardiorenal injury compared to either treatment alone, highlighting their potential as adjunctive therapies in reducing type 2 diabetes mellitus complications.

Keywords: cardio-renal injuries; dapagliflozin; liraglutide.


Conflict of interest statement

The authors declare that they have no competing interests in this work.

Figures

Figure 1
Figure 1
Mechanisms of kidney and cardiovascular protection by SGLT2 inhibitors.
Figure 2
Figure 2
Cardio-renal protection mechanisms of GLP-1 receptor agonists.,
Figure 3
Figure 3
Effect of liraglutide and/or dapagliflozin on body weight (BW), body mass index, heart, and kidney relative weight. (A) body weight, (B) body mass index, (C) heart relative weight, (D) kidney relative weight. Each bar is expressed as Mean ± SEM. Control vsDM: **P < 0.05; DM vs (DM+ Lira, DM+Dapa, and DM+Lira+Dapa): #P < 0.05; ##P < 0. 01; n =6 rats/group.
Figure 4
Figure 4
Effect of liraglutide and/or dapagliflozin on FBG and insulin. (A) fasting blood glucose, and (B) insulin. Each bar is expressed as Mean ± SEM. Control vs DM: ****P < 0.0001; DM vs (DM+ Lira, DM+Dapa, and DM+Lira+Dapa): ###P < 0.0001 and ##P < 0.001. n =6 rats/group.
Figure 5
Figure 5
Effect of liraglutide (Lira) and/or dapagliflozin (Dapa) on troponin I, Creatine kinase (CK-MB). (A) troponin I, (B) Creatine kinase (CK-MB). Each bar is expressed as Mean ± SEM. Control vs DM: ****P < 0.0001, **P < 0.001; DM vs (DM+ Lira, DM+Dapa, and DM+Lira+Dapa): ####P < 0.0001, ##P < 0.01, #P < 0.05. n =6 rats/group.
Figure 6
Figure 6
Effect of liraglutide and/or dapagliflozin on cholesterol, LDL, TG, and HDL. (A) cholesterol, (B) LDL, (C) TG, (D) HDL Each bar is expressed as Mean ± SEM. Control vs DM: **P < 0.01; *P < 0.05; DM vs (DM+ Lira, DM+Dapa, and DM+Lira+Dapa): #P < 0.05. ##P < 0.05. n =6 rats/group.
Figure 7
Figure 7
Effect of liraglutide and/or dapagliflozin on serum creatinine, creatinine clearance, serum urea, and blood urea nitrogen. (A) serum creatinine, (B) creatinine clearance, (C) serum urea, (D) Blood urea nitrogen. Each bar is expressed as Mean ± SEM. Control vs DM: **P < 0.01; *P < 0.05; DM vs (DM+ Lira, DM+Dapa, and DM+Lira+Dapa): #P < 0.05. n = 6 rats/group.
Figure 8
Figure 8
Effect of liraglutide and/or dapagliflozin on urine volume, urine creatinine, and protein in urine. (A) urine volume, (B) urine creatinine, (C) protein in urine. Each bar is expressed as Mean ± SEM. Control vs DM: **P < 0.01; *P < 0.05; DM vs (DM+ Lira, DM+Dapa, and DM+Lira+Dapa): #P < 0.05, ##P < 0.01. n =6 rats/group.
Figure 9
Figure 9
Effect of liraglutide (Lira) and/or dapagliflozin (Dapa) on catalase (CAT), glutathione (GSH), and malondialdehyde (MDA) in heart tissue. (A) catalase, (B) glutathione, (C) malondialdehyde. Each bar is expressed as Mean ± SEM. Control vs DM: ***P < 0.001: **P < 0.05; DM vs (DM+ Lira, DM+Dapa, and DM+Lira+Dapa): #P < 0.05, ##P < 0.01; n =6 rats/group.
Figure 10
Figure 10
Effect of liraglutide (Lira) and/or dapagliflozin (Dapa) on catalase (CAT), glutathione (GSH), and malondialdehyde (MDA) in kidney tissue. (A) catalase, (B) glutathione, (C) malondialdehyde. Each bar is expressed as Mean ± SEM. Control vs DM: ****P < 0.001; ***P < 0.005; *P < 0.05; DM vs (DM+ Lira, DM+Dapa, and DM+Lira+Dapa): ###P < 0.0001, ##P < 0.01; #P < 0.05; (n =6 rats/group).
Figure 11
Figure 11
Photomicrographs of cardiac tissue sections stained with hematoxylin and eosin (H&E) from different experimental groups: (A) Normal control illustrates a heart muscle with a normal histological structure, with a regular arrangement of muscle fibers. There is no edema or widening of extracellular spaces [400x]. (B) Diabetic group shows interstitial edema (blue stars), with ears of lysis and disruption (arrowhead), an irregular arrangement of swollen myocytes that have distorted nuclei (black arrows). Many myocytes are more eosinophilic with pyknotic nuclei (blue arrows) [400x]. (C) Additional view from diabetic group showing edema and increased extracellular spaces (blue stars), with ears of lysis and disruption (arrowheads), and pyknotic nuclei (blue arrows) [400x]. (D and E) Treated diabetic groups with Dapagliflozin (DM + Dapa) and Liraglutide (DM + Lira), respectively, show improved muscle fiber organization, resolution of edema, and minimal nuclear abnormalities. (F) Combination therapy group (DM + Dapa + Lira): nearly complete restoration of normal cardiac architecture [200x]. Scale bar = 100 µm.
Figure 12
Figure 12
Photomicrographs of renal tissues stained with Periodic Acid Schiff (PAS) from different experimental groups of rats. (A) Normal control shows a normal renal cortex with normal renal corpuscle, glomerulus (G), Bowman’s space (BS), proximal tubules (PT), and distal tubules (DT) with an undamaged brush border [400x]. (B and C) Diabetes group shows small glomeruli (G) with increased mesangial matrix and obliterated capillaries and wide Bowman’s space (BS). Most of the tubules are widened and distorted with detached epithelial cells and loss of brush borders [400x] On the other hand, the treatment groups, (D) DM + Lira, (E) DM + Dapa, and mixed (F) (DM + Dapa + Lira), all revealed an improvement and almost have similar histology to that of normal. The improvement is more evident in the Lira and mixed groups [400x]. Scale bar = 100 µm.

Similar articles

References

    1. Federation I. IDF Diabetes Atlas, tenth. International Diabetes. 2021.
    1. Association AD. Diagnosis and classification of diabetes mellitus. Diabetes Care. 2010;33(Suppl. 1):S62–S69. Erratum in: Diabetes Care. 2010;33:e57. - PMC - PubMed
    1. Kerner W, Brückel J. Definition, classification and diagnosis of diabetes mellitus. Exp Clin Endocrinol Diabetes. 2014;122(07):384–386. doi: 10.1055/s-0034-1366278 - DOI - PubMed
    1. Skyler JS, Bakris GL, Bonifacio E, et al. Differentiation of diabetes by pathophysiology, natural history, and prognosis. Diabetes. 2017;66(2):241–255. doi: 10.2337/db16-0806 - DOI - PMC - PubMed
    1. Wei J, Tian J, Tang C, et al. The influence of different types of diabetes on vascular complications. J Diabetes Res. 2022;2022:1–12. doi: 10.1155/2022/3448618 - DOI - PMC - PubMed

LinkOut - more resources