

Age-dependent changes in the power spectrum conflate composite scores to assess brain frailty
- PMID: 40655488
- PMCID: PMC12246862
- DOI: 10.1016/j.cnp.2025.06.002
Age-dependent changes in the power spectrum conflate composite scores to assess brain frailty
Abstract
Objective: Evaluating age-related dependencies in the electroencephalogram (EEG) during induction of general anesthesia and their impact on composite scores used to assess frailty.
Methods: A composite score was derived from spectral edge frequency, total power, alpha power, and the effect-site concentration (Ce) of propofol. All these parameters are influenced by age, brain health, and dosage and speed of drug administration. Correlation coefficients and variance inflation factors were used to determine multicollinearity. Differences in the spectral EEG features of patients with "high" and "low" composite scores were assessed by the area under the receiver operator characteristic curve (AUC) as the statistical test.
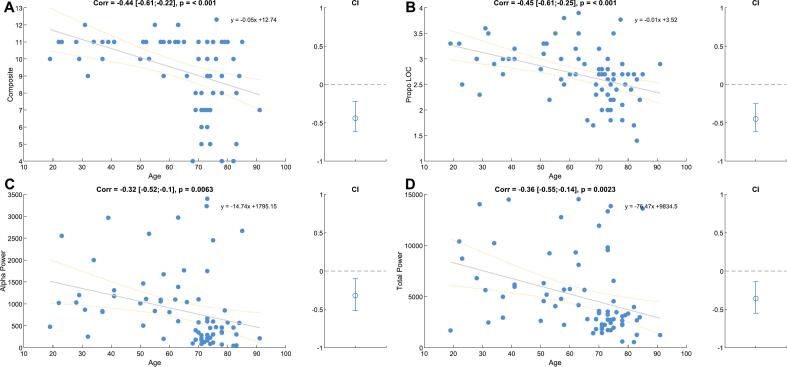
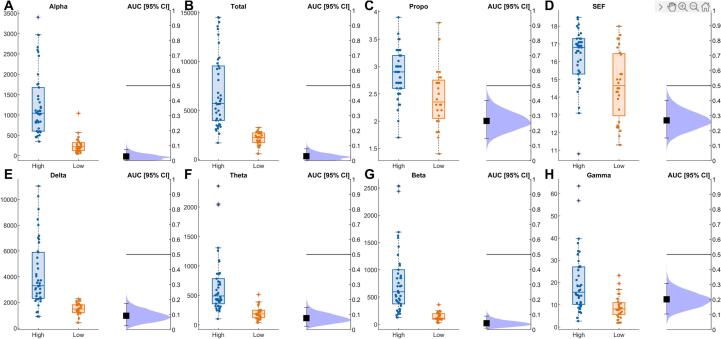
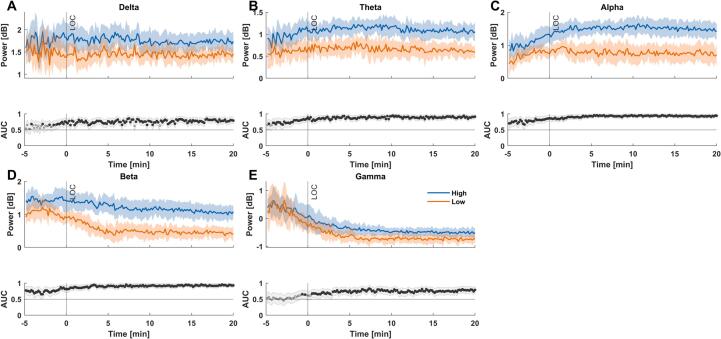
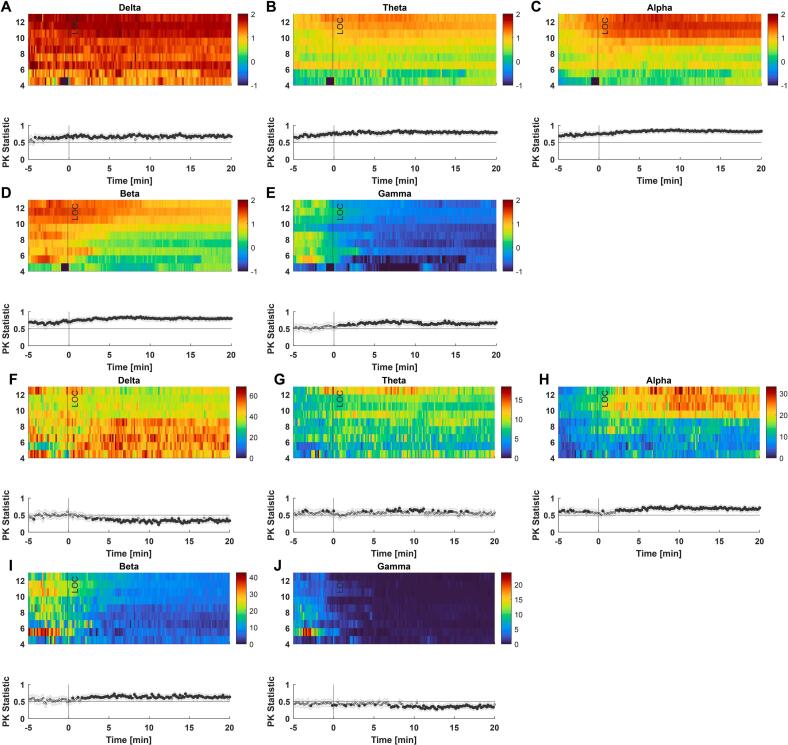
Results: The EEG features, total power and alpha power, were strongly correlated (ρ = 0.82). But alpha power (ρ = 0.17) and total power (ρ = 0.2) were only weakly correlated with propofol, indicating a weak model. Additionally, the composite score showed a moderate negative correlation with age (ρ = -0.44). We also observed significant and strong (AUC < 0.3) differences in total power and the power of all EEG bands except gamma between patients with a "high" and a "low" score before loss of responsiveness (LOR).
Conclusion: Patient age significantly influences EEG-based parameters within the score. Importantly, significant differences in spectral EEG features between the groups were already observable before LOR. These differences could allow for early assessment of a patient's brain state and to titrate anesthetic dose before LOR. The study also shows that age should be considered as it can drive models for "frailty".
Significance: Age moderately influenced all subcomponents and should consequently be factored into score interpretation.
Keywords: Age; Anesthesia; EEG; Spectral power; TCI.
© 2025 The Author(s).
Conflict of interest statement
The authors declare the following financial interests/personal relationships which may be considered as potential competing interests: The authors declare that this research did not receive any other specific grant from funding agencies in the public, commercial, or not-for-profit sectors. Matthias Kreuzer is named as an inventor for a patent dealing with spectral EEG features and age (U.S. Provisional Patent Application No. 62/914,183). Gerhard Schneider and Matthias Kreuzer are named as inventors for a patent filed on a novel method for intraoperative EEG monitoring (U.S. Patent Application Serial No. 62/960,947). Gerhard Schneider, Matthias Kreuzer are also named as inventors for a patent dealing with the EEG features during anaesthesia emergence (U.S. Provisional Patent Application No. 63/459,294). Matthias Kreuzer received funding from Masimo Corporation, Narcotrend-Gruppe, Medtronic GmbH and Fresenius Kabi Deutschland GmbH for conducting EEG-based training for anaesthesiologists and received honoraria for speaking engagements related to the EEG.
Figures

Similar articles
-
Comparison of Two Modern Survival Prediction Tools, SORG-MLA and METSSS, in Patients With Symptomatic Long-bone Metastases Who Underwent Local Treatment With Surgery Followed by Radiotherapy and With Radiotherapy Alone.Clin Orthop Relat Res. 2024 Dec 1;482(12):2193-2208. doi: 10.1097/CORR.0000000000003185. Epub 2024 Jul 23. Clin Orthop Relat Res. 2024. PMID: 39051924
-
Systemic pharmacological treatments for chronic plaque psoriasis: a network meta-analysis.Cochrane Database Syst Rev. 2021 Apr 19;4(4):CD011535. doi: 10.1002/14651858.CD011535.pub4. Cochrane Database Syst Rev. 2021. Update in: Cochrane Database Syst Rev. 2022 May 23;5:CD011535. doi: 10.1002/14651858.CD011535.pub5. PMID: 33871055 Free PMC article. Updated.
-
Systemic pharmacological treatments for chronic plaque psoriasis: a network meta-analysis.Cochrane Database Syst Rev. 2017 Dec 22;12(12):CD011535. doi: 10.1002/14651858.CD011535.pub2. Cochrane Database Syst Rev. 2017. Update in: Cochrane Database Syst Rev. 2020 Jan 9;1:CD011535. doi: 10.1002/14651858.CD011535.pub3. PMID: 29271481 Free PMC article. Updated.
-
Are Current Survival Prediction Tools Useful When Treating Subsequent Skeletal-related Events From Bone Metastases?Clin Orthop Relat Res. 2024 Sep 1;482(9):1710-1721. doi: 10.1097/CORR.0000000000003030. Epub 2024 Mar 22. Clin Orthop Relat Res. 2024. PMID: 38517402
-
A New Measure of Quantified Social Health Is Associated With Levels of Discomfort, Capability, and Mental and General Health Among Patients Seeking Musculoskeletal Specialty Care.Clin Orthop Relat Res. 2025 Apr 1;483(4):647-663. doi: 10.1097/CORR.0000000000003394. Epub 2025 Feb 5. Clin Orthop Relat Res. 2025. PMID: 39915110
References
-
- Aasheim A., Rosseland L.A., Leonardsen A.C.L., Romundstad L. Depth of anesthesia monitoring in norway—a web-based survey. Acta Anaesthesiol. 2024 Scandinavica. - PubMed
-
- Avidan M.S., Zhang L., Burnside B.A., Finkel K.J., Searleman A.C., Selvidge J.A., Saager L., Turner M.S., Rao S., Bottros M., et al. Anesthesia awareness and the bispectral index. N. Engl. J. Med. 2008;358(11):1097–1108. - PubMed
-
- Franks N.P. General anaesthesia: from molecular targets to neuronal pathways of sleep and arousal. Nat. Rev. Neurosci. 2008;9(5):370–386. - PubMed
LinkOut - more resources
Full Text Sources
