

Assessing social anhedonia in a transdiagnostic sample: Insights from a computational psychiatry lens
- PMID: 40655908
- PMCID: PMC12244229
- DOI: 10.1016/j.xjmad.2024.100088
Assessing social anhedonia in a transdiagnostic sample: Insights from a computational psychiatry lens
Abstract
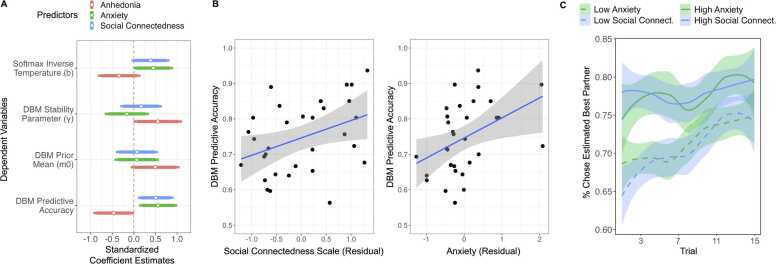
Anhedonia, a reduced ability to experience positive affect and seek rewards, is present across many psychiatric disorders, notably among individuals who experienced trauma. Within the social domain, anhedonia manifests as an altered sense of belonging and social isolation and is associated with poorer clinical outcomes. Yet, mechanistic operationalizations of social anhedonia are lacking, limiting our understanding of the relationship between these mechanisms and affective symptoms. To address these questions, we developed a social reward exploration task which was administered to a transdiagnostic sample of trauma-exposed Veterans (N = 33) while they underwent functional magnetic resonance imaging. The goal was to maximize compliments from two unknown partners, as participants were told these partners selected compliments based on seeing their picture. A Bayesian reinforcement learning modeling approach was used to extract cognitive and neural markers of compliment (reward) exploration. To address these questions, we developed a social reward exploration task which was administered to a transdiagnostic sample of trauma-exposed Veterans (N = 33) while they underwent functional magnetic resonance imaging. The goal was to maximize compliments from two unknown partners, as participants were told these partners selected compliments based on seeing their picture. A Bayesian reinforcement learning modeling approach was used to extract cognitive and neural markers of compliment (reward) exploration. Higher social connectedness (β = 0.51; 95 % CI=[0.11,0.94]) and anxiety (β = 0.57; 95 % CI=[0.13,1.00]) were independently associated with more model-based choices of the partner they anticipated to be most complimenting. In the dorsal anterior cingulate cortex (ACC; z = 3.89, p .001) and left inferior parietal lobule (z = 3.96, p .001), neural responses to reward prediction errors (RPE) were more positive in response to compliment relative to non-compliment outcomes. Greater positive RPE ACC activation was associated with lower anxiety (β = -0.51; 95 % CI=[-0.99,-0.10]. Computational approaches to social reinforcement learning can help identify important neurocognitive differences in social reward sensitivity among individuals with complex affective profiles, such as trauma-exposed individuals. Understanding these differences may help develop new prediction and treatment tools for social anhedonia.
Keywords: Anhedonia; Anxiety; Social anhedonia; Social connectedness; Social reinforcement learning.
Conflict of interest statement
The authors declare that they have no known competing financial interests or personal relationships that could have appeared to influence the work reported in this paper.
Figures


Similar articles
-
Sexual Harassment and Prevention Training.2024 Mar 29. In: StatPearls [Internet]. Treasure Island (FL): StatPearls Publishing; 2025 Jan–. 2024 Mar 29. In: StatPearls [Internet]. Treasure Island (FL): StatPearls Publishing; 2025 Jan–. PMID: 36508513 Free Books & Documents.
-
Signs and symptoms to determine if a patient presenting in primary care or hospital outpatient settings has COVID-19.Cochrane Database Syst Rev. 2022 May 20;5(5):CD013665. doi: 10.1002/14651858.CD013665.pub3. Cochrane Database Syst Rev. 2022. PMID: 35593186 Free PMC article.
-
Comparison of Two Modern Survival Prediction Tools, SORG-MLA and METSSS, in Patients With Symptomatic Long-bone Metastases Who Underwent Local Treatment With Surgery Followed by Radiotherapy and With Radiotherapy Alone.Clin Orthop Relat Res. 2024 Dec 1;482(12):2193-2208. doi: 10.1097/CORR.0000000000003185. Epub 2024 Jul 23. Clin Orthop Relat Res. 2024. PMID: 39051924
-
Short-Term Memory Impairment.2024 Jun 8. In: StatPearls [Internet]. Treasure Island (FL): StatPearls Publishing; 2025 Jan–. 2024 Jun 8. In: StatPearls [Internet]. Treasure Island (FL): StatPearls Publishing; 2025 Jan–. PMID: 31424720 Free Books & Documents.
-
The Black Book of Psychotropic Dosing and Monitoring.Psychopharmacol Bull. 2024 Jul 8;54(3):8-59. Psychopharmacol Bull. 2024. PMID: 38993656 Free PMC article. Review.
References
-
- Vinograd M., Stout D.M., Risbrough V.B. Anhedonia in posttraumatic stress disorder: prevalence, phenotypes, and neural circuitry. in: pizzagalli da, editor. anhedonia: preclinical, translational, and clinical integration. Cham: Springe Int Publ. 2022:185–199. doi: 10.1007/7854_2021_292. - DOI - PubMed
-
- Kashdan T.B., Elhai J.D., Frueh B.C. Anhedonia and emotional numbing in combat veterans with PTSD. Behav Res Ther. 2006;44(3):457–467. - PubMed
LinkOut - more resources
Full Text Sources