

Automatic photoacoustic monitoring of perinatal brain hypoxia with superior sagittal sinus detection
- PMID: 40655941
- PMCID: PMC12245645
- DOI: 10.1117/1.JBO.30.7.076004
Automatic photoacoustic monitoring of perinatal brain hypoxia with superior sagittal sinus detection
Abstract
Significance: Despite advances in perinatal medicine over decades, perinatal hypoxic-ischemic encephalopathy (HIE) remains a significant cause of fetal cerebral palsy and can lead to other severe medical sequelae or death. Therefore, it is highly desirable to effectively detect brain hypoxia during labor and postnatally for HIE management.
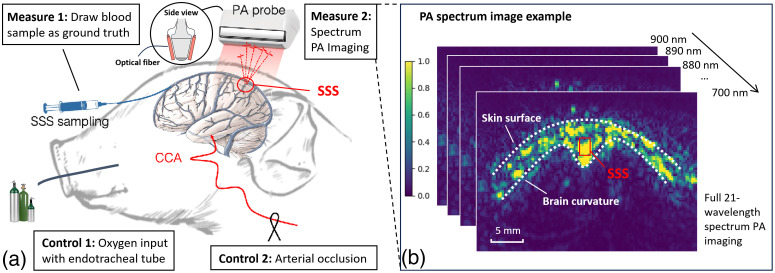
Aim: We recently validated the feasibility of transcranial photoacoustic (PA) imaging for oxyhemoglobin saturation measurement at the superior sagittal sinus ( ) in the neonatal piglet brain, at which overall oxygen supply status can be reflected as a primary collective vein. We aim to automate the PA-based workflow of at-risk subject detection and enable fully autonomous and continuous perinatal monitoring.
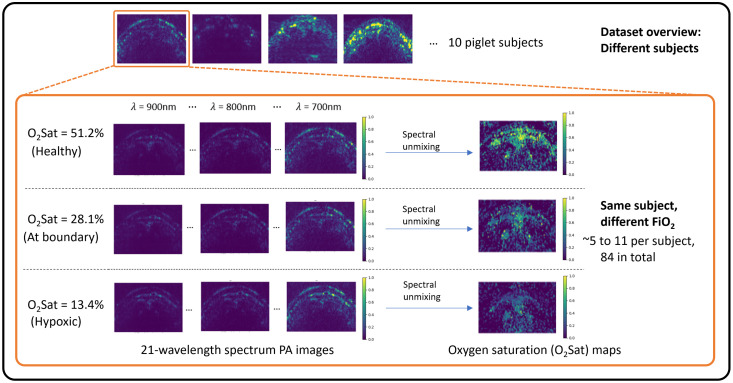
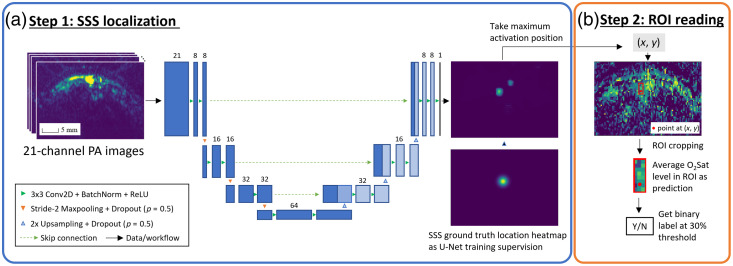
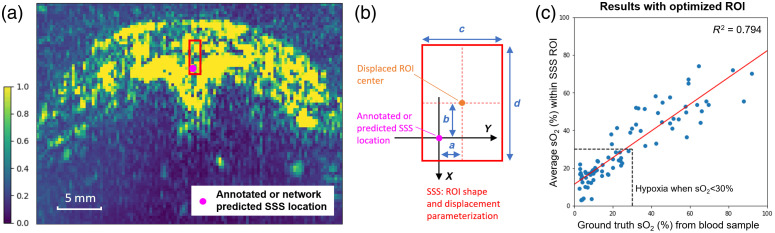
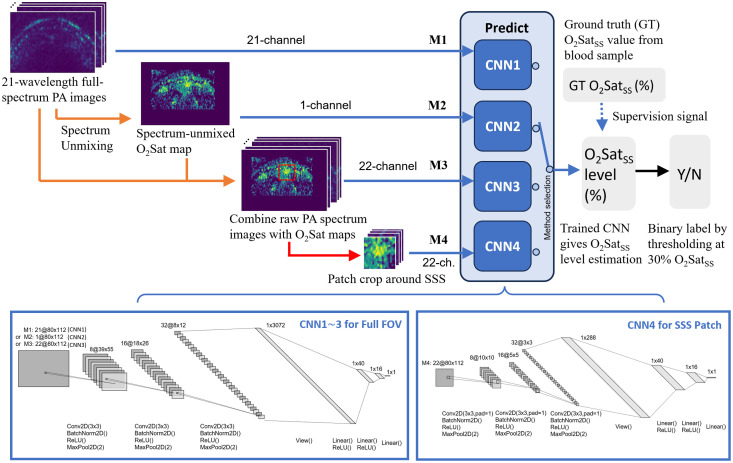
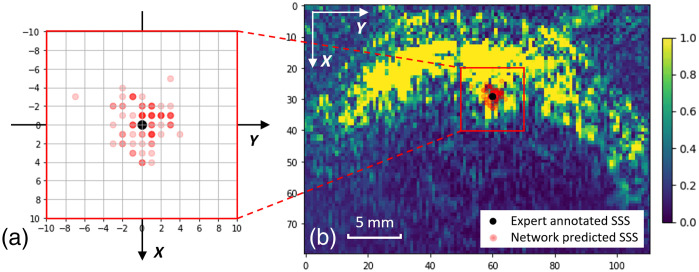
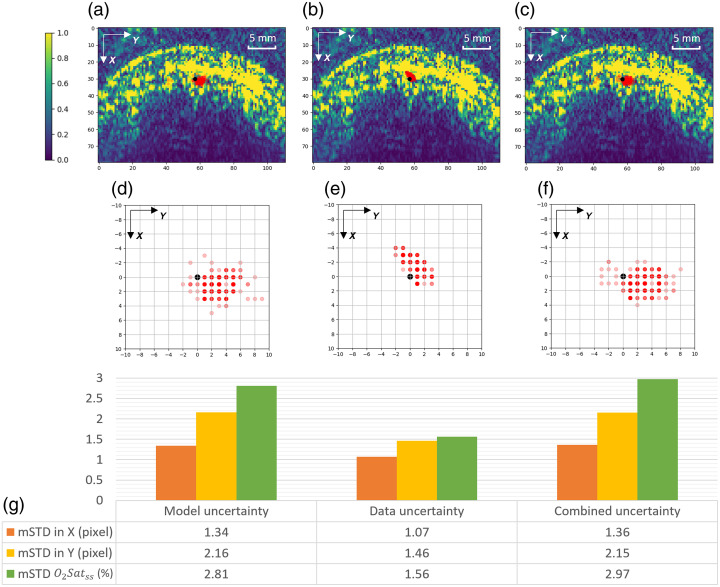
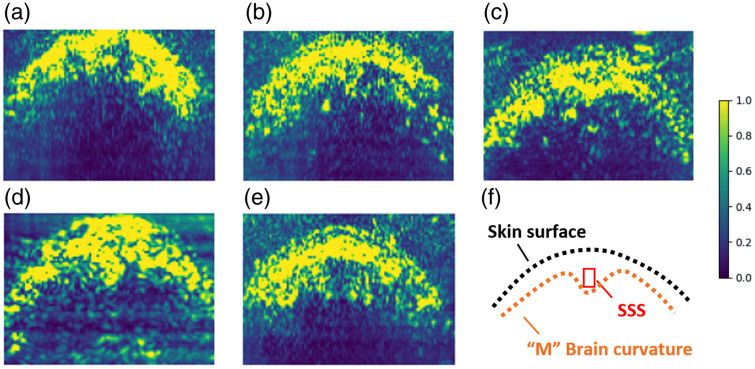
Approach: We proposed a two-step algorithm that focuses on the most informative region of the brain for oxygenation status, the superior sagittal sinus (SSS). First, a convolutional neural network (U-Net) is trained to detect the location of SSS in the coronal cross-section PA images. Then, an optimized region of interest patch around the predicted SSS location is cropped from the spectral unmixed image and averaged as the measurement. A confidence score can be computed for the measurement via Monte Carlo dropout (MCD), which infers the prediction uncertainty for better clinical decision-making.
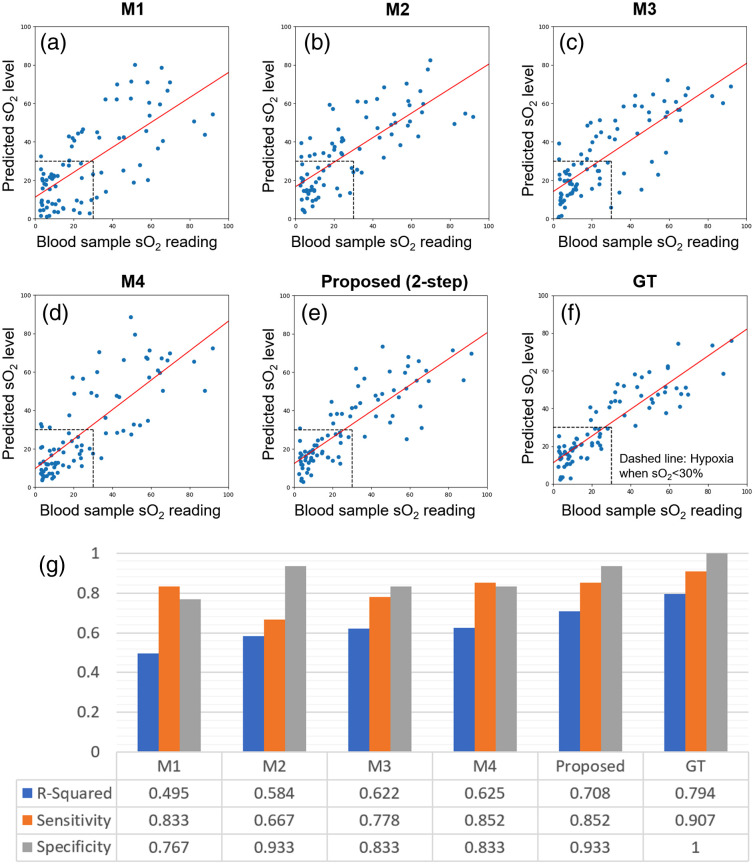
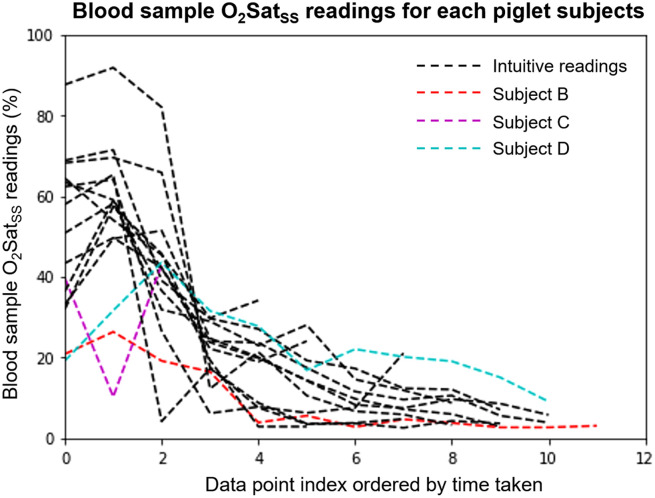
Results: The algorithm was evaluated on an in vivo piglet brain imaging dataset containing 84 independent experimental settings from 10 piglet subjects. A 10-fold leave-one-subject-out cross-validation experiment reports 85.2% sensitivity and 93.3% specificity for healthy/hypoxia classification with an -squared value of 0.708 and a confidence score of 94.06% based on MCD computation, well agreed with our ground-truth given by blood gas measurements.
Conclusions: The proposed automatic monitoring solution demonstrated a hypoxia detection capability comparable to the human expert manual annotation on the same task. We concluded with high feasibility for a noninvasive PA-based continuous monitoring of the perinatal brain.
Keywords: brain monitoring; deep learning; oxygen saturation measurement; perinatal health; photoacoustic imaging.
© 2025 The Authors.
Figures
Similar articles
-
Comparison of Two Modern Survival Prediction Tools, SORG-MLA and METSSS, in Patients With Symptomatic Long-bone Metastases Who Underwent Local Treatment With Surgery Followed by Radiotherapy and With Radiotherapy Alone.Clin Orthop Relat Res. 2024 Dec 1;482(12):2193-2208. doi: 10.1097/CORR.0000000000003185. Epub 2024 Jul 23. Clin Orthop Relat Res. 2024. PMID: 39051924
-
Continuous cardiotocography (CTG) as a form of electronic fetal monitoring (EFM) for fetal assessment during labour.Cochrane Database Syst Rev. 2017 Feb 3;2(2):CD006066. doi: 10.1002/14651858.CD006066.pub3. Cochrane Database Syst Rev. 2017. PMID: 28157275 Free PMC article.
-
The Perinatal Committee report: Review of the progress of obstetric healthcare in Japan.J Obstet Gynaecol Res. 2025 Jul;51(7):e16354. doi: 10.1111/jog.16354. J Obstet Gynaecol Res. 2025. PMID: 40690975 Free PMC article. Review.
-
Reduction of photobleaching effects in photoacoustic imaging using noise agnostic, platform-flexible deep-learning methods.J Biomed Opt. 2025 Dec;30(Suppl 3):S34102. doi: 10.1117/1.JBO.30.S3.S34102. Epub 2025 May 28. J Biomed Opt. 2025. PMID: 40443946 Free PMC article.
-
Sexual Harassment and Prevention Training.2024 Mar 29. In: StatPearls [Internet]. Treasure Island (FL): StatPearls Publishing; 2025 Jan–. 2024 Mar 29. In: StatPearls [Internet]. Treasure Island (FL): StatPearls Publishing; 2025 Jan–. PMID: 36508513 Free Books & Documents.
References
Publication types
MeSH terms
Grants and funding
LinkOut - more resources
Full Text Sources
