. 2025 Jun 27:13:1579121.
doi: 10.3389/fcell.2025.1579121. eCollection 2025.

Single-cell analysis reveals the spatiotemporal effects of long-term electromagnetic field exposure on the liver

Affiliations

Single-cell analysis reveals the spatiotemporal effects of long-term electromagnetic field exposure on the liver

Mingming Zhang et al. Front Cell Dev Biol. .

Abstract

Introduction: Artificial electromagnetic fields (EMFs) can impair the functions of several organs. The impact of long-term artificial EMF on the liver, the synthetic and metabolic center of the body, has become concerning. The aim of this study was to systematically evaluate the effect of long-term EMF exposure on the liver.

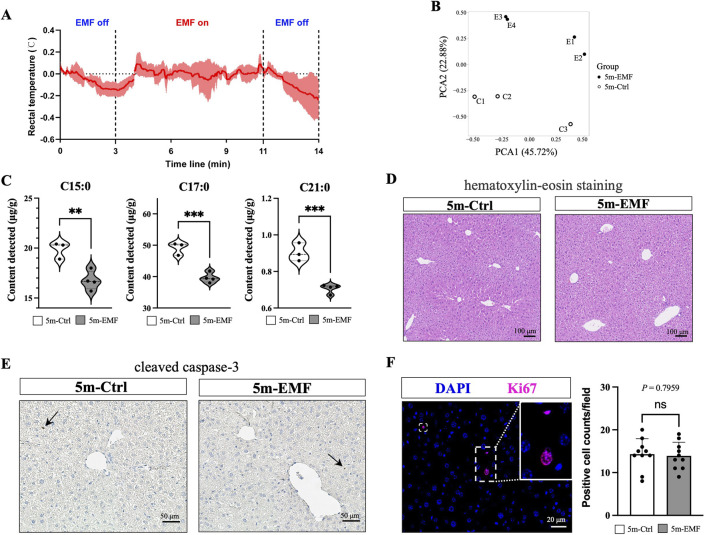
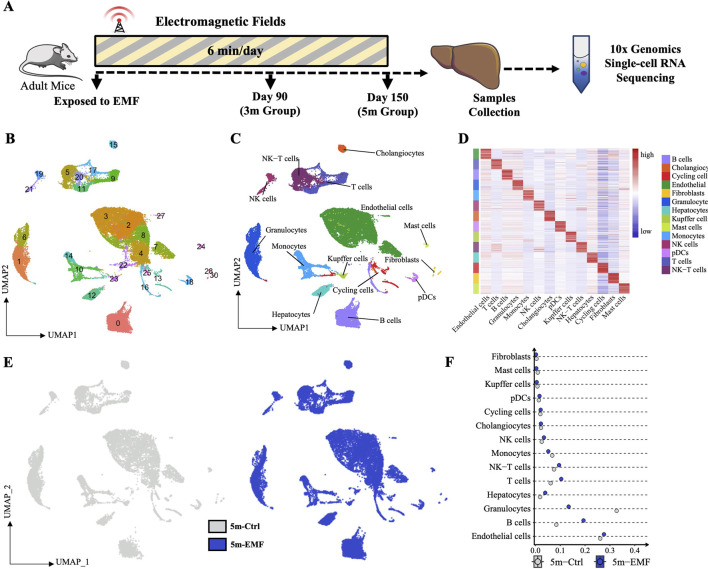
Methods: Mice were exposed to 2.45 GHz EMF daily for up to 5 months, and serum liver function test, lipidomic analysis, and histological analysis were performed to detect the general impact of EMF on the liver. Furthermore, EMF-induced liver transcriptome variations were investigated using single-cell RNA sequencing and a spatiotemporally resolved analysis.

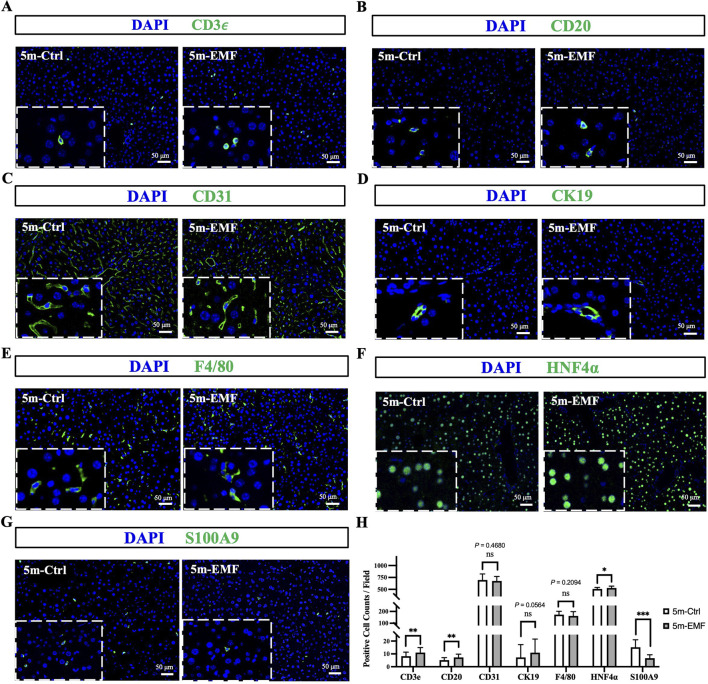
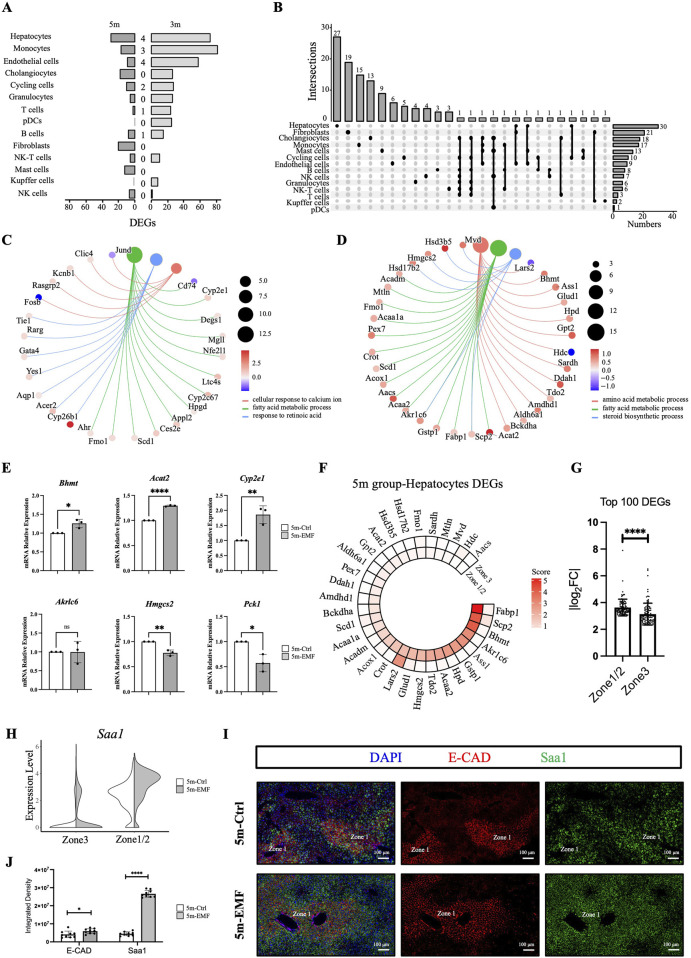
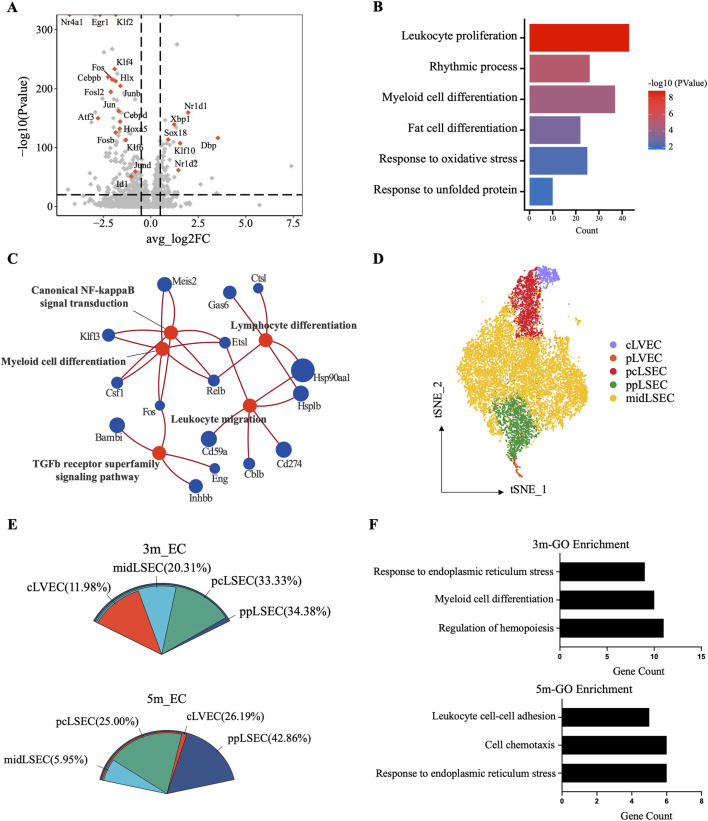
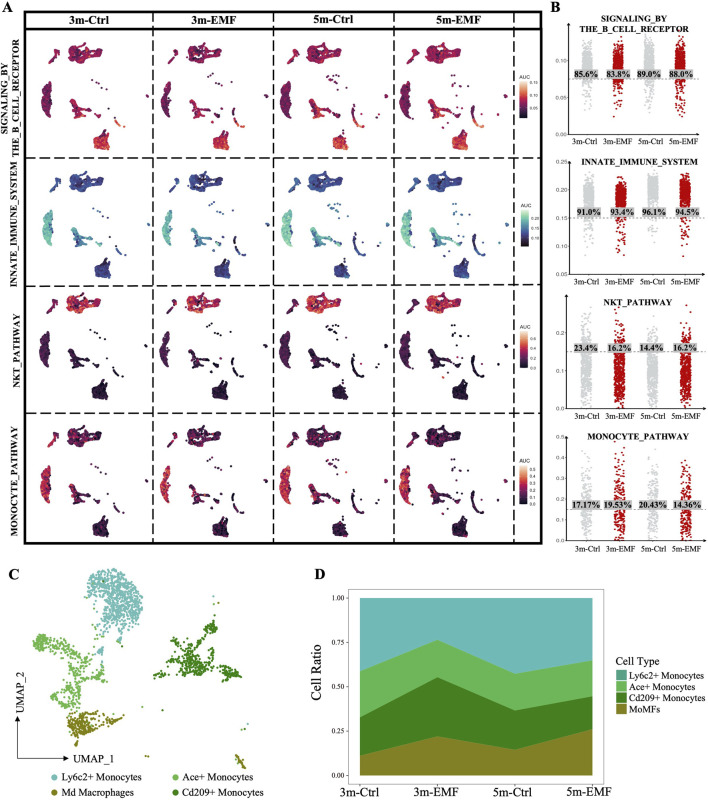
Results: Different hepatic cells exhibited diverse sensitivities and response patterns. Notably, hepatocytes, endothelial cells, and monocytes showed higher sensitivity to electromagnetic radiation, with their lipid metabolic functions, immune regulation functions, and intrinsic functions disturbed, respectively. Moreover, transcriptomic alterations were predominantly observed in the hepatocytes and endothelial cells in peri-portal regions, suggesting a zonation-related sensitivity to EMF within the liver.

Conclusion: Our study provided a spatiotemporal visualization of EMF-induced alterations in hepatic cells, which ultimately elucidated the biological effects of EMF exposure.

Keywords: electromagnetic field; hepatic zonation; liver function; single-cell analysis; single-cell transcriptome.


Conflict of interest statement

The authors declare that the research was conducted in the absence of any commercial or financial relationships that could be construed as a potential conflict of interest.

Figures

FIGURE 1
FIGURE 1
Functional and histological assessment of the murine liver after 5-month exposure to 2.45 GHz electromagnetic field (EMF). (A) Rectal temperature measurements of mice over a 14-min period, covering periods when EMF was off and on. (B) PCA analysis of liver tissue samples from 5m-Ctrl and 5m-EMF-exposed mice. (C) Contents of C15:0 (pentadecylic acid), C17:0 (margaric acid), and C21:0 (heneicosylic acid) in liver tissues (n = 4). (D) Representative images of H&E staining in liver tissues from 5m-Ctrl and 5m-EMF-exposed mice. Scale bars: 100 μm. (E) Immunohistochemical staining for cleaved caspase-3. Scale bars: 50 μm. (F) Immunofluorescence staining for Ki67 and quantification of Ki67-positive cells (n = 3, 10 fields per section). Scale bars: 20 μm. Values are presented as mean ± SD, and comparisons were made between 5m-Ctrl and 5m-EMF group. ns = not significant, n = replicates. Statistical significance is indicated as follows: *, P < 0.05, **, P < 0.01, ***, P < 0.001. All tests were two-tailed.
FIGURE 2
FIGURE 2
Single-cell transcriptomics of hepatic cells after EMF exposure. (A) Experimental design of the single-cell study. Mice were irradiated daily, and liver samples for scRNA-seq were collected on days 90 (3m group) and 150 (5m group). (B) UMAP visualization of cell distribution across the different groups, with cells colored by their recognized clusters. (C) UMAP plots of hepatic cells, visualizing 14 identified cell types. (D) Heatmap of the top 20 differentially expressed genes (DEGs) distinguishing individual cell types. (E) UMAP plots showing no significant cell type loss between the Ctrl and EMF groups. (F) Proportion of identified cell types of each condition in 5m group. pDCs: plasmacytoid dendritic cells.
FIGURE 3
FIGURE 3
Immunofluorescence staining of key liver cell markers in 5m-Ctrl and 5m-EMF groups. (A–G) Representative immunofluorescence images for CD3e (T cells), CD20 (B cells), CD31 (endothelial cells), CK19 (cholangiocytes), F4/80 (Kupffer cells), HNF4α (hepatocytes), and S100A9 (granulocytes). (H) Quantification of positive cells per field. Scale bars: 50 μm. The data that follows a normal distribution were analyzed using an independent t-test, while non-normally distributed data were analyzed using the Mann-Whitney U test. Values are presented as mean ± SE, and comparisons were made between 5m-Ctrl and 5m-EMF group. ns = not significant. Statistical significance is indicated as follows: *, P < 0.05, ***, P < 0.001. All tests were two-tailed.
FIGURE 4
FIGURE 4
EMF-induced transcriptome alterations across hepatic cell populations and zonation. (A) Numbers of significant DEGs (|log2FC| > 0.5 and adj. p < 0.05) of 14 populations and intersections between the 3m and 5m groups. (B) UpSet plot showing the significant DEGs of 14 populations in the 5m group, with the number of cell type-unique DEGs labeled at the top. (C,D) Cnetplots illustrating the affected biological processes and related DEGs identified by GO analysis in hepatocytes from the 3m group (C) and the 5m group (D). Color map represents log2FC (log2 fold change). (E) Expression of Bhmt, Acat2, Cyp2e1, Akr1c6, Hmgcs2, and Pck1 in liver tissues measured by qPCR. (F) Circle heatmaps showing the average expression of the pathway-enriched differentially expressed genes (DEGs) in hepatocytes from the 5m group. (G) Zonation distribution analysis of the top 100 DEGs (ranked by absolute log2FC) in the 5m groups. Each dot in the bar plot represents an individual DEG. (H) Violin plot of Saa1 expression in zonation-defined hepatocytes in the 5m groups. (I) Representative images of Saa1 (green) and E-cadherin (E-CAD, red) staining in liver sections from the 5m group. Saa1 expression was detected by RNA in situ hybridization, E-CAD was stained by antibody. Scale bars: 100 μm. (J) Quantitative analysis of the fluorescence density for Saa1 and E-cadherin between 5m-Ctrl and 5m-EMF group (n = 3 mice per group). Values are presented as mean ± SD. Statistical significance is indicated as follows: *, P < 0.05, **, P < 0.01, **** P < 0.0001, ns = not significant.
FIGURE 5
FIGURE 5
Single-cell transcriptomic analysis of the endothelial cell responses to EMF. (A) Volcano plot showing significant DEGs of endothelial cells between exposed and control mice in the 3m group. Colored dots denote transcription factor (TF)-coding genes. (B) Barplot illustrating the affected biological processes in liver endothelial cells after 3-month exposure. (C) Enrichment analysis of the DEGs with the GO pathways database in the 5m group. (D) t-SNE plot of the zonation-annotated endothelial cells, with colored dots denoting cells from each zonation. (E) Proportional distribution of DEGs in region-annotated endothelial subclusters from the 3m and 5m groups. (F) Enriched GO terms (p < 0.05) of DEGs derived from ppLSEC subclusters.
FIGURE 6
FIGURE 6
Assessment of the EMF-induced functional alterations in immune cells. (A) AUCell scores of the curated pathways were visualized on UMAPs, highlighting functional alterations in immune cells in response to EMF exposure. (B) Columnar scatter plots showing the distribution of AUCell scores across the 3m-Ctrl, 3m-EMF, 5m-Ctrl, and 5m-EMF groups. The percentage of cells with scores higher than the median is labeled. (C) UMAP visualization of the four identified monocyte subclusters, with different subclusters colored distinctively. (D) Proportional distribution of monocyte subclusters in each group.

Similar articles

References

    1. Alkis M. E., Akdag M. Z., Dasdag S. (2021). Effects of low‐intensity microwave radiation on oxidant‐antioxidant parameters and DNA damage in the liver of rats. Bioelectromagnetics 42, 76–85. 10.1002/bem.22315 - DOI - PubMed
    1. Boyette L. B., Macedo C., Hadi K., Elinoff B. D., Walters J. T., Ramaswami B., et al. (2017). Phenotype, function, and differentiation potential of human monocyte subsets. PLoS One 12, e0176460. 10.1371/journal.pone.0176460 - DOI - PMC - PubMed
    1. Busljeta I., Trosic I., Milkovic-Kraus S. (2004). Erythropoietic changes in rats after 2.45 GJz nonthermal irradiation. Int. J. Hyg. Environ. Health 207, 549–554. 10.1078/1438-4639-00326 - DOI - PubMed
    1. Çelik Ö., Kahya M. C., Nazıroğlu M. (2016). Oxidative stress of brain and liver is increased by Wi-Fi (2.45GHz) exposure of rats during pregnancy and the development of newborns. J. Chem. Neuroanat. 75, 134–139. 10.1016/j.jchemneu.2015.10.005 - DOI - PubMed
    1. Chembazhi U. V., Bangru S., Hernaez M., Kalsotra A. (2021). Cellular plasticity balances the metabolic and proliferation dynamics of a regenerating liver. Genome Res. 31, 576–591. 10.1101/gr.267013.120 - DOI - PMC - PubMed

LinkOut - more resources