. 2023 Apr 19:2:101126.
doi: 10.1016/j.nsa.2023.101126. eCollection 2023.

GPR101 loss promotes insulin resistance and diet-induced obesity risk

Affiliations

GPR101 loss promotes insulin resistance and diet-induced obesity risk

Lillian Garrett et al. Neurosci Appl. .

Abstract

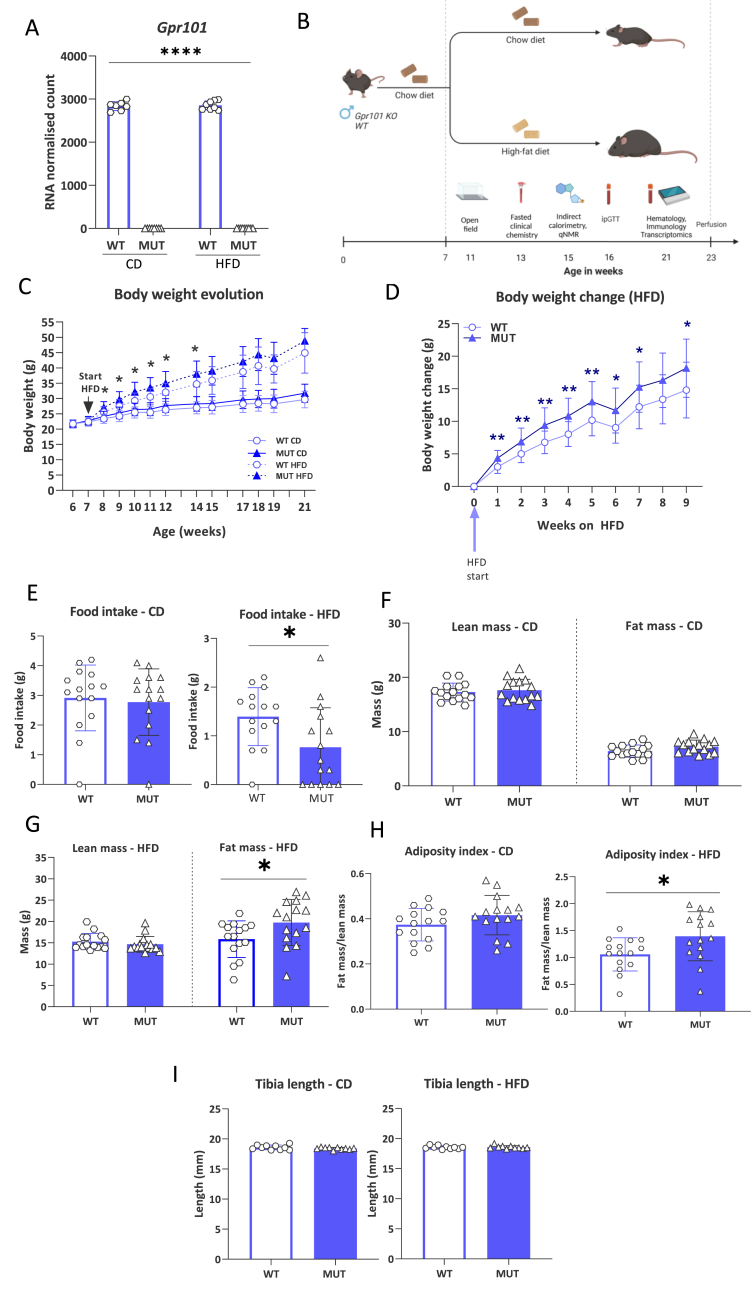
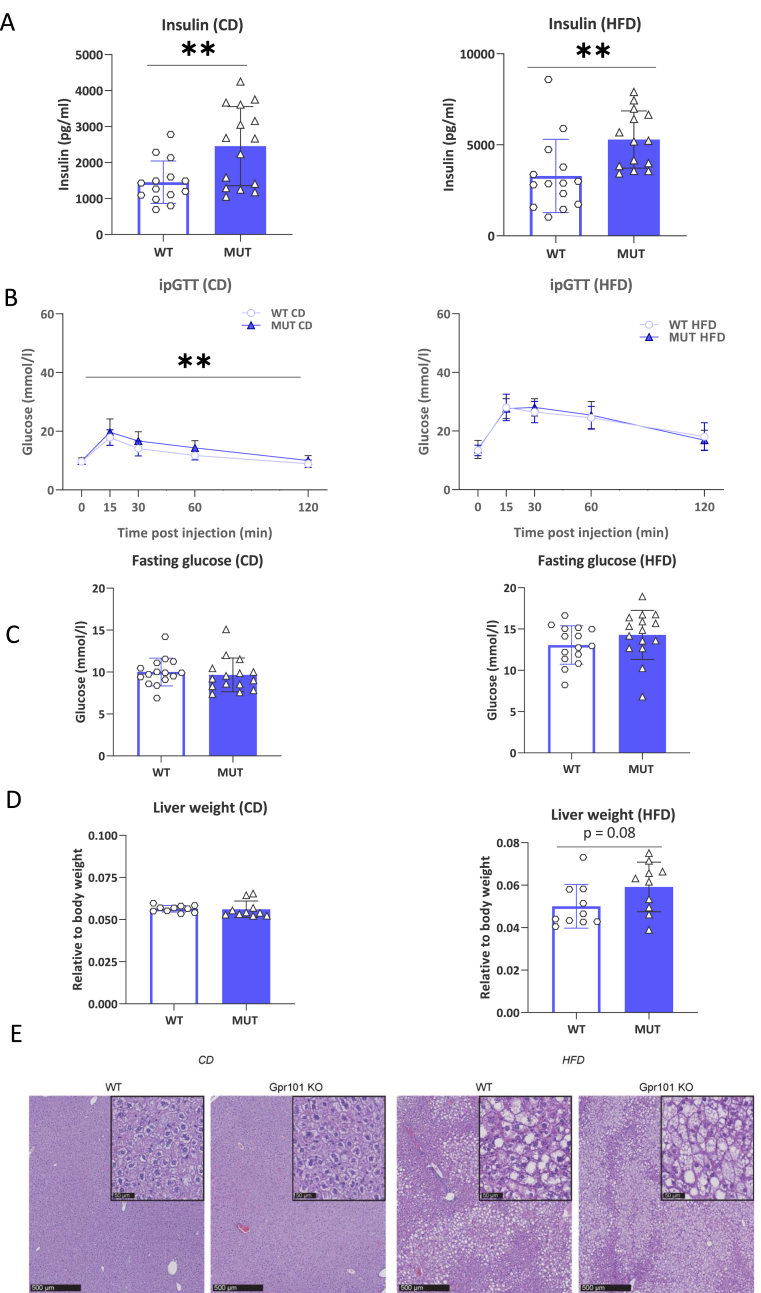
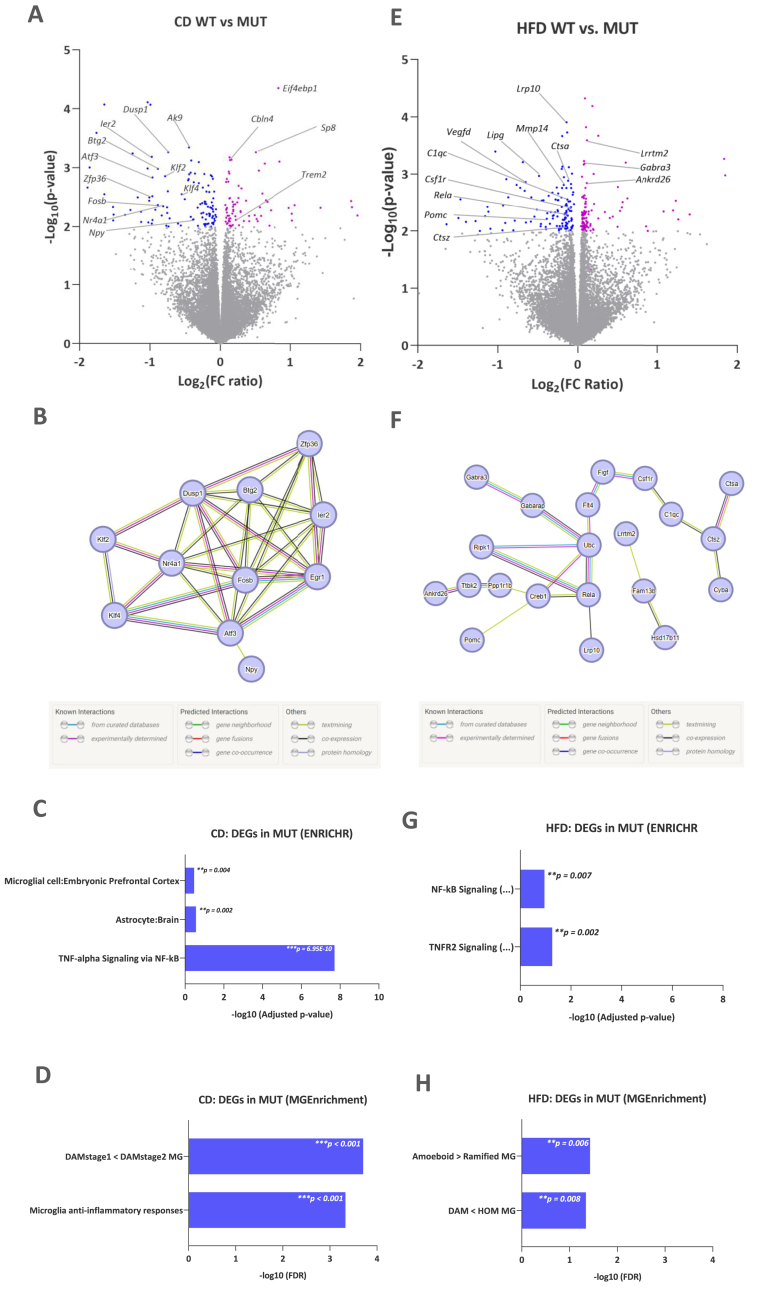
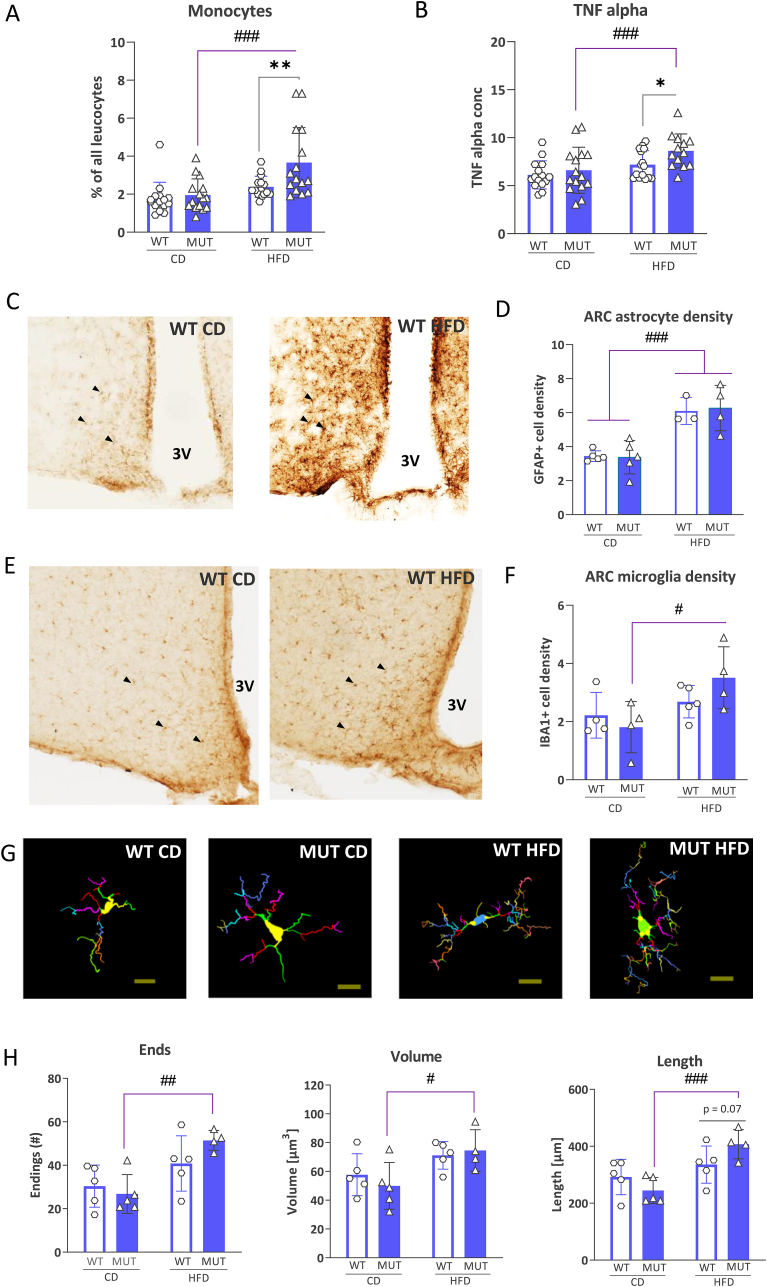
G-protein-coupled receptors (GPCRs) represent targets for improved low-side-effect therapies to tackle the evolving Western obesity epidemic. The orphan (o) GPCR GPR101 emerged as an attractive candidate in this regard. Expressed on cells in brain areas regulating energy homeostasis, including the hunger-suppressing proopiomelanocortin (POMC) ​+ ​neurons, it is minimally expressed outside the brain. To understand the function of this receptor in vivo, we herein generated and comprehensively characterized a Gpr101 knockout mouse line, either under standard feeding conditions or with chronic high-fat diet (HFD) access (16 weeks). GPR101 loss accelerated the risk for diet-induced obesity (DIO), hyperinsulinemia and disrupted glucose homeostasis. Hypothalamic transcriptomic analysis revealed also decreased Pomc activation with HFD suggesting impaired hunger suppression. Moreover, on a standard diet, there was a molecular signature of downregulated tristetraprolin (TTP) interactome gene activation suggesting impaired inflammation resolution. On HFD, there was differential expression of genes involved in microglial phagocytosis and lipid metabolism. Morphometry revealed altered hypothalamic arcuate nucleus microglial morphology consistent with the transcriptomic profile. We discuss how the GPR101 specialized pro-resolving mediator (SPM) receptor capacity likely underlies the aberrant microglial function and contributes to DIO risk. Thus, this evidence shows that GPR101 is a potential therapeutic target for DIO through, among other factors, effects on hypothalamic inflammation resolution.

Keywords: Diet-induced obesity; GPR101; Hypothalamus; Inflammation; Insulin resistance.


Conflict of interest statement

AB and TZ are employees of Boehringer Ingelheim Pharma GmbH & Co. KG. AB and TZ declare no competing financial interest in this work.The authors declare the following financial interests/personal relationships which may be considered as potential competing interests: Martin Hrabe de Angelis reports was provided by 10.13039/501100002347German Federal Ministry of Education and Research (Infrafrontier grant 01KX1012).

Figures

Fig. 1
Fig. 1
Loss of Gpr101 increased susceptibility to diet-induced obesity (DIO) on high-fat diet (HFD). Transcriptomic analysis of the hypothalamus revealed clear loss of Gpr101 (A) in the mutant mice (MUT) compared to wildtype controls (WT) regardless of feeding with chow diet (CD) or HFD. ∗∗∗∗p<0.0001 genotype effect in 2-way ANOVA. (B) The experimental design overview with the age at which the mice received HFD and the different assays performed (generated at www.biorender.com). WT and MUT mice consumed a 60% kcal HFD from the age of 7 weeks with a WT and MUT group remaining on CD. The body weight evolution over time for CD- and HFD-fed mice is shown in (C). The body weight change during initial weeks on HFD compared to starting body weight is displayed in (D). The food intake as measured during indirect calorimetry analysis at 15 weeks (E). The fat (F) and lean (G) mass were measured at the age of 15 weeks (8 weeks of HFD) as well as the adiposity index of fat mass (FM) in ratio to lean mass (LM) (H). The tibia length measurements are shown in (I). ∗p<0.05, ∗∗p<0.01, ∗∗∗∗p<0.0001 WT vs. MUT. N ​= ​15 per group for all measurements except n ​= ​10 per group for tibia length.
Fig. 2
Fig. 2
Loss of Gpr101 increased insulin resistance risk and impaired glucose clearance. Circulating plasma insulin levels of Gpr101 (MUT) with high-fat diet (HFD) and without (CD – chow diet) compared to wildtype controls (WT) n ​= ​14 WT (CD, HFD), n ​= ​15/14 MUT (CD/HFD) (A). Glucose levels during the intraperitoneal glucose tolerance test (ipGTT), used to assess glucose clearance after i. p. injection of a glucose bolus n ​= ​15 per group (B). The fasting glucose levels are shown n ​= ​15 per group (C). Body weight normalized liver weight (D) and hematoxylin and eosin stained liver sections n ​= ​10 per group (E). ∗∗p ​< ​0.01, MUT vs. WT.
Fig. 3
Fig. 3
GPR101 loss induced aberrant hypothalamic expression of inflammation, microglial and feeding-related genes with and without high-fat diet challenge. Transcriptomic analysis of hypothalamus revealed differentially expressed genes (DEGs) from Gpr101 knockout (“MUT”) and control (“WT”) mice on either standard chow-diet (CD) or 60% kcal high-fat diet (HFD) from 21-week old mice after 15 weeks HFD. (A) Volcano plot showing significantly (p ​< ​0.01) up- (magenta points) and down- (blue points) regulated genes in MUT vs. WT mice on CD (FC ​= ​fold change). (B) A STRING (Search Tool for the Retrieval of Interacting Genes/Proteins) predicted functional association network DEGs in MUT mice on CD with the main evidence for protein-protein interactions (PPIs) depicted. The legend (taken from string-db.org) is also shown. Each node is representative of all proteins produced by a protein coding gene. The edges indicate protein-protein associations with shared functions. Magenta- and cyan-colored edges are established interactions and the remainder are predicted interactions. There was a significant PPI network for the ZFP36/Tristetraprolin (TTP) protein (related nodes highlighted in purple), the downregulation of which is associated with increased inflammation. Depicted are selected significant terms from the enrichment analysis of the MUT DEGs on CD using the Enrichr platform accessing different databases (https://maayanlab.cloud/Enrichr/) (C) and with the microglia-specific MGEnrichment analysis tool (https://ciernialab.shinyapps.io/MGEnrichmentApp/) (D). (E-H) Volcano plot, STRING, ENRICHR and MGEnrichment analysis of MUT DEGs on HFD. There was differential regulation of genes involved in glutamatergic (Lrrtm2) and GABAergic (Gabra3) signaling, appetite (Ankrd26, Pomc), inflammation and microglia (Rela, Csf1r, C1qc, Ubc, Ripk1), endothelial cell signaling (Vegfd (Figf), Vegfr3 (Flt4)), phagocytosis (Gabarap, Cyba) and lipid metabolism (Lrp10). Selected significant enriched terms from the enrichment analysis with Enrichr and MGEnrichment are shown. FDR ​= ​false discovery rate. The raw p values and significance are depicted in the respective bar. ∗p<0.05, ∗∗p<0.01, ∗∗∗p <0.001. (For interpretation of the references to color in this figure legend, the reader is referred to the Web version of this article.)
Fig. 4
Fig. 4
GPR101 loss altered innate immune response markers and hypothalamic microglial morphology with high-fat diet (HFD) feeding. (A) Graph shows circulating monocytes in HFD-fed Gpr101 knockout (KO or “MUT”) mice compared to both HFD-fed wildtype (“WT” and chow diet (CD)-fed MUT. Circulating tumor necrosis factor (TNF)-alpha, the proinflammatory cytokine, produced by monocytes/macrophages levels measured (B). (C) Representative photomicrographs of the astrocyte marker, glial fibrillary acidic protein (GFAP), immune-staining patterns in WT CD and HFD fed mice. (D) The cell density estimates of GFAP ​+ ​astrocyte cells with HFD consumption in the hypothalamic arcuate nucleus (ARC) (E) Representative photomicrographs of the Ionized calcium binding adaptor molecule 1 (IBA1)+ microglial marker immunostaining from WT CD and HFD fed mice. (F) The IBA1+ ​microglia cell density estimates in the ARC are shown. (G, H) Representative morphological tracing of ARC IBA1+ microglia from mice of each group and microglia volume, number of branch ends and branch length in MUT mice compared to CD-fed MUT mice (n ​= ​5 microglia analysed/mouse, n ​= ​5 mice/group for WT ​+ ​MUT CD, WT for HFD and n ​= ​4 mice/group for HFD MUT). Data comparisons with 2-way ANOVA with post-hoc LSD test. ∗p<0.05, ∗∗p<0.01 WT vs. MUT, #p<0.05, ##p<0.01, ###p<0.001 CD vs. HFD. 3V ​= ​third ventricle. Scale bar ​= ​10 ​mm. Black arrows highlight immuno-stained cells (astrocytes or microglia).

References

    1. Abboud D., Daly A.F., Dupuis N., Bahri M.A., Inoue A., Chevigne A., Ectors F., Plenevaux A., Pirotte B., Beckers A., Hanson J. GPR101 drives growth hormone hypersecretion and gigantism in mice via constitutive activation of Gs and Gq/11. Nat. Commun. 2020;11:4752. - PMC - PubMed
    1. Acs P., Bauer P.O., Mayer B., Bera T., Macallister R., Mezey E., Pastan I. A novel form of ciliopathy underlies hyperphagia and obesity in Ankrd26 knockout mice. Brain Struct. Funct. 2015;220:1511–1528. - PMC - PubMed
    1. Akiyama M., Okada Y., Kanai M., Takahashi A., Momozawa Y., Ikeda M., Iwata N., Ikegawa S., Hirata M., Matsuda K., Iwasaki M., Yamaji T., Sawada N., Hachiya T., Tanno K., Shimizu A., Hozawa A., Minegishi N., Tsugane S., Yamamoto M., Kubo M., Kamatani Y. Genome-wide association study identifies 112 new loci for body mass index in the Japanese population. Nat. Genet. 2017;49:1458–1467. - PubMed
    1. Atagi Y., Liu C.C., Painter M.M., Chen X.F., Verbeeck C., Zheng H., Li X., Rademakers R., Kang S.S., Xu H., Younkin S., Das P., Fryer J.D., Bu G. Apolipoprotein E is a ligand for triggering receptor expressed on myeloid cells 2 (TREM2) J. Biol. Chem. 2015;290:26043–26050. - PMC - PubMed
    1. Bagnol D. US Patent Office (USPTO), U.S. patent No; 2010. Use of gpr101 Receptor in Methods to Identify Modulators of Hypothalamic Proopiomelanocortin (POMC)-derived Biologically Active Peptide Secretion Useful in the Treatment of Pomc-Derived Biologically Active Peptide-Related Disorders; pp. 1–80. 2010.

LinkOut - more resources