

Case Report: Role of hypoglycemia in seizure aggravation in a case of focal epilepsy: revealing a missing link between diabetes and dementia
- PMID: 40656454
- PMCID: PMC12245777
- DOI: 10.3389/fnins.2025.1604552
Case Report: Role of hypoglycemia in seizure aggravation in a case of focal epilepsy: revealing a missing link between diabetes and dementia
Abstract
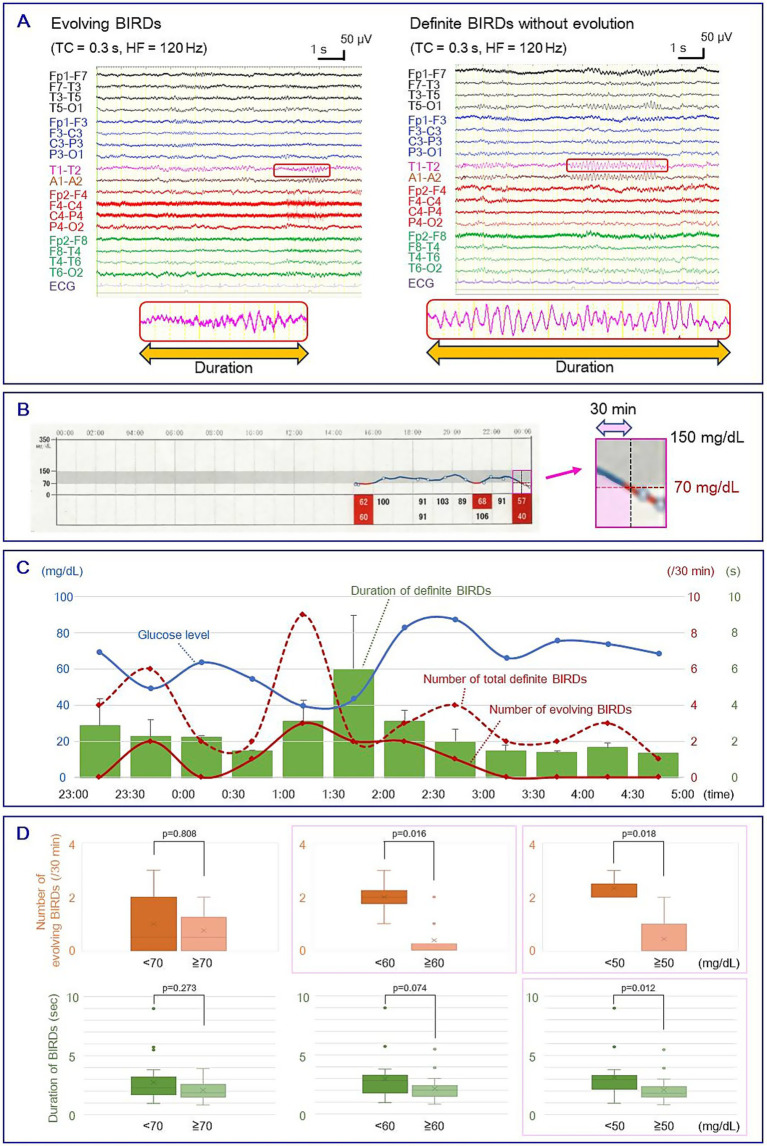
Aim: While low-frequency electroencephalographic (EEG) activity increases during hypoglycemia, the relationship between hypoglycemia and changes in epileptic activities has not been fully investigated. Recently, the American Clinical Neurophysiology Society's EEG Terminology 2021 defined criteria for Brief Potentially Ictal Rhythmic Discharges (BIRDs) including rhythmic fast activities. We evaluated the association between hypoglycemia and BIRDs.
Methods: Data from a 27-year-old female with focal epilepsy and idiopathic hypoglycemia, who underwent scalp-recorded long-term video-EEG using the International 10-20 system with T1/T2 electrodes, were analyzed. Her anti-neuronal antibody test results were negative. EEG recordings over 6 h were retrospectively evaluated in longitudinal bipolar montages at 15 s per display screen. The number and duration of BIRDs were assessed in each 30 min epoch. Glucose levels were obtained using a flash glucose monitoring system, and the average glucose level for each epoch was calculated using the area under the curve (AUC), measured by pixel-counting software. The relationship between the number and duration of BIRD subtypes and average glucose levels was evaluated using cut-off values of 70, 60, and 50 mg/dL.
Results: During the recording, the EEG showed focal slow activities, epileptic spikes, and BIRDs in the left temporal area, but no clinical or electrographic seizures were observed. The number of evolving BIRDs per epoch was significantly higher during more severe hypoglycemia when the cut-off values were set at 60 mg/dL (2.00 ± 0.71 vs. 0.38 ± 0.70, mean ± SD, p < 0.05, Mann-Whitney U test) and 50 mg/dL (2.33 ± 0.47 vs. 0.44 ± 0.68, p < 0.05). The total duration of definite BIRDs per epoch also showed a statistically significant difference when the cut-off was set at 50 mg/dL (3.15 ± 1.82 vs. 2.10 ± 1.00 s, p < 0.05).
Conclusion: Maintaining glucose levels above 60 mg/dL appears important for the early termination of epileptic rhythmic discharges. Individuals with diabetes are at high risk of Alzheimer's disease (AD), and hippocampal hyperactivity contributes to epileptic seizures, amyloid deposition, and disease progression. Fluctuations in blood glucose levels, including episodes of hypoglycemia, increase the risk of dementia. The present findings suggest a potential causative role of hypoglycemia in AD and propose a precise method to correlate glucose levels with brain activities.
Keywords: Alzheimer’s disease; Brief Potentially Ictal Rhythmic Discharges; electroencephalography; flash glucose monitoring; focal epilepsy; hypoglycemia; long-term video-electroencephalography monitoring; temporal lobe epilepsy.
Copyright © 2025 Ohara, Yamanaka, Inoue, Shimizu, Iguchi, Tanaka, Gopalakrishnan, Vellingiri and Kinoshita.
Conflict of interest statement
HO received honoraria from Otsuka Co., Ltd., Alexion Co., Ltd., UCB Japan Co., Ltd., Daiichi Sankyo Co., Ltd., Kyowa Kirin Co., Ltd., Tanabe Mitsubishi Co. Ltd., Sumitomo Pharma Co., Ltd., FP Pharma Co. Ltd., and Argenix Co. Ltd. MK received honoraria from Eisai Co., Ltd., Daiichi Sankyo Co., Ltd., and UCB Japan Co., Ltd. MK is an Associate Editor for Brain Imaging Methods (specialty sections of Frontiers in Neuroscience, Frontiers in Neurology, and Frontiers in Neuroimaging) and an Editorial Board Member for BMC Neurology and Clinical Neurophysiology. The remaining authors declare that the research was conducted in the absence of any commercial or financial relationships that could be construed as a potential conflict of interest. The author(s) declared that they were an editorial board member of Frontiers, at the time of submission. This had no impact on the peer review process and the final decision.
Figures
References
-
- Alkabbani W., Maxwell C. J., Marrie R. A., Tyas S. L., Lega I. C., Gamble J. M. (2023). Associations of mid- and late-life severe hypoglycemic episodes with incident dementia among patients with type 2 diabetes: a population-based cohort study. Diabetes Care 46, 331–340. doi: 10.2337/dc22-1496, PMID: - DOI - PubMed
Publication types
LinkOut - more resources
Full Text Sources