. 2025 Jul 7;31(25):107478.
doi: 10.3748/wjg.v31.i25.107478.

Deciphering lactate metabolism in colorectal cancer: Prognostic modeling, immune infiltration, and gene mutation insights

Affiliations

Deciphering lactate metabolism in colorectal cancer: Prognostic modeling, immune infiltration, and gene mutation insights

Xiao-Peng Wang et al. World J Gastroenterol. .

Abstract

Background: Colorectal cancer (CRC) remains a major global health burden due to its high incidence and mortality, with treatment efficacy often hindered by tumor heterogeneity, drug resistance, and a complex tumor microenvironment (TME). Lactate metabolism plays a pivotal role in reshaping the TME, promoting immune evasion and epithelial-mesenchymal transition, making it a promising target for novel therapeutic strategies and prognostic modeling in CRC.

Aim: To offer an in-depth analysis of the role of lactate metabolism in CRC, highlighting its significance in the TME and therapeutic response.

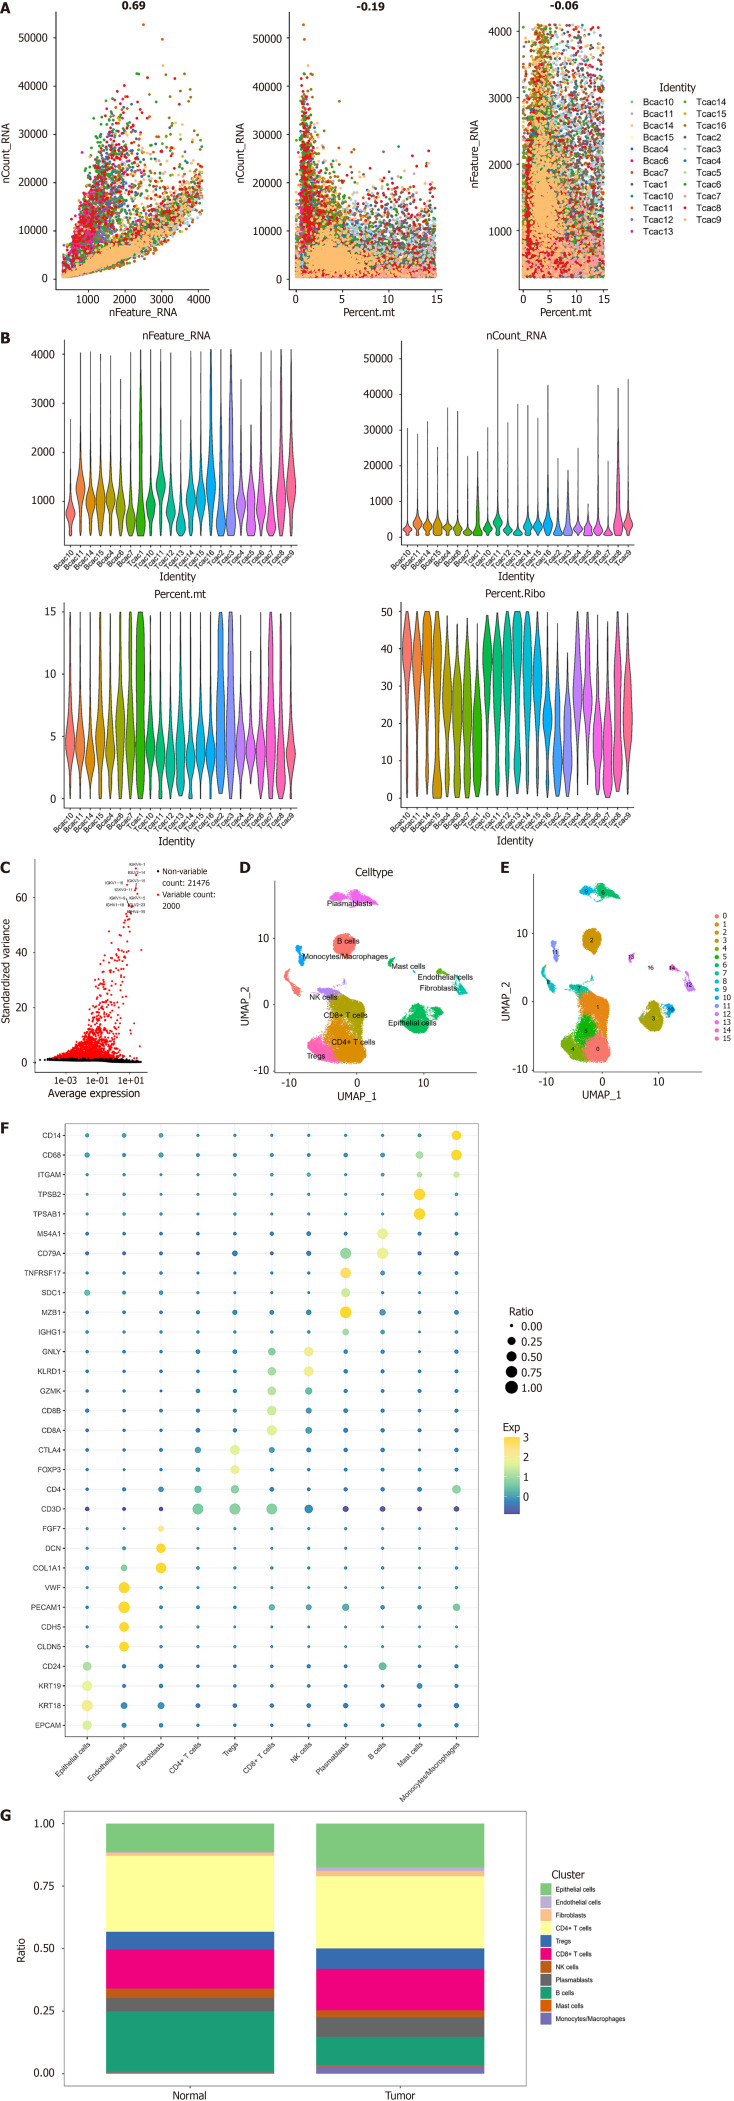
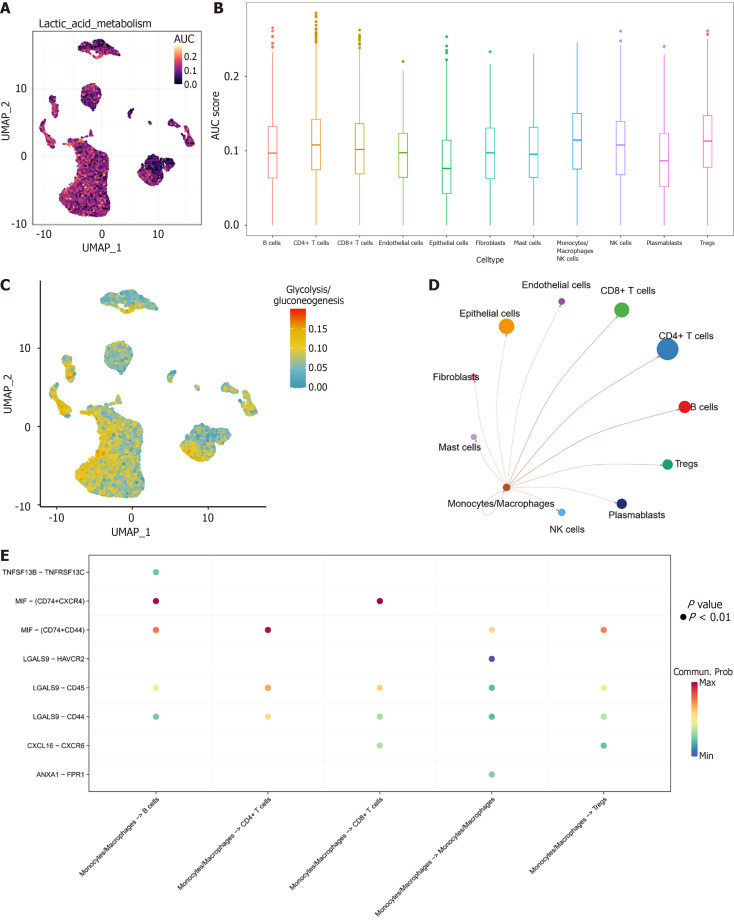
Methods: Utilizing single-cell and transcriptomic data from the Gene Expression Omnibus and The Cancer Genome Atlas, we identified key lactate metabolic activities, particularly in the monocyte/macrophage subpopulation.

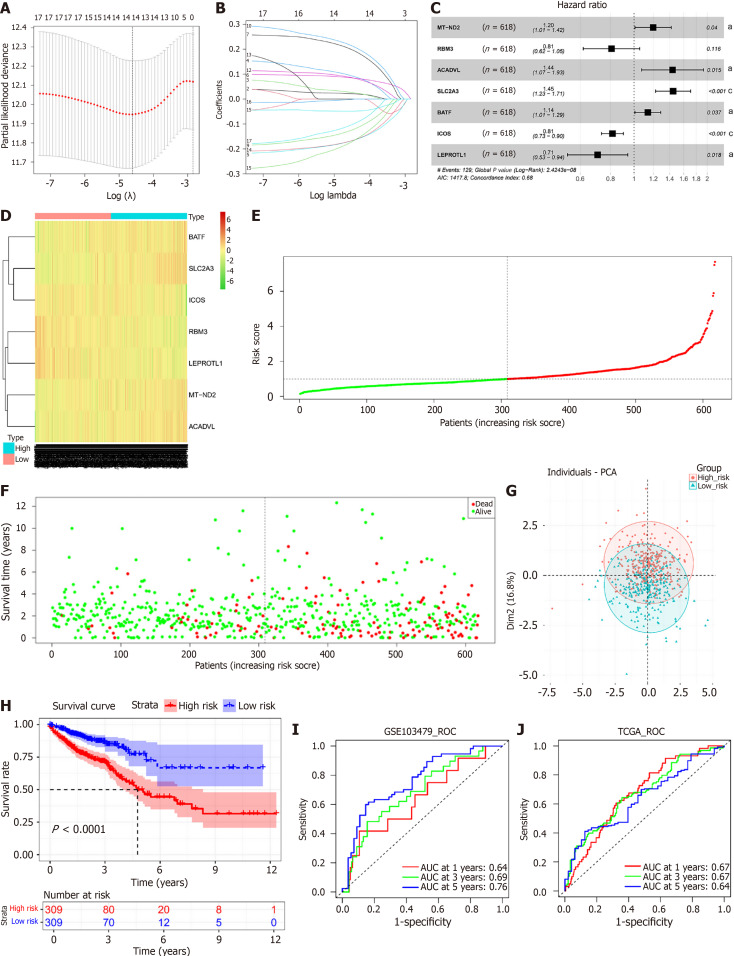
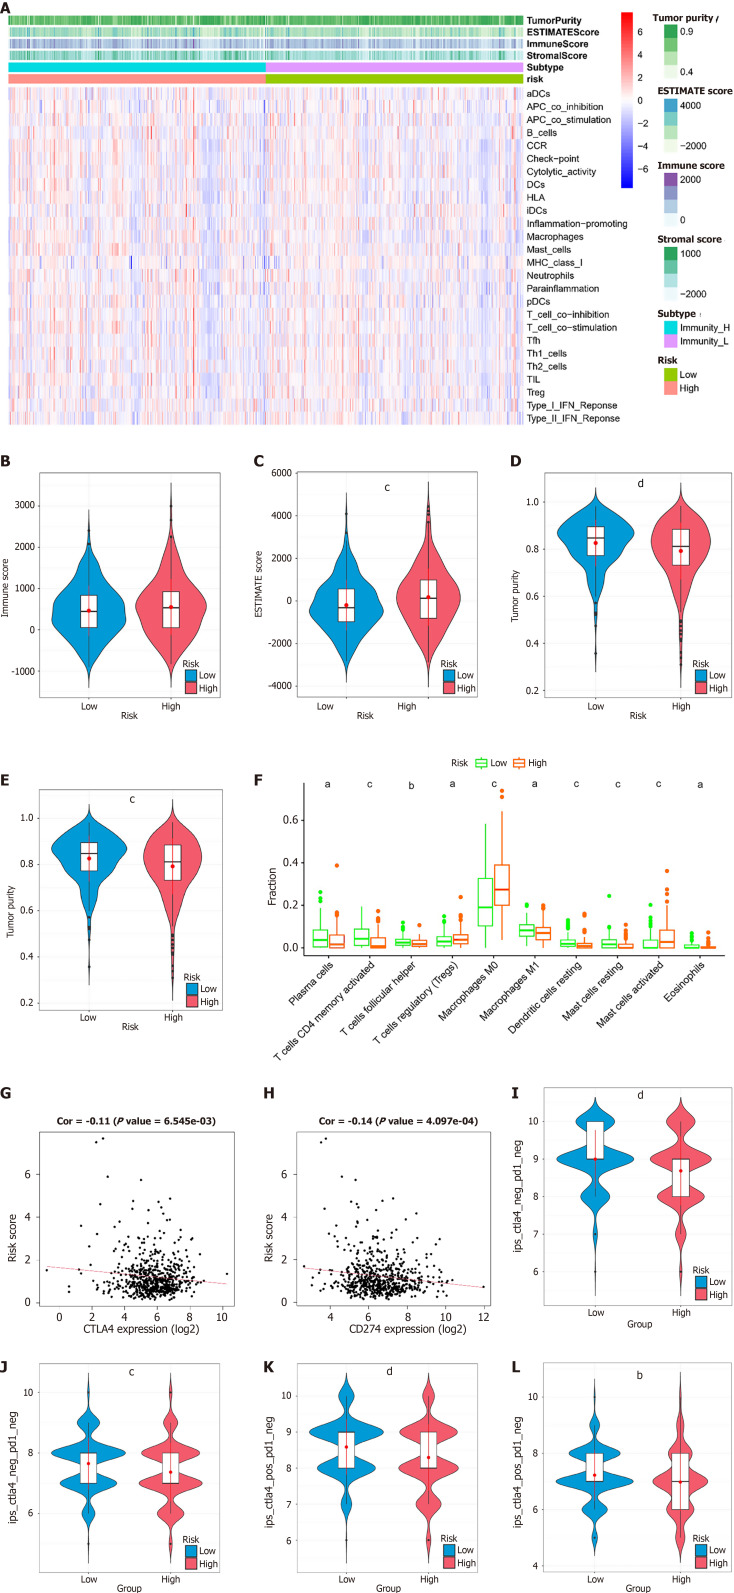
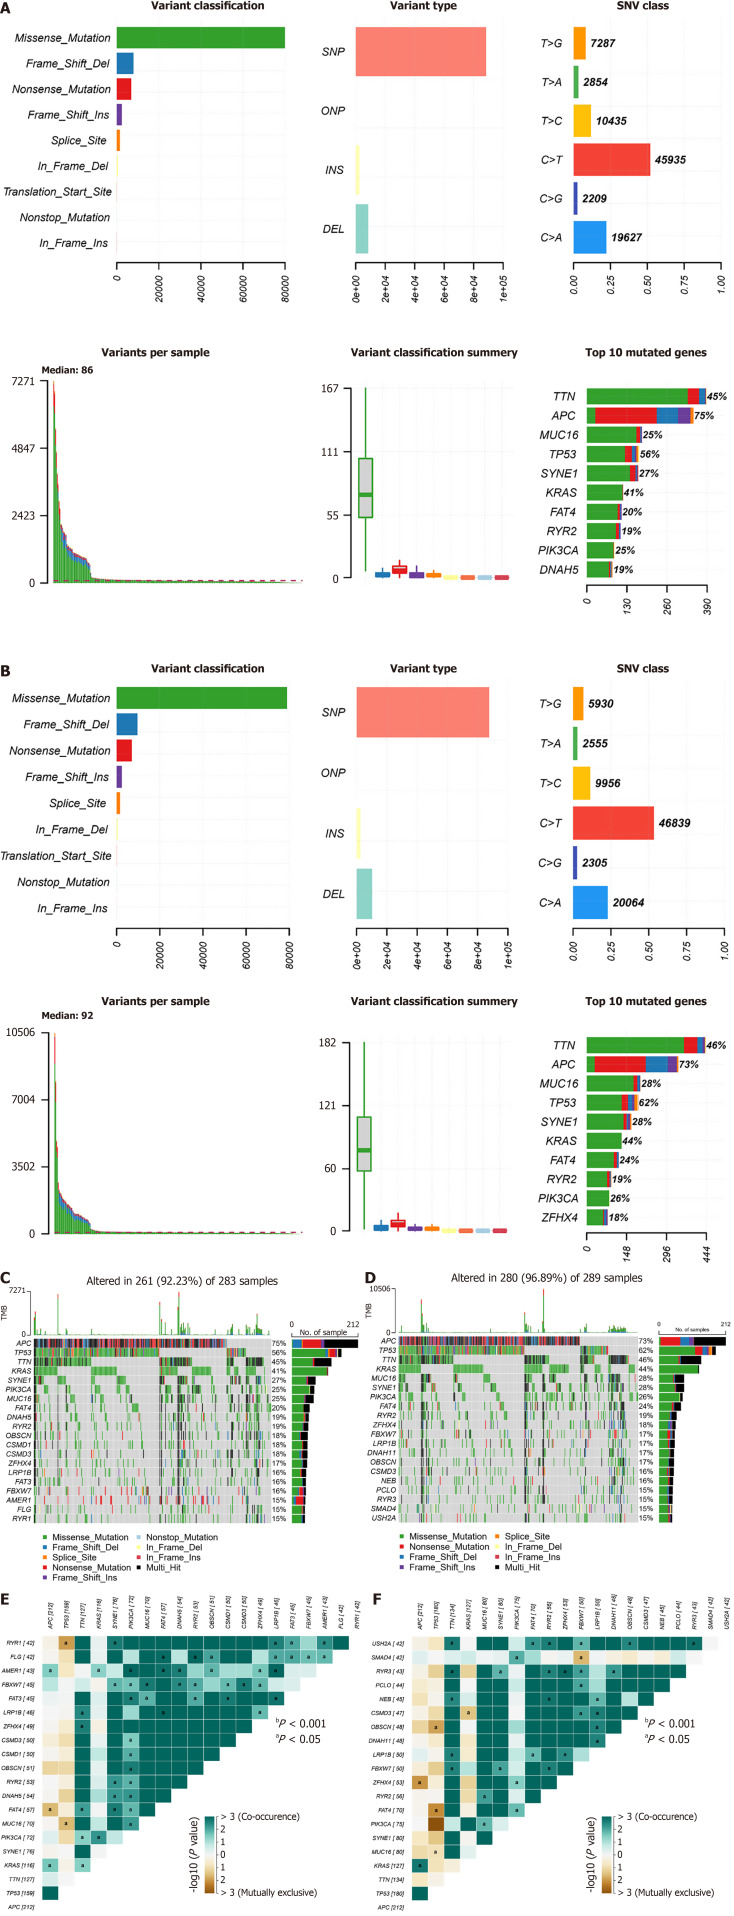
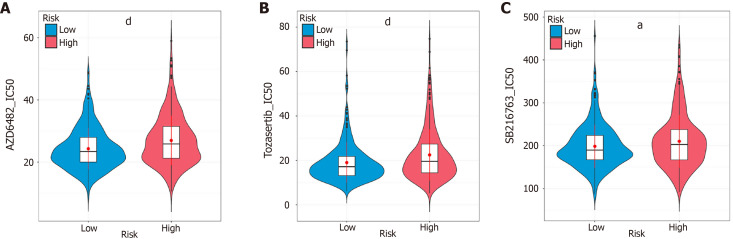
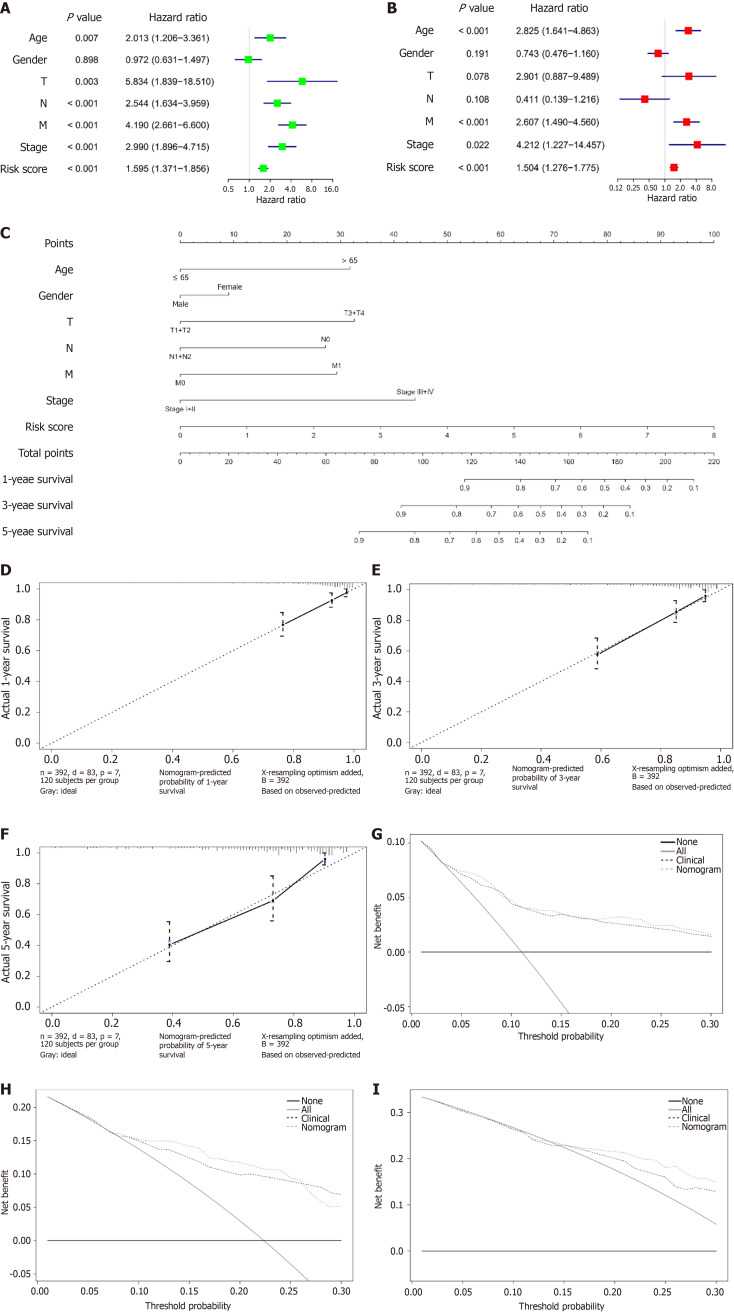
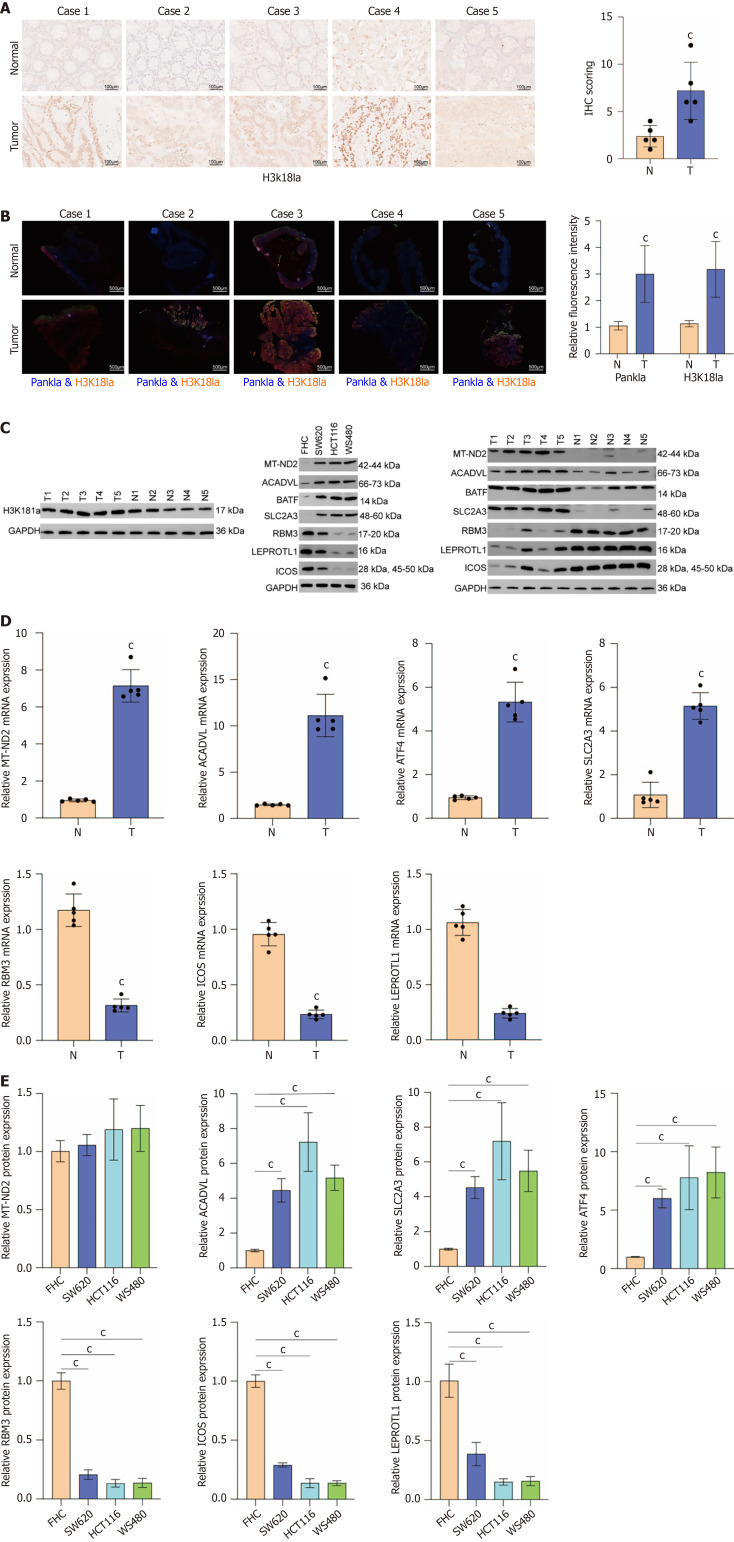
Results: Seven lactate metabolism-associated genes were significantly linked to CRC prognosis and used to construct a predictive model. This model accurately forecasts patient outcomes and reveals notable distinct patterns of immune infiltration and transcriptomic profiles mutation profiles between high- and low-risk groups. High-risk patients demonstrated elevated immune cell infiltration, increased mutation frequencies, and heightened sensitivity to specific drugs (AZD6482, tozasertib, and SB216763), providing a foundation for personalized treatment approaches. Additionally, a nomogram integrating clinical and metabolic data effectively predicted 1-, 3-, and 5-year survival rates.

Conclusion: This report underscored the pivotal mechanism of lactate metabolism in CRC prognosis and suggest novel avenues for therapeutic intervention.

Keywords: Colorectal cancer; Gene mutation analysis; Immune infiltration; Lactate metabolism; Prognostic model.


Conflict of interest statement

Conflict-of-interest statement: All the authors report no relevant conflicts of interest for this article.

Figures

Figure 1
Figure 1
Cell mapping in colorectal cancer. A: Plot of RNA feature counts (nFeature_RNA) vs total RNA abundance (nCount_RNA) correlation after quality control (QC); plot of nCount_RNA vs mitochondrial percentage after QC; plot of nFeature_RNA vs mitochondrial percentage after QC; B: Violin plots of nFeature_RNA, nCount_RNA, mitochondrial gene percentage, and erythrocyte gene percentage for each sample after QC; C: Volcano plot of highly variable genes. The graph shows 23476 genes in all cells; red dots indicate highly variable genes, and the top 10 most variable genes are labeled in the graph; D: Uniform manifold approximation and projection distribution map of 16 cell clusters identified after cluster analysis and dimensionality reduction analysis; E: Uniform manifold approximation and projection distribution map of 11 cell subclusters identified after annotation; F: Expression bubble plots of marker genes in 11 cell subgroups; G: Ratio of the 11 cell subpopulations in tumor tissues and normal tissues. nFeature_RNA: RNA feature counts; nCount_RNA: Total RNA abundance; UMAP: Uniform manifold approximation and projection; NK: Natural killer.
Figure 2
Figure 2
Monocytes/macrophages exhibit high lactate metabolic activity. A: Uniform manifold approximation and projection heatmap of lactate metabolic activity in 11 cell subpopulations; B: Boxplot of lactate metabolic activity in 11 cell subpopulations; C: Uniform manifold approximation and projection heatmap of glycolysis/gluconeogenesis pathway activity in 11 cellular subpopulations; D: Cellular communication network of monocytes/macrophages with the remaining 10 cell subpopulations; E: Ligand-receptor dot plot of monocytes/macrophages with B cells, CD4+ T cells, monocytes/macrophages, and regulatory T cells. UMAP: Uniform manifold approximation and projection; AUC: Area under the curve; NK: Natural killer; TNFSF: Tumor necrosis factor superfamily member; TNFRSF: Tumor necrosis factor receptor superfamily; MIF: Migration inhibitory factor; CXCR4: C-X-C motif chemokine receptor-4; ANXA: Annexin A.
Figure 3
Figure 3
Prognostic modeling of lactate metabolism characteristics in colorectal cancer. A: Screening for the optimal penalty parameter (λ) in LASSO Cox analysis; B: Coefficients of genes in LASSO Cox analysis; C: Forest plot of seven independent prognostic factors; D: Heatmap of the expression levels of 7 lactate metabolism genes in the high- and low-risk score groups; E: Risk score distribution of samples in The Cancer Genome Atlas database-colon and rectal adenocarcinomas (TCGA-COADREAD) cohort; F: Scatterplot of the survival status of COADREAD patients in the TCGA-COADREAD cohort according to the risk score distribution; G: Principal component analysis distribution plot of patients with high and low risk scores based on the expression profiles of 7 genes related to lactate metabolism; H: Kaplan-Meier survival curves of patients in the TCGA-COADREAD cohort with high and low risk scores; I: Receiver operating characteristic curves of patients in the TCGA-COADREAD cohort with the risk score for predicting 1-, 3-, and 5-year survival; J: Receiver operating characteristic curves for the risk score for predicting patient survival at 1, 3, and 5 years in the GSE103479 cohort. aP < 0.05, cP < 0.001. MT-ND2: Mitochondrial-dihydronicotinamide adenine dinucleotide dehydrogenase subunit 2; RBM3: RNA binding motif protein 3; ACADVL: Acyl-CoA dehydrogenase very-long-chain; SLC2A3: Solute carrier family 2 member 3; BATF: Basic leucine zipper transcription factor ATF-like; ICOS: Inducible T cell costimulator; LEPROTL1: Leptin receptor overlapping transcript-like 1; PCA: Principal component analysis; ROC: Receiver operating characteristic; AUC: Area under the curve; TCGA: The Cancer Genome Atlas database.
Figure 4
Figure 4
Immune infiltration and immunotherapy sensitivity in the risk score subgroups. A: Heatmap of immune cell infiltration levels according to single-sample gene set enrichment analysis results and estimation of stromal and immune cells in malignant tumor tissues using expression data results; B: Violin plot demonstrating the immune score in the high- and low-risk score groups; C: Violin plot demonstrating the stromal score in the high- and low-risk score groups; D: Violin plot showing the estimation of stromal and immune cells in malignant tumor tissues using expression data score in the high- and low-risk score groups; E: Violin plot demonstrating tumor purity in the high- and low-risk score groups; F: Cell type identification by estimating relative subsets of RNA transcripts results demonstrating the infiltration levels of 10 immune cells in the high- and low-risk score groups; G: Scatter plot of the correlation between the risk score and cytotoxic T lymphocyte associated protein 4 expression level; H: Scatterplot of the correlation between the risk score and CD274 expression level; I: Immunopheno score (IPS) of cytotoxic T lymphocyte antigen 4 (CTLA-4)-negative/programmed death-1(PD-1)-negative colorectal cancer (CRC) patients in the high- and low-risk score subgroups; J: IPS of CTLA-4-negative/PD-1-positive CRC patients in the high- and low-risk score subgroups; K: IPS of CTLA-4-positive/PD-1-negative CRC patients in the high- and low-risk score subgroups; L: IPS of CTLA-4-positive and PD-1-positive CRC patients in the high- and low-risk score subgroups. aP < 0.05, bP < 0.01, cP < 0.001, dP < 0.0001, denote significant difference from the low-risk score subgroups. ESTIMATE: Estimation of stromal and immune cells in malignant tumor tissues using expression data; CTLA: Cytotoxic T lymphocyte antigen.
Figure 5
Figure 5
Landscape of mutations in patients in the risk score subgroups. A: Distribution of single nucleotide variant types in tumor samples in the low-risk score group; B: Distribution of single nucleotide variant types in tumor samples in the high-risk score group; C: Most common mutated genes in the low-risk score group and their mutation frequencies in the samples; D: The most common mutated genes in the high-risk score group and their mutation frequencies in the samples; E: Analysis of the relationships between cooccurring genes and mutually exclusive genes in the low-risk score group; F: Analysis of gene cooccurrences and mutually exclusive relationships in the high-risk score group. aP < 0.05. SNV: Single nucleotide variant; SNP: Single nucleotide polymorphisms; ONP: Oligonucleotide polymorphism; INS: Insertion; DEL: Deletion; TMB: Tumor mutation burden.
Figure 6
Figure 6
Sensitivity to small molecule drugs. A: Half-maximal inhibitory concentration (IC50) of AZD6482 in the high- and low-risk score groups; B: IC50 of tozasertib in the high- and low-risk score groups; C: IC50 of SB216763 in the high- and low-risk score groups. aP < 0.05, dP < 0.0001, denote significant difference from the low-risk score groups. IC50: Half-maximal inhibitory concentration.
Figure 7
Figure 7
Nomogram model for predicting survival in colorectal cancer patients. A: Forest plot of univariate Cox analysis combining clinical information and the risk score in The Cancer Genome Atlas database-colon and rectal adenocarcinomas cohort; B: Forest plot of multivariate Cox analysis combining clinical information and the risk score in The Cancer Genome Atlas database-colon and rectal adenocarcinomas cohort; C: Nomogram model constructed by integrating clinical information and the risk score; D: Calibration curve for 1-year survival; E: Calibration curve for 3-year survival; F: Calibration curve for 5-year survival; G: Decision curve for 1-year survival; H: Decision curve for 3-year survival; I: Decision curve for 5-year survival. T: Tumor; N: Node; M: Metastasis.
Figure 8
Figure 8
Expression levels of biomarkers in colorectal cancer. A: Immunohistochemistry results demonstrating the expression level of histone H3 lysine 18 lactylation in colorectal cancer (CRC) tissues and paracancerous tissues; B: Immunofluorescence results of histone H3 lysine 18 lactylation levels in tumor tissues and paracancerous tissues; C: Western blot results demonstrating the protein expression levels of mitochondrial-dihydronicotinamide adenine dinucleotide dehydrogenase subunit 2 (MT-ND2), acyl-CoA dehydrogenase very-long-chain (ACADVL), solute carrier family 2 member 3 (SLC2A3), basic leucine zipper transcription factor ATF-like (BATF), RNA binding motif protein 3 (RBM3), inducible T cell costimulatory (ICOS), leptin receptor overlapping transcript-like 1 (LEPROTL1) in CRC tissues/paracancerous tissues, and normal colon cell/CRC cell lines (SW620, HCT116, WS480); D: The quantitative real-time fluorescence polymerase chain reaction results demonstrating the expression levels of MT-ND2, ACADVL, SLC2A3, BATF, RBM3, ICOS, and LEPROTL1 in CRC tissues and paracancerous tissues; E: The quantitative real-time fluorescence polymerase chain reaction results demonstrate the expression levels of MT-ND2, ACADVL, SLC2A3, BATF, RBM3, ICOS, and LEPROTL1 in normal colon cell and CRC cell lines (SW620, HCT116, WS480). cP < 0.001, compared with normal group. H3K18 La: Histone H3 lysine 18 lactylation; MT-ND2: Mitochondrial-dihydronicotinamide adenine dinucleotide dehydrogenase subunit 2; ACADVL: Acyl-CoA dehydrogenase very-long-chain; SLC2A3: Solute carrier family 2 member 3; BATF: Basic leucine zipper transcription factor ATF-like; RBM3: RNA binding motif protein 3; ICOS: Inducible T cell costimulatory; LEPROTL1: Leptin receptor overlapping transcript-like 1; FHC: Normal colon cells.

Similar articles

References

    1. Adebayo AS, Agbaje K, Adesina SK, Olajubutu O. Colorectal Cancer: Disease Process, Current Treatment Options, and Future Perspectives. Pharmaceutics. 2023;15:2620. - PMC - PubMed
    1. Wu Y, Li Y, Xiong X, Liu X, Lin B, Xu B. Recent advances of pathomics in colorectal cancer diagnosis and prognosis. Front Oncol. 2023;13:1094869. - PMC - PubMed
    1. Ouchi A, Shida D, Hamaguchi T, Takashima A, Ito Y, Ueno H, Ishiguro M, Takii Y, Ikeda S, Ohue M, Fujita S, Shiozawa M, Kataoka K, Ito M, Tsukada Y, Akagi T, Inomata M, Shimada Y, Kanemitsu Y. Challenges of improving treatment outcomes for colorectal and anal cancers in Japan: the Colorectal Cancer Study Group (CCSG) of the Japan Clinical Oncology Group (JCOG) Jpn J Clin Oncol. 2020;50:368–378. - PubMed
    1. Dohrn N, Klein MF. Colorectal cancer: current management and future perspectives. Br J Surg. 2023;110:1256–1259. - PubMed
    1. Kasprzak A. The Role of Tumor Microenvironment Cells in Colorectal Cancer (CRC) Cachexia. Int J Mol Sci. 2021;22:1565. - PMC - PubMed

MeSH terms