. 2025;85(7):757.
doi: 10.1140/epjc/s10052-025-14354-z. Epub 2025 Jul 9.

Measurement of the inhomogeneity of the KATRIN tritium source electric potential by high-resolution spectroscopy of conversion electrons from 83 m Kr

Collaborators, Affiliations

Measurement of the inhomogeneity of the KATRIN tritium source electric potential by high-resolution spectroscopy of conversion electrons from 83 m Kr

KATRIN Collaboration. Eur Phys J C Part Fields. 2025.

Abstract

Precision spectroscopy of the electron spectrum of the tritium β -decay near the kinematic endpoint is a direct method to determine the effective electron antineutrino mass. The KArlsruhe TRItium Neutrino (KATRIN) experiment aims to determine this quantity with a sensitivity of better than 0.3 eV ( 90 % C.L.). An inhomogeneous electric potential in the tritium source of KATRIN can lead to distortions of the β -spectrum, which directly impact the neutrino-mass observable. This effect can be quantified through precision spectroscopy of the conversion-electrons of co-circulated metastable 83 m Kr . Therefore, dedicated, several-weeks long measurement campaigns have been performed within the KATRIN data taking schedule. In this work, we infer the tritium source potential observables from these measurements, and present their implications for the neutrino-mass determination.


Figures

Fig. 1
Fig. 1
The KATRIN beamline. Tritium is circulated through the source section. The β-decay electrons from the tritium decay are guided through the transport and pumping section into the main spectrometer, where an integral measurement of their energy is performed. The spectrometer follows the MAC-E filter principle, where the electrons’ momenta are magnetically collimated parallel to an electrostatic retarding field. Electrons with surplus energy can pass and are counted at a detector. The retarding potential is defined by the difference of the spectrometer (Uana) and source (Usrc) potentials. The latter is influenced by the surface of the walls, a bias voltage on the rear wall, and by a cold plasma formed by scattering of the β-decay electrons on the gas molecules. Gaseous 83mKr can be co-circulated with tritium to study the source potential
Fig. 2
Fig. 2
Visualization of the relation between longitudinal starting potential and measurable observables. z=0 corresponds to the gas injection point of the tritium source. The positive z-axis points towards the KATRIN spectrometer (upstream), while the negative z-axis points towards the rear wall. a Exemplary longitudinal starting potential Usrc(z,r,ϕ) for arbitrary values of r and ϕ, according to [26]. b Longitudinal gas profile (solid line) and scattering probability for electrons leaving the KATRIN source in downstream direction without scattering (dashed red line) or with a single scattering event (dashed blue line). The plot shows that unscattered electrons preferentially originate from the downstream part of the source while singly scattered electrons originate largely from the upstream part. Higher order scattering is not displayed. c Electron starting potential distribution in the KATRIN source, considering the source gas profile and the scattering probabilities, for both unscattered and singly scattered electrons [13]. d For illustration purposes: Starting potential distribution approximated by a Gaussian for unscattered and single scattered electrons. The average potential is described by Usrcz(r,ϕ), the variance of distributions by σ02 and σ12, indicating the source-potential broadening. The shift between the distributions is denoted by Δ10 and accounts for asymmetries in the potential [13]
Fig. 3
Fig. 3
Integral spectrum of the N23-32 line doublet and the N1-32 line of 83mKr from internal conversion. The spectrum consists of an unscattered portion (green) and a singly scattered portion (purple) which is shifted by approximately 13 eV towards lower energies due to inelastic energy losses. The inhomogeneous source potential is characterized by a line broadening σ0 and an additional shift Δ10 between the spectra of singly scattered and unscattered electrons. Both parameters can be directly determined from the spectrum of 83mKr. The region of singly scattered electrons from N23-32 overlaps with the unscattered N1-32 line
Fig. 4
Fig. 4
Measurement of the L3-32 line position μ as function of rear-wall voltage URW. The line position (colored) depends on both the rear-wall voltage and the radial distance from the source tube center, as measured by the radius of the rings at the focal plane detector. The standard deviation of ring-wise line positions (black) per rear-wall voltage set point is minimal around - 0.3 V, which was identified as the optimal rear-wall voltage and used for the subsequent measurements
Fig. 5
Fig. 5
Spectral fit of patch 0 of the 75% column-density measurement taken during KrM5. The recorded detector count rate, fit and normalized residuals are shown over the retarding potential set points qU. The numbers and positions of the pixels of patch 0 are shown in the FPD-wafer schematic
Fig. 6
Fig. 6
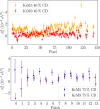
Squared source-potential broadening σ02 for the 40 and 75% column-density measurements over radial FPD resolution, comparing the measurement campaigns KrM5 and KrM9. From the bare fit broadening σ2, which is non-negative, additional broadening contributions σadd2 have been subtracted. Their uncertainties are not shown, since they are fully correlated over all data points in a data set. Two noteworthy features are visible: A dip in the broadening between pixel 25 to 50 and an oscillating pattern in the KrM5 measurement at 40% column density (yellow), and a small broadening in patch 0 of the KrM9 data set at 75% column density (purple)
Fig. 7
Fig. 7
Source-potential broadening σ02 as a function of the rear-wall voltage, measured at 75 and 40% column density. From the bare fit broadening σ2 of the N23-32 lines, which is constrained to the non-negative parameter region, contributions σadd2 have been subtracted. The error bars contain statistical and high-voltage-related uncertainty, which is uncorrelated between the data points. A slight slope of -2.0(6)10-3eV2/V within an interval of 0.4 V around the optimal rear-wall voltage of - 0.3 V is observed for the measurement at 40% column density. This dependency is not visible in the measurement at 75% column density within the margin of errors

References

    1. Y. Fukuda et al., Phys. Rev. Lett. 81, 1562–1567 (1998). 10.1103/PhysRevLett.81.1562
    1. Q.R. Ahmad et al., Phys. Rev. Lett. 89, 011301 (2002). 10.1103/PhysRevLett.89.011301 - PubMed
    1. J.A. Formaggio, A.L.C. de Gouva, R.G.H. Robertson, Phys. Rep. 914, 1–54 (2021). 10.1016/j.physrep.2021.02.002
    1. R.G.H. Robertson et al., Phys. Rev. Lett. 67, 957–960 (1991). 10.1103/PhysRevLett.67.957 - PubMed
    1. W. Stoeffl, D.J. Decman, Phys. Rev. Lett. 75, 3237–3240 (1995). 10.1103/PhysRevLett.75.3237 - PubMed